

IRIS-EDA: An integrated RNA-Seq interpretation system for gene expression data analysis
- PMID: 30763315
- PMCID: PMC6392338
- DOI: 10.1371/journal.pcbi.1006792
IRIS-EDA: An integrated RNA-Seq interpretation system for gene expression data analysis
Abstract
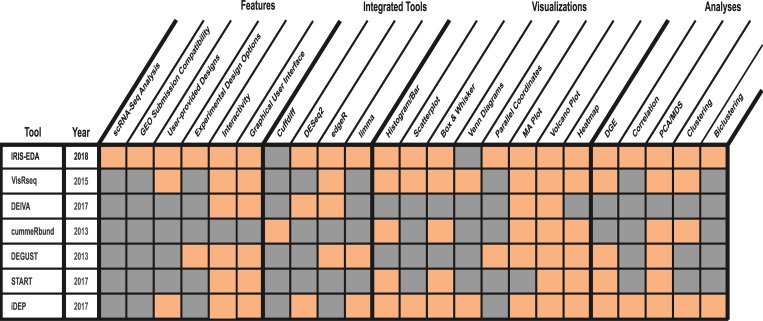
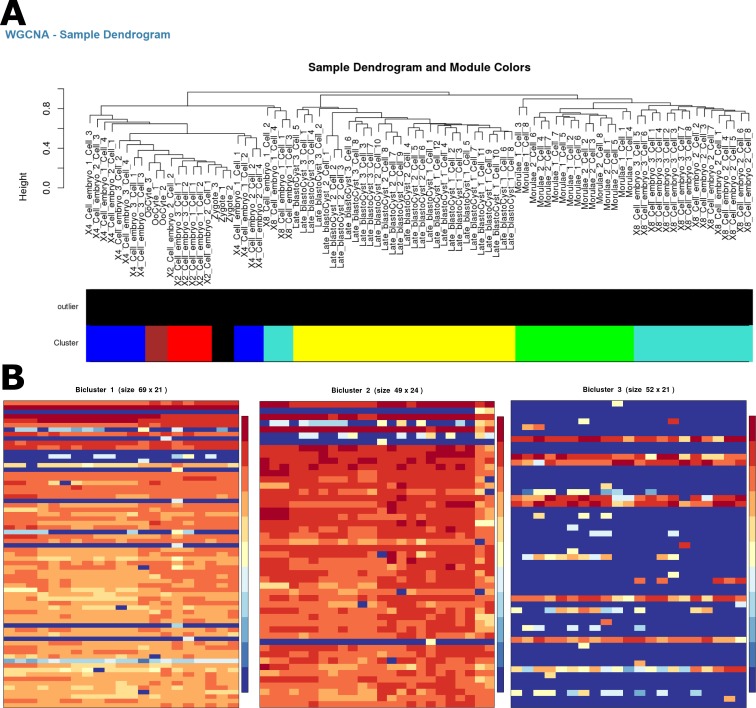
Next-Generation Sequencing has made available substantial amounts of large-scale Omics data, providing unprecedented opportunities to understand complex biological systems. Specifically, the value of RNA-Sequencing (RNA-Seq) data has been confirmed in inferring how gene regulatory systems will respond under various conditions (bulk data) or cell types (single-cell data). RNA-Seq can generate genome-scale gene expression profiles that can be further analyzed using correlation analysis, co-expression analysis, clustering, differential gene expression (DGE), among many other studies. While these analyses can provide invaluable information related to gene expression, integration and interpretation of the results can prove challenging. Here we present a tool called IRIS-EDA, which is a Shiny web server for expression data analysis. It provides a straightforward and user-friendly platform for performing numerous computational analyses on user-provided RNA-Seq or Single-cell RNA-Seq (scRNA-Seq) data. Specifically, three commonly used R packages (edgeR, DESeq2, and limma) are implemented in the DGE analysis with seven unique experimental design functionalities, including a user-specified design matrix option. Seven discovery-driven methods and tools (correlation analysis, heatmap, clustering, biclustering, Principal Component Analysis (PCA), Multidimensional Scaling (MDS), and t-distributed Stochastic Neighbor Embedding (t-SNE)) are provided for gene expression exploration which is useful for designing experimental hypotheses and determining key factors for comprehensive DGE analysis. Furthermore, this platform integrates seven visualization tools in a highly interactive manner, for improved interpretation of the analyses. It is noteworthy that, for the first time, IRIS-EDA provides a framework to expedite submission of data and results to NCBI's Gene Expression Omnibus following the FAIR (Findable, Accessible, Interoperable and Reusable) Data Principles. IRIS-EDA is freely available at http://bmbl.sdstate.edu/IRIS/.
Conflict of interest statement
The authors have declared that no competing interests exist.
Figures


Similar articles
-
Visualization of Single Cell RNA-Seq Data Using t-SNE in R.Methods Mol Biol. 2020;2117:159-167. doi: 10.1007/978-1-0716-0301-7_8. Methods Mol Biol. 2020. PMID: 31960377
-
Fast interpolation-based t-SNE for improved visualization of single-cell RNA-seq data.Nat Methods. 2019 Mar;16(3):243-245. doi: 10.1038/s41592-018-0308-4. Epub 2019 Feb 11. Nat Methods. 2019. PMID: 30742040 Free PMC article.
-
SC1: A Tool for Interactive Web-Based Single-Cell RNA-Seq Data Analysis.J Comput Biol. 2021 Aug;28(8):820-841. doi: 10.1089/cmb.2021.0051. Epub 2021 Jun 11. J Comput Biol. 2021. PMID: 34115950
-
Critical downstream analysis steps for single-cell RNA sequencing data.Brief Bioinform. 2021 Sep 2;22(5):bbab105. doi: 10.1093/bib/bbab105. Brief Bioinform. 2021. PMID: 33822873 Review.
-
Computational approaches for interpreting scRNA-seq data.FEBS Lett. 2017 Aug;591(15):2213-2225. doi: 10.1002/1873-3468.12684. Epub 2017 Jun 12. FEBS Lett. 2017. PMID: 28524227 Free PMC article. Review.
Cited by
-
Development of a bioinformatics platform for analysis of quantitative transcriptomics and proteomics data: the OMnalysis.PeerJ. 2021 Nov 9;9:e12415. doi: 10.7717/peerj.12415. eCollection 2021. PeerJ. 2021. PMID: 34820180 Free PMC article.
-
scREAD: A Single-Cell RNA-Seq Database for Alzheimer's Disease.iScience. 2020 Nov 5;23(11):101769. doi: 10.1016/j.isci.2020.101769. eCollection 2020 Nov 20. iScience. 2020. PMID: 33241205 Free PMC article.
-
Inferring and analyzing gene regulatory networks from multi-factorial expression data: a complete and interactive suite.BMC Genomics. 2021 May 26;22(1):387. doi: 10.1186/s12864-021-07659-2. BMC Genomics. 2021. PMID: 34039282 Free PMC article.
-
MetaOmGraph: a workbench for interactive exploratory data analysis of large expression datasets.Nucleic Acids Res. 2020 Feb 28;48(4):e23. doi: 10.1093/nar/gkz1209. Nucleic Acids Res. 2020. PMID: 31956905 Free PMC article.
-
Integrative Differential Expression Analysis for Multiple EXperiments (IDEAMEX): A Web Server Tool for Integrated RNA-Seq Data Analysis.Front Genet. 2019 Mar 29;10:279. doi: 10.3389/fgene.2019.00279. eCollection 2019. Front Genet. 2019. PMID: 30984248 Free PMC article.
References
-
- Prince ME, Sivanandan R, Kaczorowski A, Wolf GT, Kaplan MJ, Dalerba P, et al. Identification of a subpopulation of cells with cancer stem cell properties in head and neck squamous cell carcinoma. Proc Natl Acad Sci U S A. 2007;104(3):973–8. Epub 2007/01/11. 10.1073/pnas.0610117104 - DOI - PMC - PubMed
Publication types
MeSH terms
Substances
Grants and funding
LinkOut - more resources
Full Text Sources
Other Literature Sources
Research Materials
Miscellaneous
