. 2019 Feb 13;25(2):261-272.e5.
doi: 10.1016/j.chom.2019.01.019.

Virome Diversity Correlates with Intestinal Microbiome Diversity in Adult Monozygotic Twins

Affiliations

Virome Diversity Correlates with Intestinal Microbiome Diversity in Adult Monozygotic Twins

J Leonardo Moreno-Gallego et al. Cell Host Microbe. .

Abstract

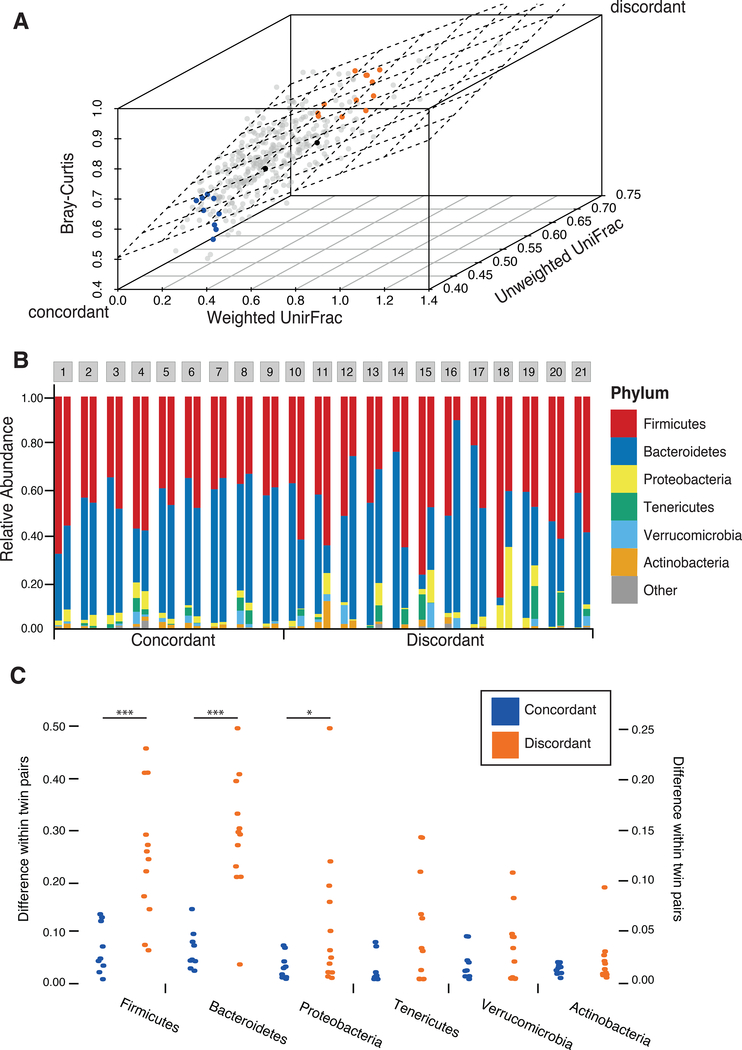
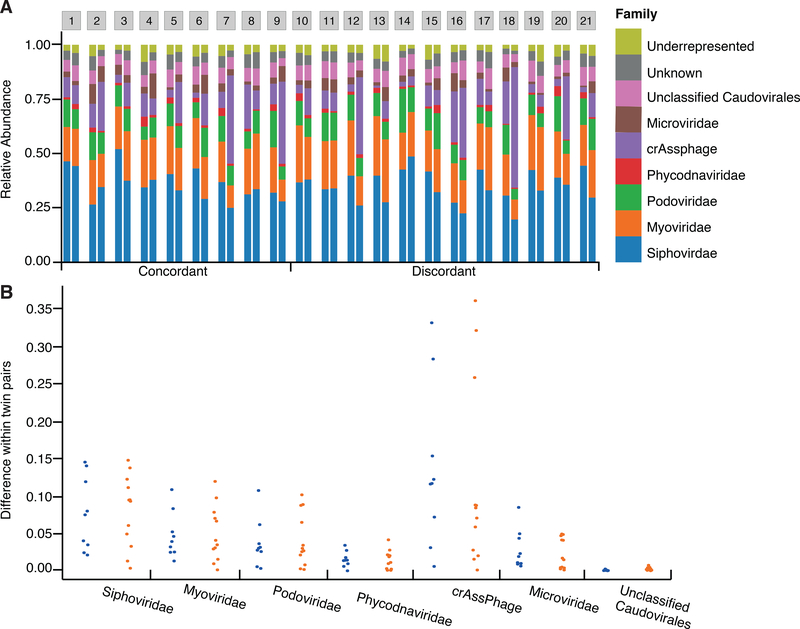
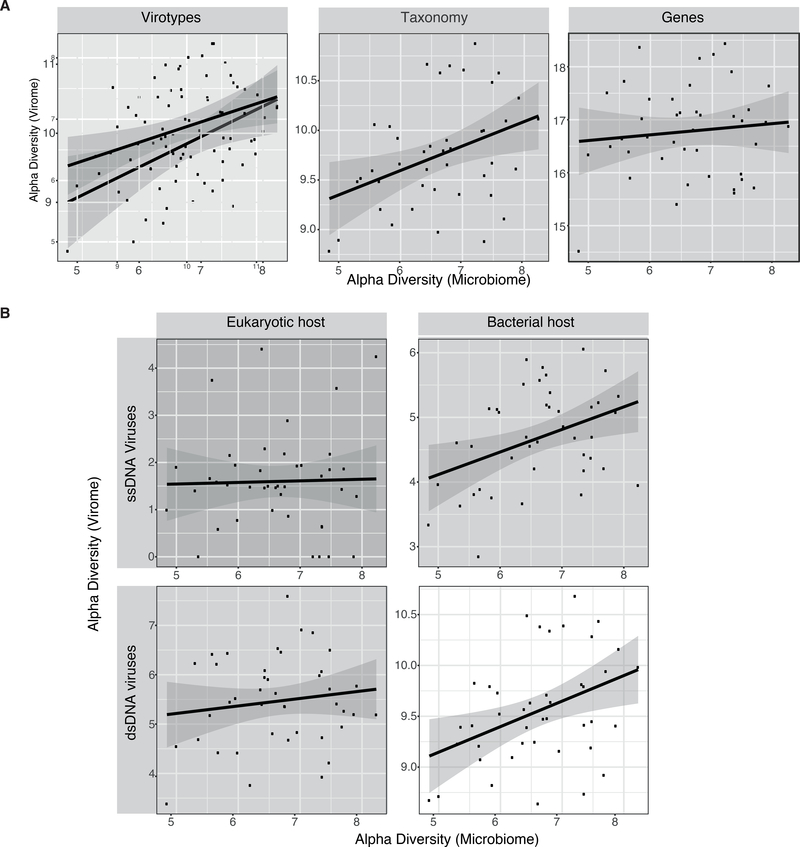
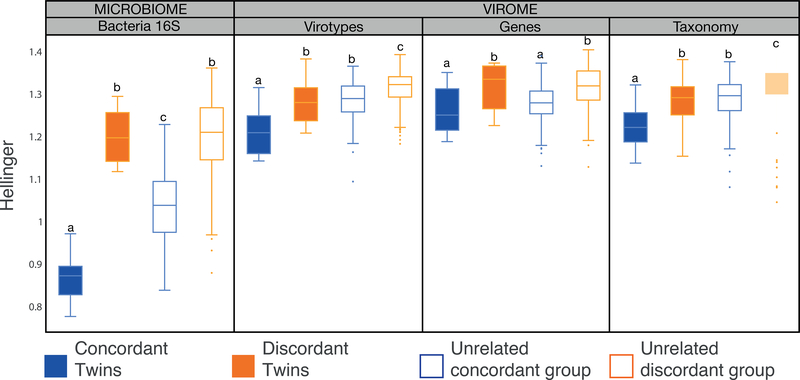
The virome is one of the most variable components of the human gut microbiome. Within twin pairs, viromes have been shown to be similar for infants, but not for adults, indicating that as twins age and their environments and microbiomes diverge, so do their viromes. The degree to which the microbiome drives the vast virome diversity is unclear. Here, we examine the relationship between microbiome and virome diversity in 21 adult monozygotic twin pairs selected for high or low microbiome concordance. Viromes derived from virus-like particles are unique to each individual, are dominated by Caudovirales and Microviridae, and exhibit a small core that includes crAssphage. Microbiome-discordant twins display more dissimilar viromes compared to microbiome-concordant twins, and the richer the microbiomes, the richer the viromes. These patterns are driven by bacteriophages, not eukaryotic viruses. Collectively, these observations support a strong role of the microbiome in patterning for the virome.

Keywords: concordant and discordant monozygotic twins; human gut microbiome; human gut virome.


Conflict of interest statement

DECLARATION OF INTERESTS

The authors declare no competing interests.

Figures

Figure 1.
Figure 1.. Microbiome discordance in twin pairs.
(A) The β-diversity measures of the microbiotas of 354 monozygotic twin pairs from a previous study (Goodrich et al., 2014) are shown. Each dot represents the β-diversity of a pair of twins, measured by the weighted UniFrac (x-axis), unweighted UniFrac (z-axis), and Bray-Curtis (y-axis) β-diversity metrics. The plane is the least squared fitted plane Bray-Curtis ~ Weighted UniFrac + Unweighted UniFrac. A subset of twin pairs with concordant microbiotas (blue) and discordant microbiotas (orange) were chosen from the two edges. Black dots indicate the samples used for virome and whole fecal metagenome comparison. (B) Comparison of the taxonomic profiles (relative abundance) at the Phylum level for the 21 MZ twin pairs concordant (1–9) or discordant (10–21) for their microbiotas. (C) Differences in the relative abundances for the major phyla for concordant (blue points, n=9) and discordant (orange points, n=12) twin pairs. Mann-Whitney’s U test. *** p < 0.0005, * p = 0.055.
Figure 2.
Figure 2.. Bacterial contamination in VLP preparations.
(A) Heatmaps of VLP reads from a single sample (4A) mapping to bacterial genomes before (upper) and after (lower) the removal of reads determined as contaminants. Genomes are sorted by length and split in bins of 100,000 bp. Bacterial genomes with a median coverage greater than 100 were considered as contaminants. (B) Cladogram based on the NCBI taxonomy of the 65 genomes identified as contaminants across all VLP extractions. (Right) Spearman rank correlation coefficient (rho) between the abundance of the bacterial genomes in the VLP extractions and 16S rRNA gene profile from the microbiome. (Left) Total abundance of each bacterial genome added across all individuals.
Figure 3.
Figure 3.. Comparison of the gene content of whole fecal metagenomes and viromes.
(A) The relative abundance of KEGG categories in whole fecal metagenomes and viromes, including all hits to IGC genes, regardless of the annotation. (B) Heatmap of the relative abundance of the second level of KEGG categories in whole fecal metagenomes and viromes, excluding the IGC genes with unknown annotation. A.V.: Additional viromes; A.M.: Additional microbiomes (whole genome extractions). Intra-class coefficient (ICC) for A.M. = 0.99; ICC for A.V. = 0.85; ICC concordant-microbiome co-twins = 0.69; ICC discordant-microbiome cotwins = 0.68.
Figure 4.
Figure 4.. Virome composition.
Comparison of the taxonomic profiles at the Family level for the 21 MZ twin pairs concordant (1–9) or discordant (10–21) for their microbiomes. (A) The viral family composition of the MZ twins. (B) Differences of the relative abundances of each family for concordant (blue points, n=9) and discordant (orange points, n=12) twin pairs.
Figure 5.
Figure 5.. Bacteriophages diversity correlates with microbiome diversity but eukaryotic viruses diversity does not.
(A) Correlation of Shannon α-diversity of viromes to Shannon α-diversity of microbiomes (n=42). Virotypes: Pearson correlation coefficient = 0.406, m = 0.3, p = 0.007, R2 = 0.165; Taxonomy: Pearson correlation coefficient = 0.389, m = 0.25, p = 0.010, R2 = 0.151; Genes: Pearson correlation coefficient = 0.105, m = 0.11, p = 0.506, R2 = 0.011 (B) Correlation of the Shannon α-diversity of the virome, calculated from contigs annotated as ssDNA eukaryotic viruses, ssDNA phages, dsDNA eukaryotic viruses, and dsDNA phages, to Shannon α-diversity of the microbiome (n=42). ssDNA eukaryotic viruses: Pearson correlation coefficient = 0.027, m = 0.034, p = 0.863, R2 = 0.000751; ssDNA bacteriophages: Pearson correlation coefficient = 0.394, m = 0.35, p = 0.009, R2 = 0.155; dsDNA eukaryotic viruses: Pearson correlation coefficient = 0.143, m = 0.15, p = 0.368, R2 = 0.020; dsDNA bacteriophages: Pearson correlation coefficient = 0.400, m = 0.25, p = 0.008, R2 = 0.16.
Figure 6.
Figure 6.. Virome Beta-diversity patterns mirror microbiome Beta-diversity.
Box plots show the distribution of Hellinger distances for microbiomes and viromes, according to the three different layers of information recovered (virotypes, genes, and taxonomy), for concordant co-twins (solid blue, n=9), discordant co-twins (solid orange, n=12), unrelated samples within the concordant co-twins (blue outline, n=144), and unrelated samples within the discordant co-twins (orange outline, n=264). Significant differences between means (Mann-Whitney’s U test, p < 0.020) are denoted with different letters.

Comment in

  • Gut phages at the centre.
    Du Toit A. Du Toit A. Nat Rev Microbiol. 2019 Apr;17(4):195. doi: 10.1038/s41579-019-0174-9. Nat Rev Microbiol. 2019. PMID: 30820034 No abstract available.

References

    1. Alves JMP, de Oliveira AL, Sandberg TOM, Moreno-Gallego JL, de Toledo MAF, de Moura EMM, Oliveira LS, Durham AM, Mehnert DU, Zanotto PM de A, et al. (2016). GenSeed-HMM: A tool for progressive assembly using profile HMMs as seeds and its application in Alpavirinae viral discovery from metagenomic data. Front. Microbiol 7, 269. - PMC - PubMed
    1. Barylski J, Enault F, Dutilh BE, Schuller MBP, Edwards RA, Gillis A, Klumpp J, Knezevic P, Krupovic M, Kuhn JH, et al. (2017). Genomic, proteomic, and phylogenetic analysis of spounaviruses indicates paraphyly of the order Caudovirales. bioRxiv. doi: 10.1101/220434 - DOI
    1. Besemer J, Lomsadze A, and Borodovsky M (2001). GeneMarkS: a self-training method for prediction of gene starts in microbial genomes. Implications for finding sequence motifs in regulatory regions. Nucleic Acids Res. 29, 2607–2618. - PMC - PubMed
    1. Biller SJ, Schubotz F, Roggensack SE, Thompson AW, Summons RE, and Chisholm SW (2014). Bacterial vesicles in marine ecosystems. Science 343, 183–186. - PubMed
    1. Bray JR, and Curtis JT (1957). An Ordination of the Upland Forest Communities of Southern Wisconsin. Ecol. Monogr 27, 326–349.

Publication types

LinkOut - more resources