. 2019 Feb 13;25(2):285-299.e8.
doi: 10.1016/j.chom.2019.01.008.

Expansion of Bacteriophages Is Linked to Aggravated Intestinal Inflammation and Colitis

Affiliations

Expansion of Bacteriophages Is Linked to Aggravated Intestinal Inflammation and Colitis

Lasha Gogokhia et al. Cell Host Microbe. .

Abstract

Bacteriophages are the most abundant members of the microbiota and have the potential to shape gut bacterial communities. Changes to bacteriophage composition are associated with disease, but how phages impact mammalian health remains unclear. We noted an induction of host immunity when experimentally treating bacterially driven cancer, leading us to test whether bacteriophages alter immune responses. Treating germ-free mice with bacteriophages leads to immune cell expansion in the gut. Lactobacillus, Escherichia, and Bacteroides bacteriophages and phage DNA stimulated IFN-γ via the nucleotide-sensing receptor TLR9. The resultant immune responses were both phage and bacteria specific. Additionally, increasing bacteriophage levels exacerbated colitis via TLR9 and IFN-γ. Similarly, ulcerative colitis (UC) patients responsive to fecal microbiota transplantation (FMT) have reduced phages compared to non-responders, and mucosal IFN-γ positively correlates with bacteriophage levels. Bacteriophages from active UC patients induced more IFN-γ compared to healthy individuals. Collectively, these results indicate that bacteriophages can alter mucosal immunity to impact mammalian health.

Keywords: FMT; IFN-y; T cells; TLR9; Th1; bacteriophages; colitis; dendritic cells.


Conflict of interest statement

DECLARATION OF INTEREST

The authors declare no conflict of interest.

Figures

Figure 1.
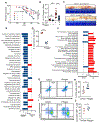
Figure 1.. Bacteriophages against AIEC can reduce bacterial and tumor burden.
(A) Electron micrograph of negatively stained, purified bacteriophages used in this study. (b) Germfree animals were colonized with a contrived community of five different organisms including E. coli NC101, Bacteriodes fragilis, Lactobacillus johnsonii, Bifidobacterium longum and Clostridium symbiosum and treated with either heat killed or live E. coli phages within their drinking water for 24 hours (indicated by arrows) and E.coli colonization was monitored overtime from the feces by plating. (C-E) Germfree animals were placed on drinking water containing phages or vehicle control and colonized with E.coli NC101. Bacterial titers in feces were determined by plating on selective media n= 6 animals per group. Levels of E. coli NC101 from animals treated in C were determined by q-RT-PCR in small intestinal luminal contents and tissue. n= 6 animals per group. Data are represented as mean ± SEM. * p<0.05, **p<0.01, ***p<0.005, ****p<0.0001 as determined by a student’s t-test. See also Figure S1.
Figure 2.
Figure 2.. Bacteriophages isolated from the human virobiota can control AIEC colonization preventing tumor growth and mortality.
(A) Survival of APCmin mice colonized with E. coli NC101 and either treated for 70 days with vehicle or a cocktail of 3 phages that infect E. coli NC101. (n=13, 6, 20 and18 animals per group, respectively). (B-C) Tumors over 8mm diameter throughout the small intestine (SI) were counted 70 days’ post-treatment (n= 8 for non-E. coli NC101 colonized controls, n=5 for phage colonized control, n=16 for vehicle treated and n=20 animals for E. coli phage cocktail treated). The results of five independent experiments are summed. (D) E. coli NC101 levels in the SI tissue determined by qRT-PCR n=6/6 animals for vehicle treated and phage treated animals. (E-F) RNAseq analysis of animals treated as in (A) (n=5 and 4 animals per group). G-J) Percentage and number of CD4+ cells and activated T cells within the MLNs in vehicle treated (n=7) and in phage treated animals (n=9). The data is representative of five different experiments. Data are represented as mean ± SEM. *p<0.05, **p<0.01, ***p<0.005, ****p<0.001 as determined by student’s t test (D, H, J), Mantel-Cox test (A) and One-way ANOVA with Holm-Sidak Multiple Comparison test (B). See also Figure S3
Figure 3.
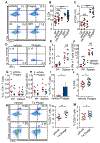
Figure 3.. Bacteriophages directly stimulate gut immune system development.
(A-J) Swiss Webster germfree animals were treated with either vehicle control or the cocktail of three E. coli phages in their drinking water for four weeks. GF indicates germfree mice, SPF indicates specific pathogen free mice, HK indicates heat-killed. (A-C) The percentage and number of CD4+ T cells determined by flow cytometry within the Peyer’s patches in the phage treated animals (n=23), the vehicle animals (n= 19), the germfree animals (n=12) and the SPF animals (n=5). These data are combined from at least four independent experiments. (D-H) The proportion of Th1 or Th17 producing cells within the PP and spleen determined by flow cytometry. Each dot indicates an individual mouse. n=8 animals per group for vehicle and phage treated groups from two independent experiments. (I) Th1 cell analysis in germfree B6 animals were treated with vehicle or the cocktail of E. coli phages within their drinking water for four weeks (n=5/group). (J) CD8+CD3+ T cells in the PPs of animals treated as described in A by flow cytometry (n=13/group). (K-M) The percentage and number of CD4+ T cells determined by flow cytometry within the Peyer’s patches of germfree animals treated with either vehicle control or T4 phage in their drinking water for four weeks. The percentage and number of CD4+ or CD8+ T cells was determined within the PP. Data are represented as mean ± SEM.*p<0.05, **p<0.01, ****p<0.001, ns-not significant as determined by student’s t test. See also Figure S4 and S5A–D.
Figure 4
Figure 4. Bacteriophages directly stimulate commensal and phage specific Th1 responses via TLR9.
(A-B) IFN-γ measured by ELISA in the supernatant of CD4+ cells co-cultured with phage primed WT, TLR3−/−, or TLR9−/− DCs derived from 3 animals. (C) IL12 measured by ELISA after 24 hours of BMDC incubation with phages and controls. (D) BMDC incubated with SYBR-green pre-stained phage (green) (bottom), or stained directly with SYBR green (top) fixed and stained with Alexa Fluor 555 Phalloidin for cytoplasm staining (red). (E) BMDCs incubated with SYBR green pre-stained phage and subsequently stained with Alexa Fluor 680 Phallodin (blue) or a Histone 2B-RFP dye (red). Each stain is shown individually and the overlay of these is shown in the bottom right. Data are represented as mean ± SEM. *p<0.05, **p<0.01, ***p<0.005, ****p<0.001, ns-not significant as determined by student’s t test (C) and One-way ANOVA with Bonferroni’s Multiple Comparison Test (A, B). See also Figure S5E and S6
Figure 5.
Figure 5.. Bacteriophages act to induce both commensal and phage specific immunity.
(A) IFN-γ measured by ELISA in the supernatant of BMDCs from MHCII−/− mice pulsed with phage for 24 hours and co-cultured with WT T cells for 72 hours. (B) IFN-γ measured by ELISA in the supernatant of BMDCs from WT mice pulsed with antigens and ovalbumin (100 μg/mL) and co-cultured with CD4+ T cells from OTII mice. (C, D) Experimental set-up of Phage-Ovalbumin co-culture experiments. IFN-γ was measured in the supernatant by ELISA. (E) Feces from bacteriophage cocktail treated germfree mice assayed for phage specific IgA by ELISA. Data are represented as mean ± SEM. *p<0.05, **p<0.01, ***p<0.005, p<0.001, ns-not significant as determined by student’s t test and One-way ANOVA with Bonferroni’s Multiple Comparison Test (A, B, D). See also Figure S7A
Figure 6.
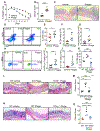
Figure 6.. Increased abundance of host-free bacteriophage within the gut exacerbates intestinal colitis.
SPF WT (A-J), TLR9−/− (K-M) IFN-γ−/− (N-O) mice were treated with the E. coli bacteriophage cocktail for 3-4 weeks prior to induction of DSS colitis. (A) Weight loss, (B, M, O) clinical score, (C, L, N) histology by H&E staining of colons from indicated animals. (D-K) Percent and number of total CD4 and CD8 T cells and Th1 and Th17 cells within the MLN of SPF WT mice was determined by flow cytometry. Data shown is from one representative experiment with 6–8 animals per group. Similar results were seen in three independent experiments with total n=23 for vehicle treated animal and n=21 for bacteriophage treated animals. Data are represented as mean ± SEM. *p<0.05, **p<0.01, ***p<0.005, ****p<0.001, ns-not significant as determined by student’s t test (B, E, F, G, I, J), Mantel-Cox test (A) and One-way ANOVA with Bonferroni’s Multiple Comparison Test (K, M, O). See also Figure S7B–G
Figure 7.
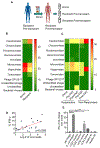
Figure 7.. Caudovirales are increased in individuals that do not respond to FMT.
(A) Prospective, open label pilot study design to assess the safety and efficacy of FMT in patients (n=20) with active Ulcerative Colitis. (B, C) Average viral relative abundance per group determined on a per-sample basis by the ratio of viral reads per taxon relative to total viral reads as classified by VirMAP. D) Correlation of total number of viral reads called by VirMAP per sample against percentage of CD4+ T cells producing IFN-γ in total lamina propria mononuclear cells (LPMC) from rectal biopsies of patients with active UC as measured by flow cytometry. Significance determined by spearman correlation. (E) IFN-γ measured by ELISA in the supernatant of BMDCs from WT mice pulsed with VLPs isolated from healthy, inactive and active UC patients for 24 hours and co-cultured with WT T cells for 72 hours. Data are represented as mean ± SEM. *p<0.05, **p<0.01, ***p<0.005, ****p<0.001, ns-not significant as determined by student’s t test. See also Figure S7J,K

Comment in

  • The Innate Sense of Bacteriophages.
    Bollyky PL, Secor PR. Bollyky PL, et al. Cell Host Microbe. 2019 Feb 13;25(2):177-179. doi: 10.1016/j.chom.2019.01.020. Cell Host Microbe. 2019. PMID: 30763530
  • Gut phages at the centre.
    Du Toit A. Du Toit A. Nat Rev Microbiol. 2019 Apr;17(4):195. doi: 10.1038/s41579-019-0174-9. Nat Rev Microbiol. 2019. PMID: 30820034 No abstract available.

References

    1. Ajami NJ, Wong MC, Ross MC, Lloyd RE, and Petrosino JF (2018). Maximal viral information recovery from sequence data using VirMAP. Nat Commun 9, 3205. - PMC - PubMed
    1. Arthur JC, Perez-Chanona E, Muhlbauer M, Tomkovich S, Uronis JM, Fan TJ, Campbell BJ, Abujamel T, Dogan B, Rogers AB, et al. (2012). Intestinal inflammation targets cancer-inducing activity of the microbiota. Science 338, 120–123. - PMC - PubMed
    1. Barker N, Ridgway RA, van Es JH, van de Wetering M, Begthel H, van den Born M, Danenberg E, Clarke AR, Sansom OJ, and Clevers H (2009). Crypt stem cells as the cells-of-origin of intestinal cancer. Nature 457, 608–611. - PubMed
    1. Barr JJ, Auro R, Furlan M, Whiteson KL, Erb ML, Pogliano J, Stotland A, Wolkowicz R, Cutting AS, Doran KS, et al. (2013). Bacteriophage adhering to mucus provide a nonhost-derived immunity. Proceedings of the National Academy of Sciences of the United States of America 110, 10771–10776. - PMC - PubMed
    1. Bauer DW, Li D, Huffman J, Homa FL, Wilson K, Leavitt JC, Casjens SR, Baines J, and Evilevitch A (2015). Exploring the Balance between DNA Pressure and Capsid Stability in Herpesviruses and Phages. J Virol 89, 9288–9298. - PMC - PubMed

Publication types

MeSH terms

Substances