

Vitamin D Status Modifies the Response to Indoor Particulate Matter in Obese Urban Children with Asthma
- PMID: 30763731
- PMCID: PMC6792389
- DOI: 10.1016/j.jaip.2019.01.051
Vitamin D Status Modifies the Response to Indoor Particulate Matter in Obese Urban Children with Asthma
Abstract
Background: Indoor fine particulate air pollution (PM2.5) is linked to asthma morbidity; however, whether vitamin D status influences individual susceptibility to airborne exposures is unclear.
Objective: We aimed to determine if vitamin D modifies the effects of indoor PM2.5 on asthma symptoms in urban children.
Methods: A total of 120 children aged 5 to 12 years with physician-diagnosed asthma were evaluated at baseline and every 3 months for 9 months. Indoor PM2.5, serum 25-hydroxy vitamin D (25-OH D) levels, and asthma symptoms were simultaneously assessed at each time point. Adjusting for confounders, generalized estimating equations assessed the 3-way interaction effects of 25-OH D, obesity, and PM on asthma symptoms.
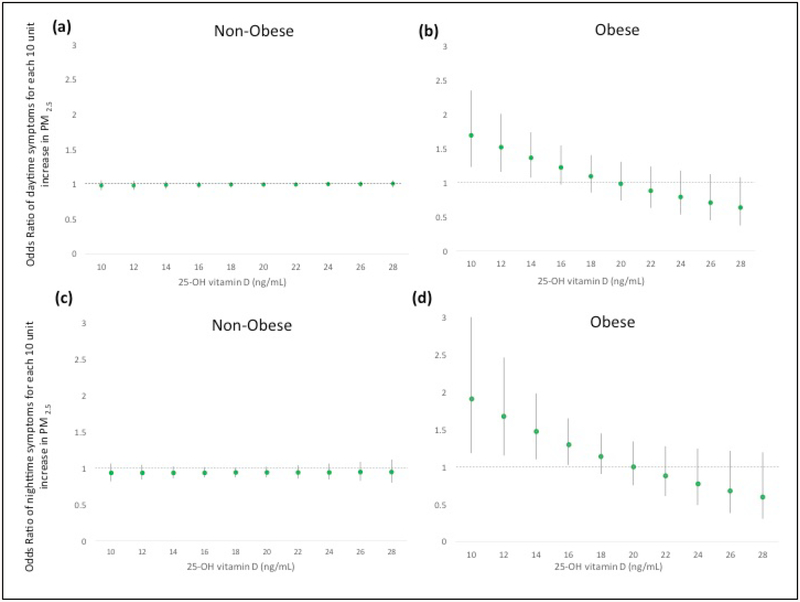
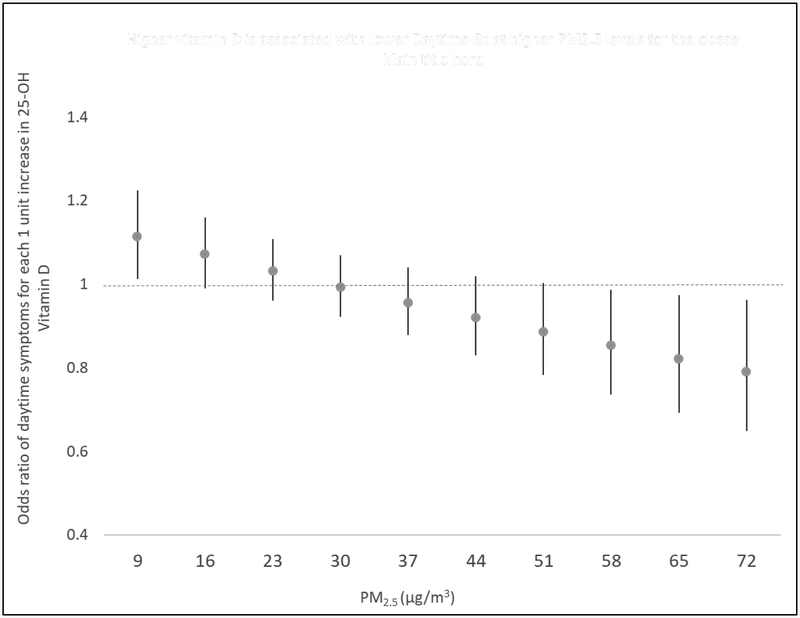
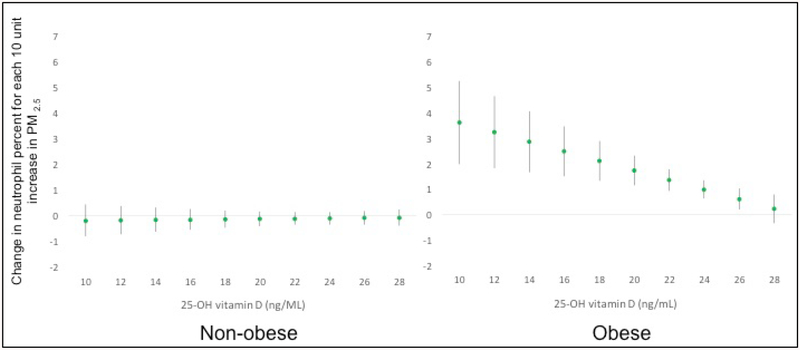
Results: Children were of mean (standard deviation [SD]) age 9.7 (2.2) years, 36% were obese, and 95% self-reported black race. Mean (SD) PM2.5 indoor exposure was 38.2 (42.9) μg/m3 and 25-OH D was 19.1 (7.5) ng/mL. Three-way interaction models demonstrated significantly greater PM2.5-associated effects on daytime asthma symptoms only among obese children with low 25-OH D levels (odds ratio [OR]PM2.5 = 1.26, P = .049 at vitamin D = 15.5 ng/mL, increasingly stronger PM effects at levels <15.5 ng/mL). In homes with increased PM2.5, higher 25-OH D was associated with decreased symptom odds (eg, ORVitamin D = 0.87; P = .049 at PM2.5 = 52.5 μg/m3, increasingly protective effects >52.5 μg/m3) among obese children.
Conclusions: Among obese urban children with asthma, low individual 25-OH D enhanced adverse respiratory effects associated with indoor PM2.5. In high PM2.5 environments, 25-OH D was protective against asthma symptoms. Optimizing vitamin D status in children may help reduce asthma morbidity driven by indoor air pollution.
Keywords: Asthma; Obesity; Particulate matter; Vitamin D.
Copyright © 2019 American Academy of Allergy, Asthma & Immunology. Published by Elsevier Inc. All rights reserved.
Conflict of interest statement
Figures
Comment in
-
Pollution, Obesity, Vitamin D, or Why Is Asthma So Complicated-and Interesting.J Allergy Clin Immunol Pract. 2019 Jul-Aug;7(6):1823-1824. doi: 10.1016/j.jaip.2019.04.015. J Allergy Clin Immunol Pract. 2019. PMID: 31279465 Free PMC article. No abstract available.
Similar articles
-
The effects of PM2.5 on asthmatic and allergic diseases or symptoms in preschool children of six Chinese cities, based on China, Children, Homes and Health (CCHH) project.Environ Pollut. 2018 Jan;232:329-337. doi: 10.1016/j.envpol.2017.08.072. Epub 2017 Sep 29. Environ Pollut. 2018. PMID: 28970023
-
Indoor particulate matter and lung function in children.Sci Total Environ. 2019 May 1;663:408-417. doi: 10.1016/j.scitotenv.2019.01.309. Epub 2019 Jan 24. Sci Total Environ. 2019. PMID: 30716631 Free PMC article.
-
Being overweight increases susceptibility to indoor pollutants among urban children with asthma.J Allergy Clin Immunol. 2013 Apr;131(4):1017-23, 1023.e1-3. doi: 10.1016/j.jaci.2012.12.1570. Epub 2013 Feb 10. J Allergy Clin Immunol. 2013. PMID: 23403052 Free PMC article.
-
Indoor air pollution and asthma in children.Proc Am Thorac Soc. 2010 May;7(2):102-6. doi: 10.1513/pats.200908-083RM. Proc Am Thorac Soc. 2010. PMID: 20427579 Free PMC article. Review.
-
Children environmental exposure to particulate matter and polycyclic aromatic hydrocarbons and biomonitoring in school environments: A review on indoor and outdoor exposure levels, major sources and health impacts.Environ Int. 2019 Mar;124:180-204. doi: 10.1016/j.envint.2018.12.052. Epub 2019 Jan 14. Environ Int. 2019. PMID: 30654326 Review.
Cited by
-
Outdoor Air Pollution and Pediatric Respiratory Disease.Clin Chest Med. 2024 Sep;45(3):531-541. doi: 10.1016/j.ccm.2024.02.025. Clin Chest Med. 2024. PMID: 39069319 Review.
-
The Effect of Particulate Matter Reduction by Indoor Air Filter Use on Respiratory Symptoms and Lung Function: A Systematic Review and Meta-analysis.Allergy Asthma Immunol Res. 2021 Sep;13(5):719-732. doi: 10.4168/aair.2021.13.5.719. Allergy Asthma Immunol Res. 2021. PMID: 34486257 Free PMC article.
-
Obesity-related asthma in children: A role for vitamin D.Pediatr Pulmonol. 2021 Feb;56(2):354-361. doi: 10.1002/ppul.25053. Epub 2020 Dec 8. Pediatr Pulmonol. 2021. PMID: 32930511 Free PMC article. Review.
-
Air Quality Index and Emergency Department Visits and Hospitalizations for Childhood Asthma.Ann Am Thorac Soc. 2022 Jul;19(7):1139-1148. doi: 10.1513/AnnalsATS.202105-539OC. Ann Am Thorac Soc. 2022. PMID: 35394903 Free PMC article.
-
The Role and Potential Pathogenic Mechanism of Particulate Matter in Childhood Asthma: A Review and Perspective.J Immunol Res. 2020 Jan 17;2020:8254909. doi: 10.1155/2020/8254909. eCollection 2020. J Immunol Res. 2020. PMID: 32411804 Free PMC article. Review.
References
-
- National Survey of Children’s Health, Data query from the Child and Adolescent Health Measurement Initiative. 2011/12; Available at: http://childhealthdata.org/browse/survey.
-
- Akinbami LJ, Moorman JE, Bailey C, Zahran HS, King M, Johnson CA, et al. Trends in asthma prevalence, health care use, and mortality in the United States, 2001–2010. NCHS Data Brief 2012. May;(94)(94):1–8. - PubMed
-
- Togias A, Fenton MJ, Gergen PJ, Rotrosen D, Fauci AS. Asthma in the inner city: the perspective of the National Institute of Allergy and Infectious Diseases. J Allergy Clin Immunol 2010. March;125(3):540–544. - PubMed
