. 2019;7(4):803-817.
doi: 10.1016/j.jcmgh.2019.01.008. Epub 2019 Feb 11.

MicroRNA-375 Suppresses the Growth and Invasion of Fibrolamellar Carcinoma

Affiliations

MicroRNA-375 Suppresses the Growth and Invasion of Fibrolamellar Carcinoma

Timothy A Dinh et al. Cell Mol Gastroenterol Hepatol. 2019.

Abstract

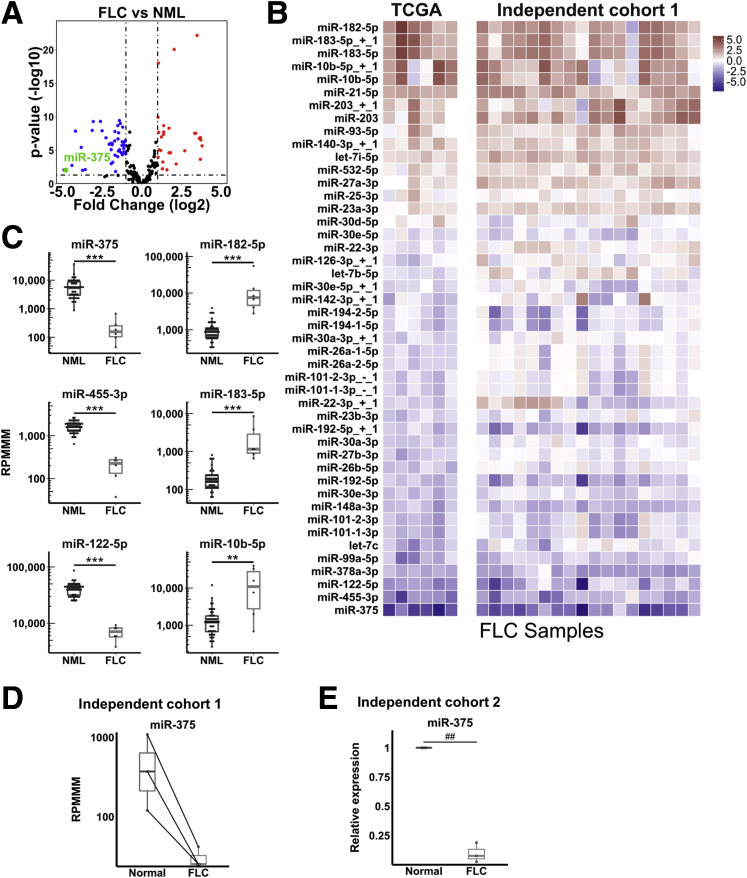
Background & aims: Fibrolamellar carcinoma (FLC) is a rare liver cancer that primarily affects adolescents and young adults. It is characterized by a heterozygous approximately 400-kb deletion on chromosome 19 that results in a unique fusion between DnaJ heat shock protein family member B1 (DNAJB1) and the alpha catalytic subunit of protein kinase A (PRKACA). The role of microRNAs (miRNAs) in FLC remains unclear. We identified dysregulated miRNAs in FLC and investigated whether dysregulation of 1 key miRNA contributes to FLC pathogenesis.

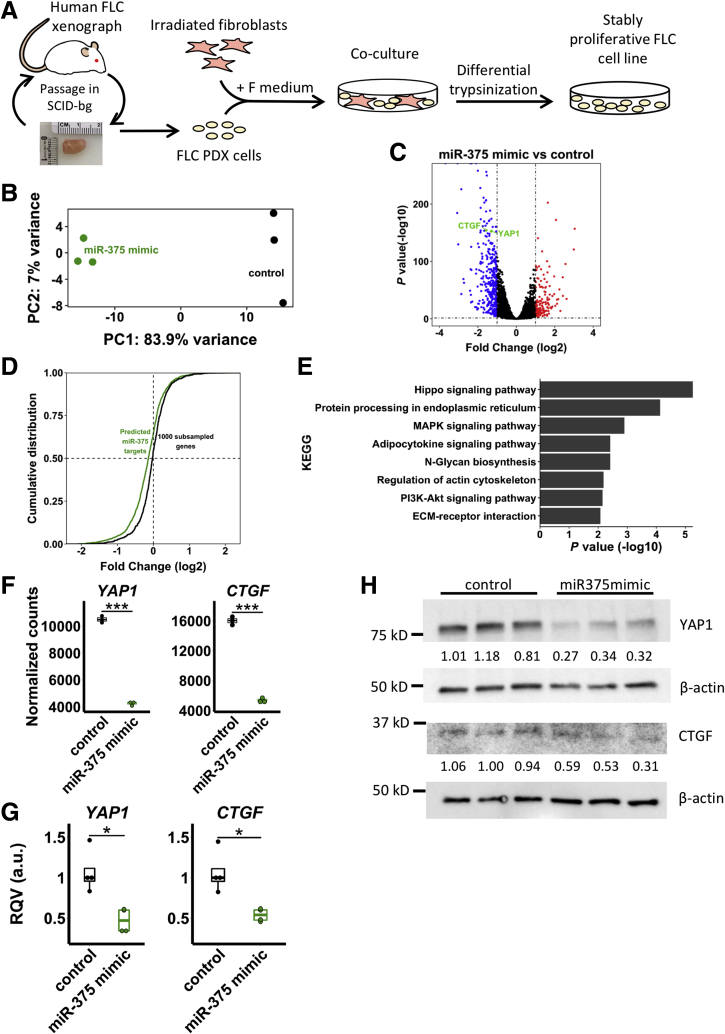
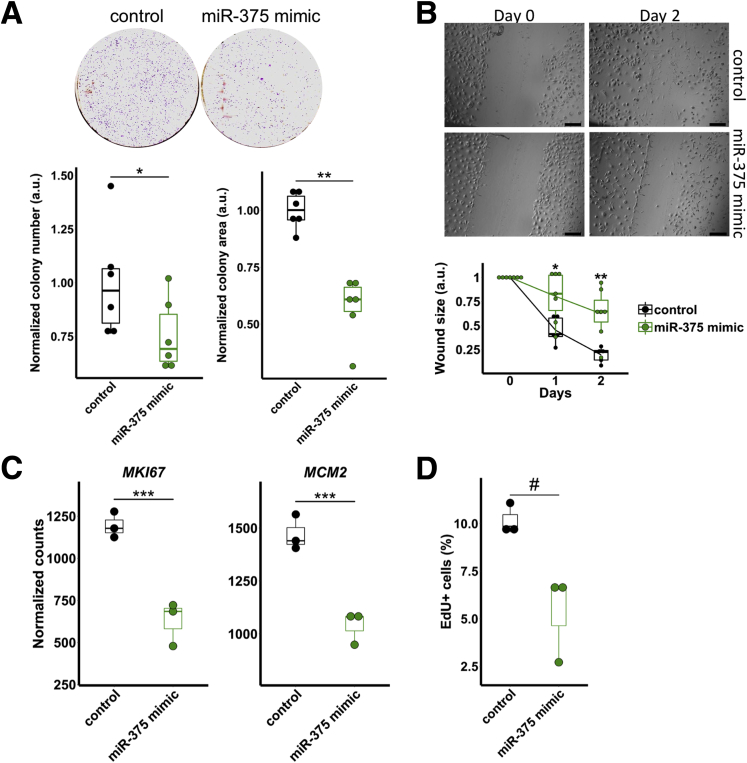
Methods: We analyzed small RNA sequencing (smRNA-seq) data from The Cancer Genome Atlas to identify dysregulated miRNAs in primary FLC tumors and validated the findings in 3 independent FLC cohorts. smRNA-seq also was performed on a FLC patient-derived xenograft model as well as purified cell populations of the liver to determine whether key miRNA changes were tumor cell-intrinsic. We then used clustered regularly interspaced short palindromic repeats/CRISPR-associated protein 9 (Cas9) technology and transposon-mediated gene transfer in mice to determine if the presence of DNAJB1-PRKACA is sufficient to suppress miR-375 expression. Finally, we established a new FLC cell line and performed colony formation and scratch wound assays to determine the functional consequences of miR-375 overexpression.

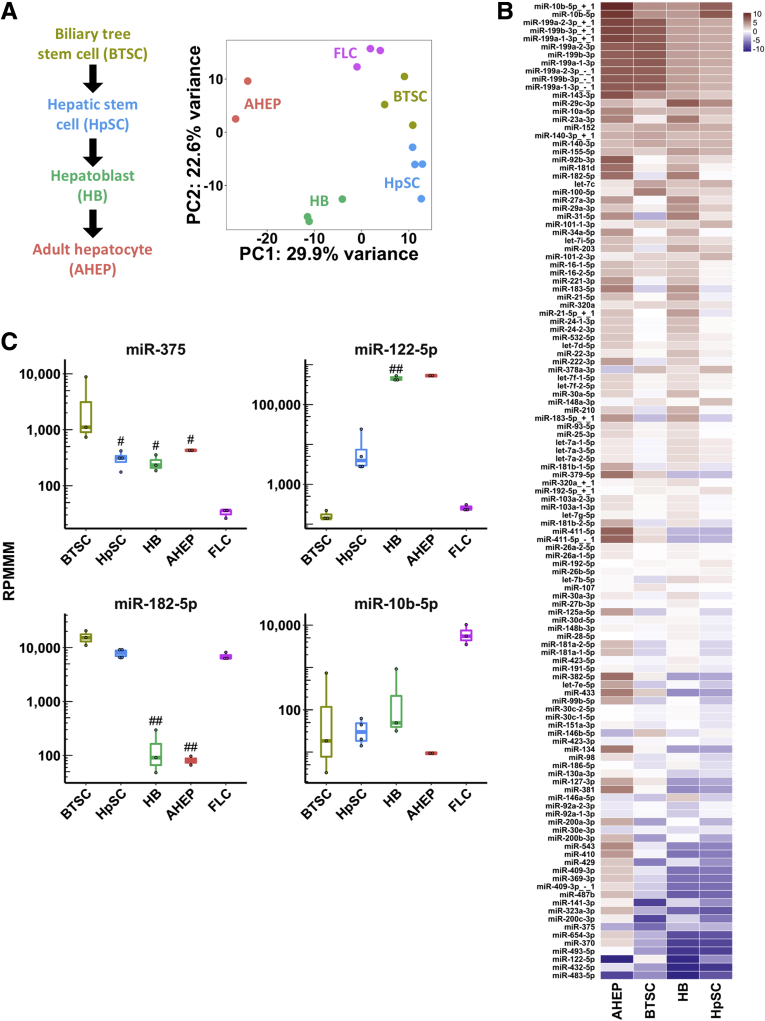
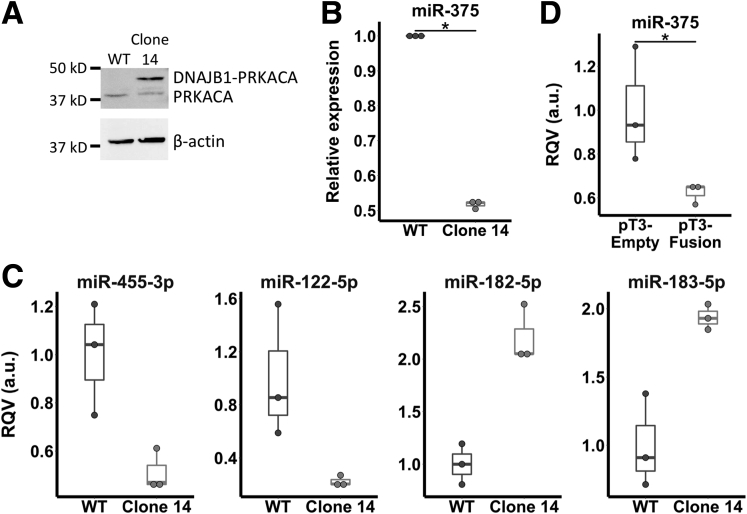
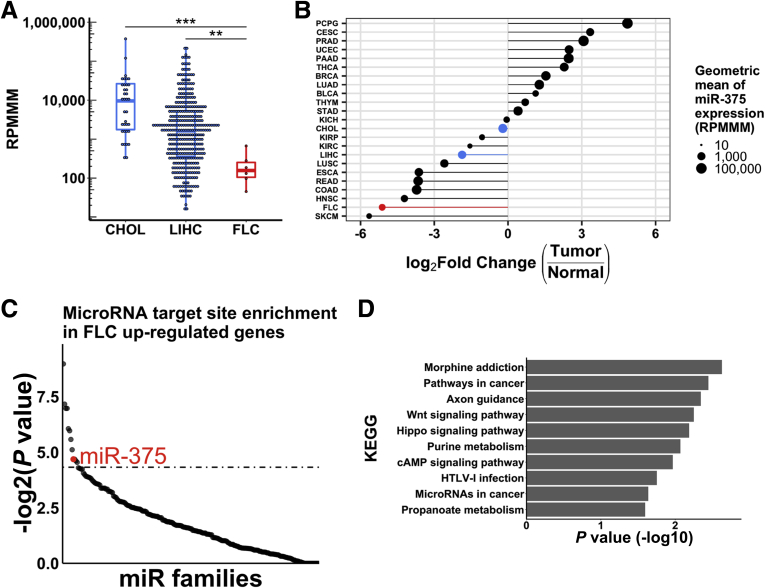
Results: We identified miR-375 as the most dysregulated miRNA in primary FLC tumors (27-fold down-regulation; P = .009). miR-375 expression also was decreased significantly in a FLC patient-derived xenograft model compared to 4 different cell populations of the liver. Introduction of DNAJB1-PRKACA by clustered regularly interspaced short palindromic repeats/CRISPR-associated protein 9 engineering and transposon-mediated somatic gene transfer in mice was sufficient to induce significant loss of miR-375 expression (P < .05). Overexpression of miR-375 in FLC cells inhibited Hippo signaling pathway proteins, including yes-associated protein 1 and connective tissue growth factor, and suppressed cell proliferation and migration (P < .05).

Conclusions: We identified miR-375 as the most down-regulated miRNA in FLC tumors and showed that overexpression of miR-375 mitigated tumor cell growth and invasive potential. These findings open a potentially new molecular therapeutic approach. Further studies are necessary to determine how DNAJB1-PRKACA suppresses miR-375 expression and whether miR-375 has additional important targets in this tumor. Transcript profiling: GEO accession numbers: GSE114974 and GSE125602.

Keywords: Cancer Genomics; Fibrolamellar Carcinoma; Pediatric Cancer; miRNA.


Figures

Figure 1
Figure 1
miR-375 is the most dysregulated miRNA in FLC. (A) Volcano plot showing differentially expressed miRNAs from TCGA small RNA-seq data in FLC (n = 6) relative to NML (n = 50). Dashed lines represent fold change of -2 or +2 (vertical) and P = .05 (horizontal). (B) Heatmaps showing miRNA expression in the TCGA cohort (n = 6) and independent validation cohort 1 (n = 18, compared with n = 3 NML). Color intensity shows log2 (fold change) relative to NML within each cohort. miRNAs are included in the heatmap if they had an average expression greater than 1000 reads per million mapped to miRNAs (RPMMM) in FLC or NML and P < .05 in the TCGA cohort. (C) Expression of 3 candidate tumor-suppressor miRNAs (miR-375, miR-455-3p, and miR-122-5p) and 3 candidate oncomiRs (miR-182-5p, miR-183-5p, and miR-10b-5p) from TCGA small RNA-seq data in FLC vs NML. Samples are plotted as individual points. Boxes represent the 25th (bottom), 50th (middle), and 75th (top) percentiles of the data. Whiskers represent data <25th and >75th percentiles. (D) Expression of miR-375 of matched FLC tumor and NML samples (n = 3) from independent cohort 1. (E) Reverse-transcription quantitative PCR validation of loss of miR-375 expression in independent cohort 2 (n = 3) of FLC samples and matched adjacent NML. Data are presented from 3 independent experiments. **P < .01, ***P < .001 (Mann–Whitney U test, 2-sided), ##P < .01 (2-tailed Student paired t test; P > .05; Wilcoxon signed-rank test).
Figure 2
Figure 2
miR-375 is dramatically suppressed in an FLC patient-derived xenograft model relative to every lineage stage of the liver. (A) Maturational trajectory depicts the lineage stages within the liver (left). Principal component analysis of small RNA-seq data from a FLC PDX model and 4 maturational lineage stages of the liver (right). (B) Heatmap showing miRNA expression in the FLC PDX model. Color intensity shows log2 (fold change) relative to 4 maturational lineage stages of the liver. miRNAs are included in the heatmap if they had an average expression >1000 reads per million mapped to miRNAs (RPMMM) in any cell type and P < .05 in any cell type compared with FLC. (C) Expression of 2 candidate tumor-suppressor miRNAs (miR-375 and miR-122-5p) and 2 candidate oncomiRs (miR-182-5p and miR-10b-5p) from small RNA-seq in 4 maturational lineage stages of the liver and the FLC PDX model. #P < .05, ##P < .01 (2-tailed Student t test; P ≥ .05, Mann–Whitney U test). PC, principal component.
Figure 3
Figure 3
Expression of DNAJB1-PRKACA fusion is sufficient to suppress miR-375 and recapitulate the miRNA dysregulation in FLC. (A) Western blot of WT and gene-edited AML12 cells (clone 14) with an antibody against PKA catalytic subunit α. The higher molecular weight band represents the DNAJB1-PRKACA fusion. Data are representative of 2 independent experiments. (B) miR-375 expression in WT (n = 3) and fusion-expressing AML12 cells (clone 14, n = 3). (C) Expression of previously described tumor-suppressor miRNAs (miR-455-3p and miR-122-5p) and oncomiRs (miR-182-5p and miR-183-5p) in AML12 cells with (clone 14, n = 3) and without (n = 3) DNAJB1-PRKACA fusion. Data are presented from 3 independent replicates. (D) miR-375 expression in liver tissue and liver tumors of mice expressing empty (pT3-empty, n = 3) and fusion-containing (pT3-fusion, n = 3) transposon, respectively. Data are presented from 3 independent biological replicates. *P < .05 (Mann–Whitney U test, 1-sided). RQV, relative quantitative value.
Figure 4
Figure 4
miR-375 is a candidate master regulator of cancer pathways in FLC. (A) Expression of miR-375 in CHOL (n = 36), LIHC (n = 366), and FLC (n = 6) in TCGA smRNA-seq data. (B) Log2 (fold change) of miR-375 expression in different tumor types (n = 23) within TCGA. The size of each circle represents the geometric mean of miR-375 expression in each tumor type. Each tumor type is ranked on the y-axis by the log2 (fold change) of the geometric mean of tumor expression over non–tumor expression of miR-375. Geometric means were used instead of arithmetic means to provide robustness to outliers. Highlighted are FLC (red) as well as CHOL and LIHC (blue). (C) Ranked –log2 (P value) of miRhub Monte Carlo simulation. miRNAs were examined for target site enrichment in genes up-regulated in FLC. Dotted line represents P = .05. (D) KEGG enrichment analysis of up-regulated miR-375 target genes in FLC. **P < .01, ***P < .001 (Mann–Whitney U test, 2-sided). BLCA, bladder urothelial carcinoma; BRCA, breast invasive carcinoma; CESC, cervical squamous cell carcinoma and endocervical adenocarcinoma; CHOL, cholangiocarcinoma; COAD, colon adenocarcinoma; ESCA, esophageal carcinoma; HNSC, head and neck squamous cell carcinoma; KICH, kidney chromophobe; KIRC, kidney renal papillary cell carcinoma; KIRP, kidney renal clear cell carcinoma; LIHC, liver hepatocellular carcinoma; LUAD, lung adenocarcinoma; LUSC, lung squamous cell carcinoma; PAAD, pancreatic adenocarcinoma; PCPG, pheochromocytoma and paraganglioma; PRAD, prostate adenocarcinoma; READ, rectum adenocarcinoma; SKCM, skin cutaneous melanoma; STAD, stomach adenocarcinoma; THCA, thyroid carcinoma; THYM, thymoma; UCEC, uterine corpus endometrial carcinoma.
Figure 5
Figure 5
miR-375 regulates the Hippo signaling pathway. (A) Diagram of FLC cell line derivation. (B) Principal components analysis of RNA-seq data from miR-375 mimic and control-treated FLC cells. The 500 most variable genes were used in the analysis. (C) Volcano plot showing differentially expressed genes in miR-375 mimic relative to control-treated FLC cells. Dashed lines represent fold change of -2 or +2 (vertical) and adjusted P value = .05 (horizontal). (D) Cumulative density distribution of expression fold change (log2, miR-375 mimic compared with control) for miR-375 targets and 1000 randomly selected genes. (E) KEGG enrichment analysis of miR-375 targets that are down-regulated (average normalized count, ≥100 across all samples; adjusted P value < .05; log2 fold change, <-0.5; n = 428). (F and G) RNA expression of CTGF and YAP1 after treatment of miR-375 mimic or control by RNA-seq (n = 3 per condition in panel F) and reverse-transcription quantitative PCR (RT-qPCR) (n = 4 per condition in panel G). Gene expression was normalized to that of GAPDH. RT-qPCR data are representative of 3 independent experiments. Statistical significance was determined by the Wald test (DESeq2) and the Mann–Whitney U test (1-sided) for RNA-seq and RT-qPCR data, respectively. (H) Protein expression of CTGF and YAP1 after treatment of miR-375 mimic or control. Western blot densitometry is normalized to β-actin. Data are representative of 2 independent experiments. *P < .05, ***P < .001. ECM, extracellular matrix; PC, principal component; SCID, severe combined immunodeficiency.
Figure 6
Figure 6
miR-375 inhibits growth and migration of FLC. (A) Colony formation assays after treatment of control (n = 6) or miR-375 mimic (n = 6). Colony number (bottom left) and colony area (bottom right) were quantified. Data are presented from 2 independent experiments. (B) Scratch wound assays after treatment of control (n = 5) or miR-375 mimic (n = 7). Scale bar: 100 μm. Data are presented from 2 independent experiments. (C) RNA expression quantified by RNA-seq of the proliferation markers MKI67 and MCM2 after treatment of miR-375 mimic. Statistical significance was determined by the Wald test (DESeq2). (D) EdU incorporation assays after treatment of control (n = 3) or miR-375 mimic (n = 3). Data are representative of 2 independent experiments. *P < .05, **P < .01, ***P < .001 (Mann–Whitney U test, 1-sided, unless otherwise indicated), #P < .05 (Student 1-tailed t test, P ≥ .05 Mann–Whitney U test, 1-sided).

References

    1. Craig J.R., Peters R.L., Edmondson H.A., Omata M. Fibrolamellar carcinoma of the liver: a tumor of adolescents and young adults with distinctive clinico-pathologic features. Cancer. 1980;46:372–379. - PubMed
    1. Torbenson M. Fibrolamellar carcinoma: 2012 update. Scientifica. 2012;2012:1–15. - PMC - PubMed
    1. Stipa F., Yoon S.S., Liau K.H., Fong Y., Jarnagin W.R., D’Angelica M., Abou-Alfa G., Blumgart L.H., DeMatteo R.P. Outcome of patients with fibrolamellar hepatocellular carcinoma. Cancer. 2006;106:1331–1338. - PubMed
    1. Honeyman J.N., Simon E.P., Robine N., Chiaroni-Clarke R., Darcy D.G., Lim I.I.P., Gleason C.E., Murphy J.M., Rosenberg B.R., Teegan L., Takacs C.N., Botero S., Belote R., Germer S., Emde A.-K., Vacic V., Bhanot U., LaQuaglia M.P., Simon S.M. Detection of a recurrent DNAJB1-PRKACA chimeric transcript in fibrolamellar hepatocellular carcinoma. Science. 2014;343:1010–1014. - PMC - PubMed
    1. Cornella H., Alsinet C., Sayols S., Zhang Z., Hao K., Cabellos L., Hoshida Y., Villanueva A., Thung S., Ward S.C., Rodriguez-Carunchio L., Vila-Casadesús M., Imbeaud S., Lachenmayer A., Quaglia A., Nagorney D.M., Minguez B., Carrilho F., Roberts L.R., Waxman S., Mazzaferro V., Schwartz M., Esteller M., Heaton N.D., Zucman-Rossi J., Llovet J.M. Unique genomic profile of fibrolamellar hepatocellular carcinoma. Gastroenterology. 2014;148:806–818. - PMC - PubMed

Publication types

Substances

Supplementary concepts