. 2019 Mar 1:14:520-535.
doi: 10.1016/j.omtn.2019.01.008. Epub 2019 Jan 25.

Scavenger Receptor Class A1 Mediates Uptake of Morpholino Antisense Oligonucleotide into Dystrophic Skeletal Muscle

Affiliations

Scavenger Receptor Class A1 Mediates Uptake of Morpholino Antisense Oligonucleotide into Dystrophic Skeletal Muscle

Shouta Miyatake et al. Mol Ther Nucleic Acids. .

Abstract

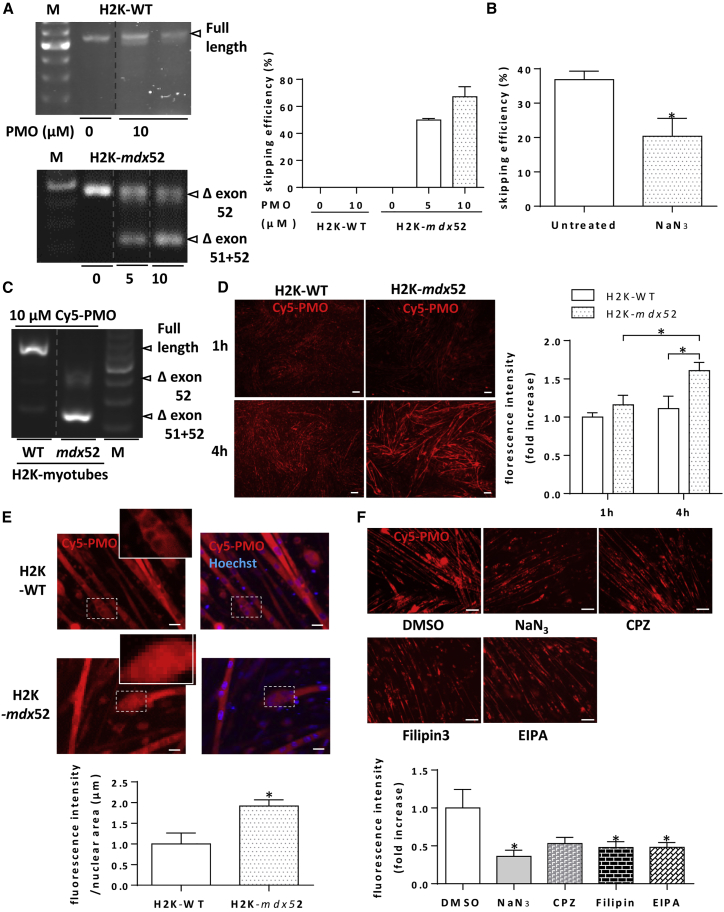
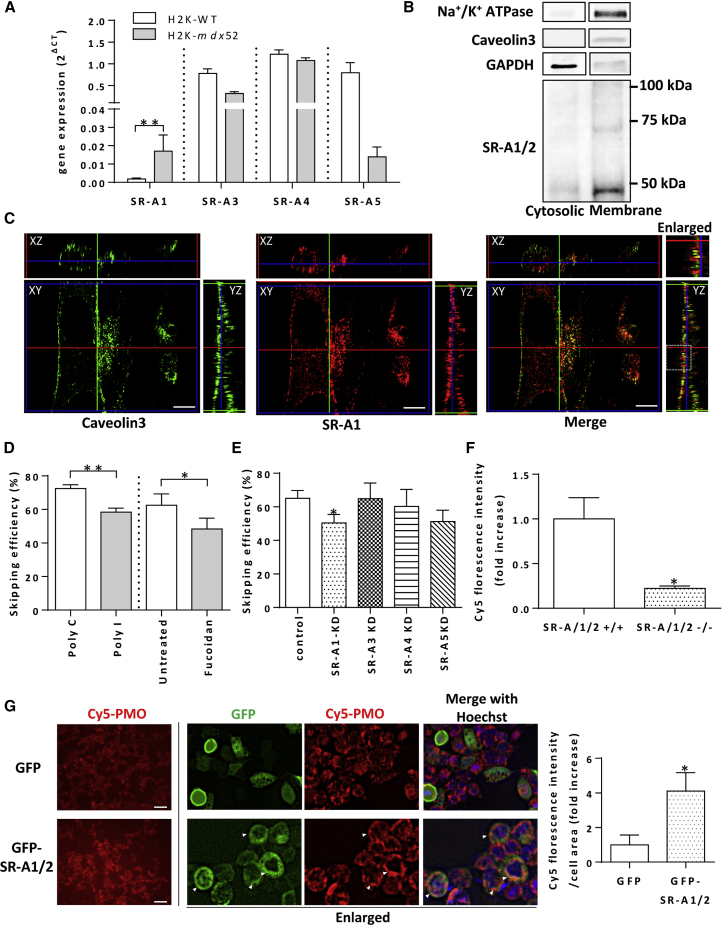
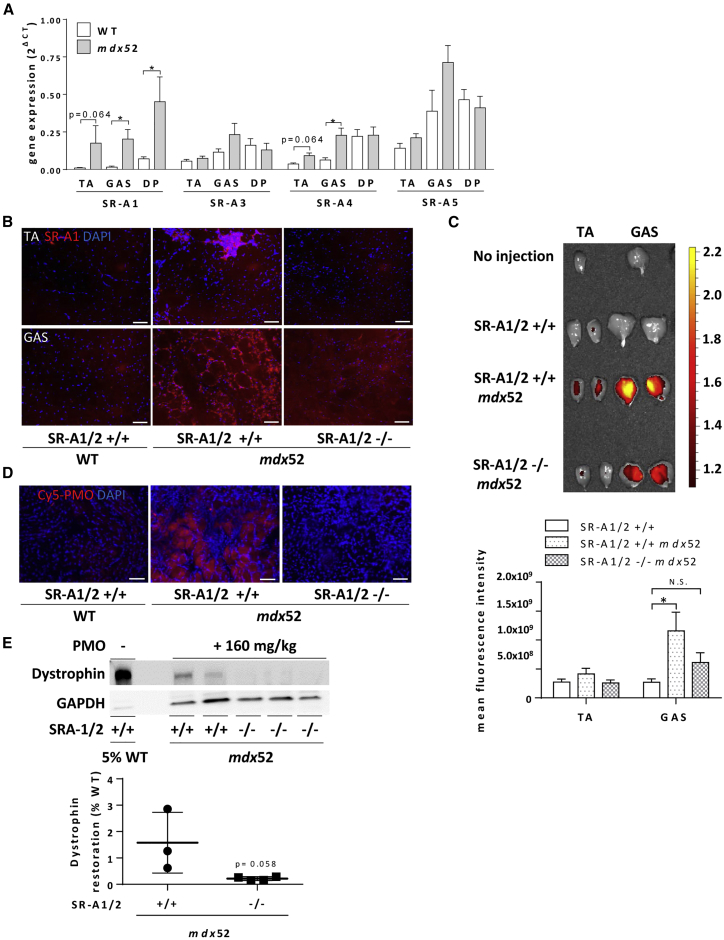
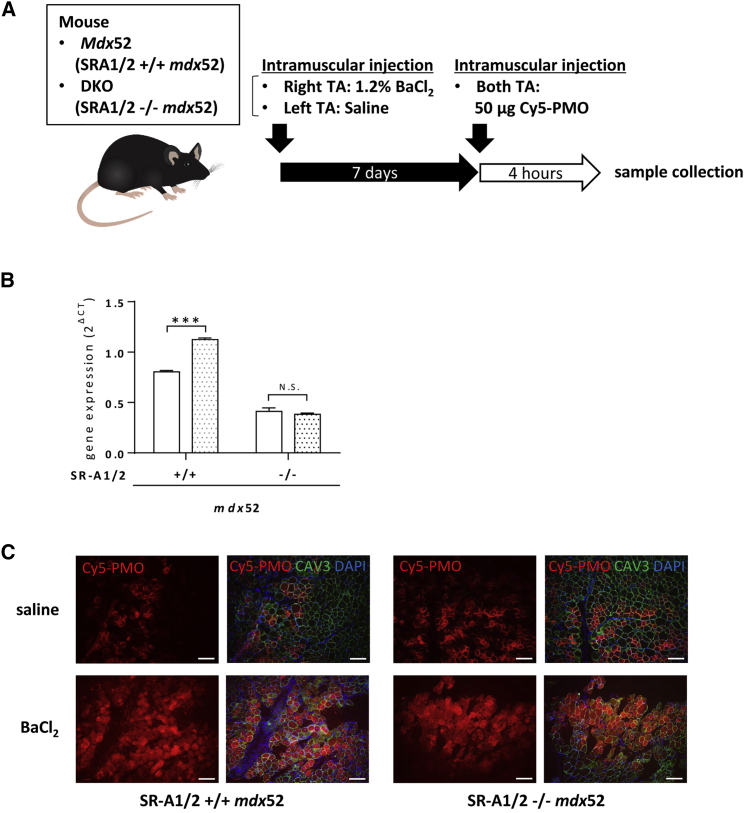
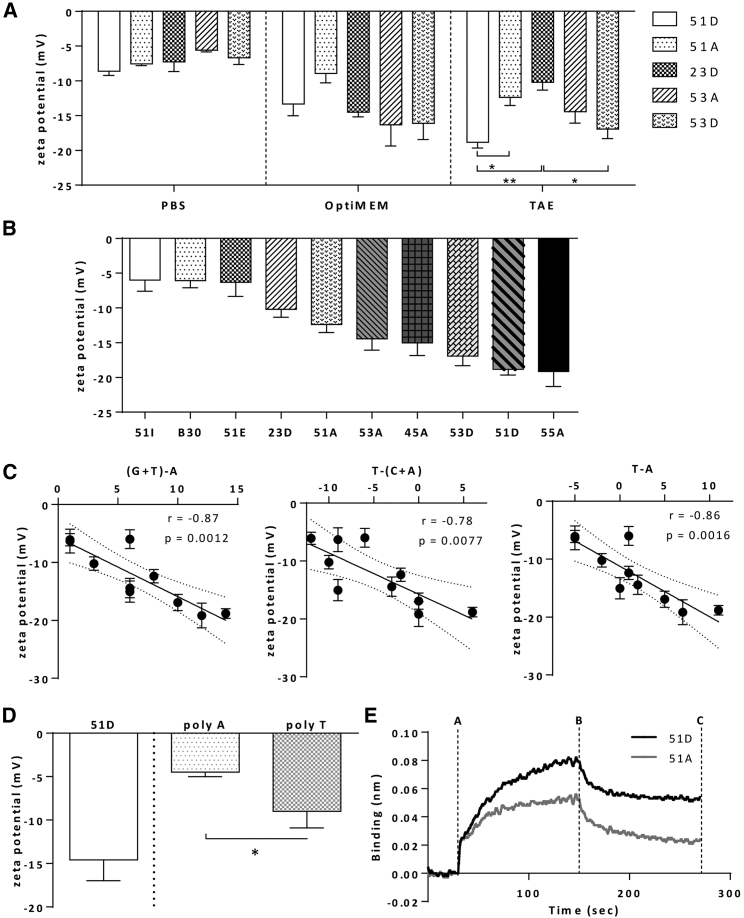
Exon skipping using phosphorodiamidate morpholino oligomers (PMOs) is a promising treatment strategy for Duchenne muscular dystrophy (DMD). The most significant limitation of these clinically used compounds is their lack of delivery systems that target muscles; thus, cell-penetrating peptides are being developed to enhance uptake into muscles. Recently, we reported that uptake of peptide-conjugated PMOs into myofibers was mediated by scavenger receptor class A (SR-A), which binds negatively charged ligands. However, the mechanism by which the naked PMOs are taken up into fibers is poorly understood. In this study, we found that PMO uptake and exon-skipping efficiency were promoted in dystrophin-deficient myotubes via endocytosis through a caveolin-dependent pathway. Interestingly, SR-A1 was upregulated and localized in juxtaposition with caveolin-3 in these myotubes and promoted PMO-induced exon skipping. SR-A1 was also upregulated in the skeletal muscle of mdx52 mice and mediated PMO uptake. In addition, PMOs with neutral backbones had negative zeta potentials owing to their nucleobase compositions and interacted with SR-A1. In conclusion, PMOs with negative zeta potential were taken up into dystrophin-deficient skeletal muscle by upregulated SR-A1. Therefore, the development of a drug delivery system targeting SR-A1 could lead to highly efficient exon-skipping therapies for DMD.

Keywords: Duchenne muscular dystrophy; delivery; endocytosis; exon skipping; mdx52; oligonucleotide uptake; phosphorodiamidate morpholino oligomer; scavenger receptor; splice switching; zeta potential.


Figures

Figure 1
Figure 1
PMO Uptake into H2K-mdx52 Myotubes Is Mediated by Endocytosis H2K-WT and mdx52 myoblasts were differentiated for 4 days and treated with 5 or 10 μM PMO for 48 h (A and B) or 5 or 10 μM Cy5-conjugated PMO for 1, 4 (D and E), or 48 h (C). (A) RT-PCR analysis of exon 51 skipping with cDNA from the myotubes. A representative image is shown. M, 100-bp ladder marker. The dotted line shows the division of the gel. Exon-skipping efficiency was calculated using the densitometric value of the Δexon 51 plus 52 band divided by that of all bands (Δexon 51 plus 52 and Δexon 52) (n = 3 independent experiments). (B) H2K myotubes were preincubated with 1 mM NaN3 for 1 h and then supplemented with 5 μM PMO for 48 h in the presence of NaN3. The exon-skipping efficiency was calculated from the results of RT-PCR (n = 4 independent experiments). The unpaired t test was used for statistical analysis. (C) Representative image of RT-PCR after a 48-h treatment of H2K myotubes with 10 μM Cy5-PMO. The dotted line shows the division of the gel. (D) A representative image of Cy5 fluorescence in myotubes after 5 μM Cy5-PMO treatment for 1 or 4 h. The fluorescence intensities were quantified at each time point. Two-way ANOVA was used for comparisons between multiple groups. Scale bars, 200 nm (n = 7 independent experiments). (E) Representative fluorescence images of myotubes after 5 μM Cy5-PMO treatment for 4 h, merged with nuclear staining by Hoechst (blue). Cy5 fluorescence intensity in the nuclear area (μm) was quantified using the BZ-H3CM software. The unpaired t test was used for statistical analysis. Scale bars, 20 nm (n = 4 independent experiments). (F) H2K-mdx52 myotubes were pre-incubated with 10 mM NaN3, 30 μM CPZ, 4 μg/mL filipin III, and 10 μM EIPA for 30 min and then supplemented with 5 μM Cy5-PMO for 4 h in the presence of each inhibitor. Representative fluorescence images of the myotubes are shown. The fluorescence intensities were quantified for each condition (n = 6 independent experiments). One-way ANOVA was used for comparisons between multiple groups. Results are presented as mean ± SE. *p < 0.05. N.S., not significant.
Figure 2
Figure 2
Role of SR-A1 in PMO Uptake into H2K-mdx52 Myotubes (A) Gene expression of SR class A isoforms by qPCR using cDNA from H2K-WT and H2K-mdx52 myotubes 6 days after differentiation. The value of 2ΔCT is shown. Abt1 was used as a housekeeping gene. The Mann-Whitney U test was used for statistical analysis (n ≥ 3 independent experiments). (B) Western blotting of SR-A1 in the lysates of H2K-mdx52 myotubes on day 6 separated into cytosolic and membrane fractions. GAPDH was used as the control for the cytosolic fraction, and Na+/K+ ATPase and caveolin-3 were used as controls for the membrane fraction. Blots of each protein were derived from the same membrane. (C) Representative orthogonal sectioning of confocal images of caveolin-3 and SR-A1 in H2K-mdx52 myotubes on day 4 by the HyVolution method. Images of the xy, xz, and yz sections are shown. Scale bars, 10 μm. (D) H2K-mdx52 myotubes were pre-treated with SR inhibitors for 1 h and then supplemented with 5 μM PMO for 48 h in the presence of inhibitors. Ten micrograms per microliter poly I was used as an SR class A, C, E, and F inhibitor. Ten micrograms per microliter poly C was used as a control for poly I. Ten micrograms per microliter fucoidan was used as an SR class A1/2 and C1 inhibitor. The paired t test was used for statistical analysis (n ≥ 3 independent experiments). (E) H2K-mdx52 myoblasts were supplemented with 5 nM siRNA for each SR-isoform for 24 h, differentiated for 4 days, and supplemented with 5 μM PMO for 48 h, followed by total RNA collection for RT-PCR detection of exon 51 skipping. The Mann-Whitney U test was used for comparisons between the control and each siRNA-treated group (n ≥ 3 independent experiments). (F) Primary satellite cell-derived myoblasts from mdx52 and DKO mice were supplemented with 5 μM Cy5-PMO for 4 h, and the fluorescence intensities were quantified. The unpaired t test was used for statistical analysis (n = 3 independent experiments). (G) GFP- or GFP-SR-A1/2-transfected HEK293T cells were supplemented with 5 μM Cy5-PMO for 4 h. Representative fluorescence images of the cells are shown. The fluorescence intensity of Cy5 divided by cell area was quantified in each condition. White arrowheads show co-localization of Cy5-PMO and GFP-SR-A1/2. The unpaired t test was used for statistical analysis (n = 4 independent experiments). Results are presented as mean ± SE. *p < 0.05; **p < 0.01.
Figure 3
Figure 3
Upregulated SR-A1 in Dystrophin-Deficient Mice Promotes PMO Uptake (A) Gene expression of SR class A isoforms in TA, GAS, and diaphragm (DP) muscles of 7- to 9-week-old WT and mdx52 mice as measured by qPCR. The Mann-Whitney U test was used for statistical analysis (n ≥ 3 independent experiments). (B) Immunohistochemistry of SR-A1 in TA and GAS muscles of 8- to 9-week-old WT, mdx52, and DKO mice. Scale bars, 200 μm. (C and D) Four-week-old WT, Mdx52, and DKO mice were intravenously injected with 75 mg/kg body weight of Cy5-PMO; 24 h later, TA, GAS, and diaphragm muscles were isolated. (C) Cy5 fluorescence in TA and GAS muscles was observed using the IVIS imaging system. Representative images are shown. Mean fluorescence intensity was quantified. One-way ANOVA was used for comparisons between multiple groups (n ≥ 6 independent experiments). (D) Cy5 fluorescence was observed in the sections of diaphragm muscles. Representative images of Cy5 fluorescence with DAPI are shown. Scale bars, 80 nm. (E) Four- to five-week-old mdx52 and DKO mice were intravenously injected with 160 mg/kg body weight of PMO; 2 weeks later, muscles were isolated, and their lysates were used for western blotting to detect dystrophin restoration. A representative image of western blotting of diaphragm lysates is shown. Thirty micrograms of total protein was loaded relative to 5% (1.5 μg of protein) WT control and normalized to the GAPDH loading control. The graph shows the quantified data (n ≥ 3 independent experiments). Results are presented as mean ± SE. *p < 0.05; **p < 0.01. N.S., not significant.
Figure 4
Figure 4
Upregulated SR-A1 during Muscle Regeneration Increases PMO Localization in the Nucleus (A) Experimental model of intramuscular injection of Cy5-PMO after the induction of muscle regeneration with BaCl2. Mdx52 and DKO mice were intramuscularly injected with 1.2% BaCl2 in saline or only saline in the TA muscle of each leg. After 1 week, 50 μg of Cy5-PMO in saline was intramuscularly injected into both legs, and the muscles were collected 4 h later. (B) Gene expression of SR-A1 in TA muscles as measured by qPCR. Two-way ANOVA was used for comparisons between multiple groups (n ≥ 3 independent experiments). (C) Frozen sections were prepared for detection of Cy5-PMO under a fluorescence microscope. Representative images of Cy5 fluorescence merged with that of caveolin-3 and nuclear staining are shown. Scale bars, 80 μm.
Figure 5
Figure 5
PMOs with Negative Zeta Potential Bind to SR-A1 (A) The zeta potentials of 50 μM PMOs, the sequences of which are shown in Table 1, were measured in PBS, OptiMEM, and TAE at pH 7.4. One-way ANOVA was used for comparisons between multiple groups in each solvent (n ≥ 3 independent experiments). (B) Zeta potentials of all 10 PMOs in Table 1 measured in TAE at pH 7.4. The conductivity of each buffer is shown in Figure S9, and the sequence of each PMO is shown in Table 1. (C) The correlation between the zeta potential of PMOs in TAE buffer and the number of adenines subtracted from guanines plus thymines [(G + T) − A], cytosines plus adenines subtracted from thymines [T − (C+A)], and adenines subtracted from thymines (T − A). Pearson correlation coefficients and p values are indicated. (D) The zeta potentials of 50 μM PMOs, 51D, and poly A or poly T were measured in TAE at pH 7.4. The unpaired t test was used for statistical analysis (n ≥ 4 independent experiments). (E) PMOs (51D and 51A) were tested in a binding affinity assay with an N-terminal polyhistidine (His)-tagged recombinant SR-A1 by bio-layer interferometry. The anti-His tag biosensor was bound to SR-A1 and incubated with 1 μM of each PMO. During PMO incubation, the instrument recorded the kinetics of binding of PMO. The area between lines A and B corresponds to the association phase, and the area between lines B and C corresponds to the dissociation phase. Results are presented as means ± SE. *p < 0.05; **p < 0.01; ***p < 0.001.

Similar articles

Cited by

References

    1. Shimizu-Motohashi Y., Miyatake S., Komaki H., Takeda S., Aoki Y. Recent advances in innovative therapeutic approaches for Duchenne muscular dystrophy: from discovery to clinical trials. Am. J. Transl. Res. 2016;8:2471–2489. - PMC - PubMed
    1. Aoki Y., Yokota T., Nagata T., Nakamura A., Tanihata J., Saito T., Duguez S.M., Nagaraju K., Hoffman E.P., Partridge T., Takeda S. Bodywide skipping of exons 45-55 in dystrophic mdx52 mice by systemic antisense delivery. Proc. Natl. Acad. Sci. USA. 2012;109:13763–13768. - PMC - PubMed
    1. Kole R., Krainer A.R., Altman S. RNA therapeutics: beyond RNA interference and antisense oligonucleotides. Nat. Rev. Drug Discov. 2012;11:125–140. - PMC - PubMed
    1. Arora V., Devi G.R., Iversen P.L. Neutrally charged phosphorodiamidate morpholino antisense oligomers: uptake, efficacy and pharmacokinetics. Curr. Pharm. Biotechnol. 2004;5:431–439. - PubMed
    1. Lu Q.L., Rabinowitz A., Chen Y.C., Yokota T., Yin H., Alter J., Jadoon A., Bou-Gharios G., Partridge T. Systemic delivery of antisense oligoribonucleotide restores dystrophin expression in body-wide skeletal muscles. Proc. Natl. Acad. Sci. USA. 2005;102:198–203. - PMC - PubMed