. 2019:22:101708.
doi: 10.1016/j.nicl.2019.101708. Epub 2019 Feb 3.

The organization of the basal ganglia functional connectivity network is non-linear in Parkinson's disease

Affiliations

The organization of the basal ganglia functional connectivity network is non-linear in Parkinson's disease

Clara Rodriguez-Sabate et al. Neuroimage Clin. 2019.

Abstract

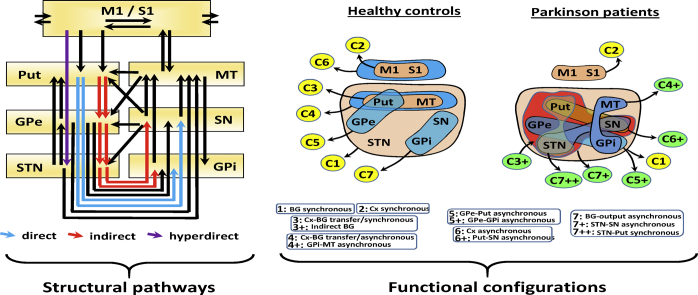
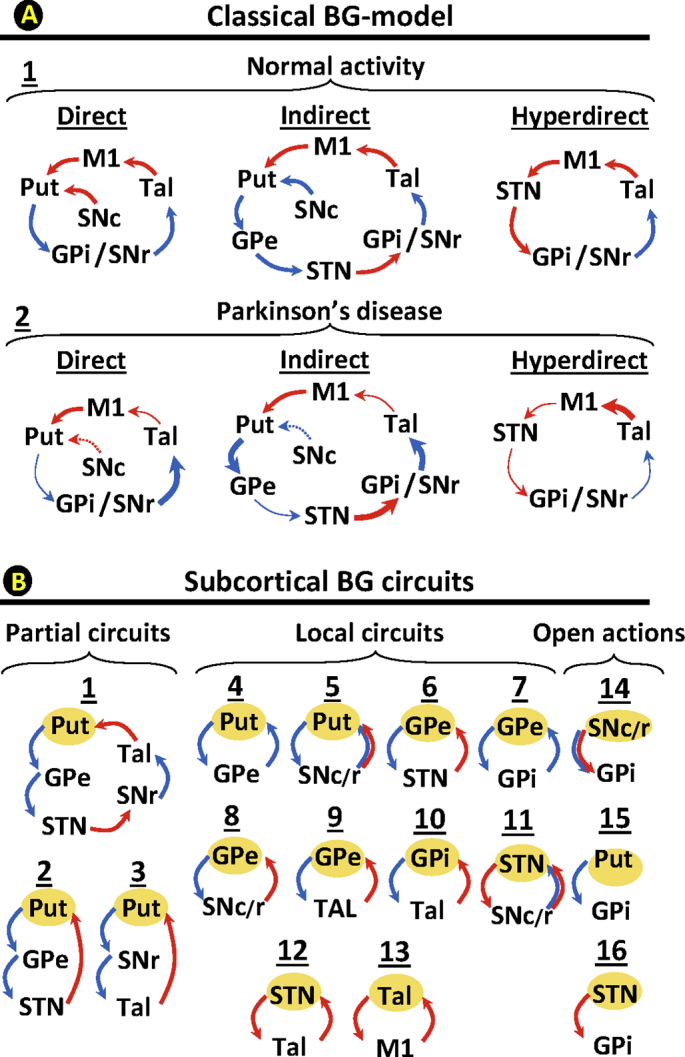
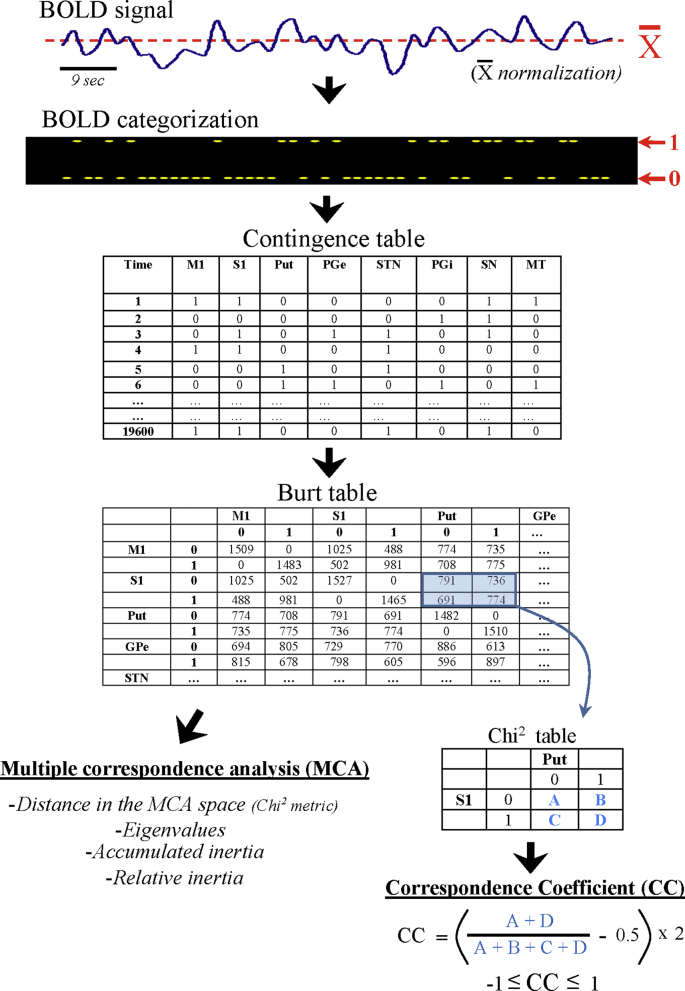
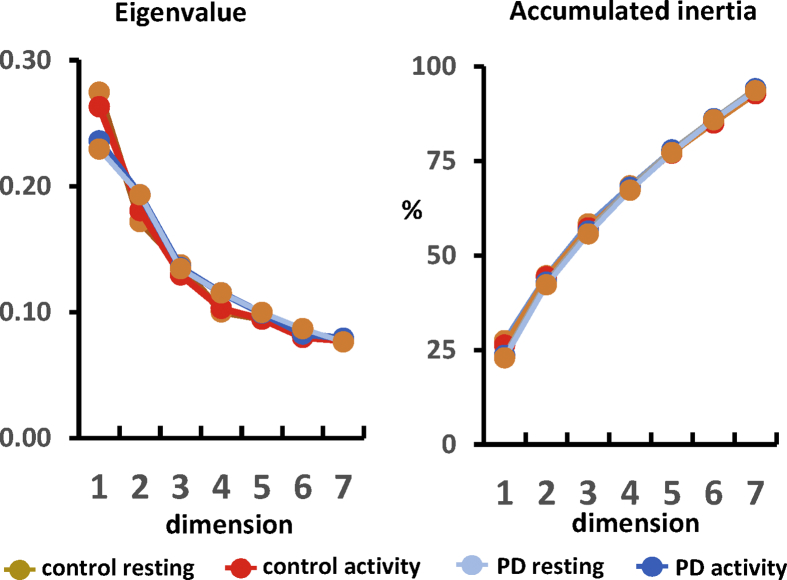
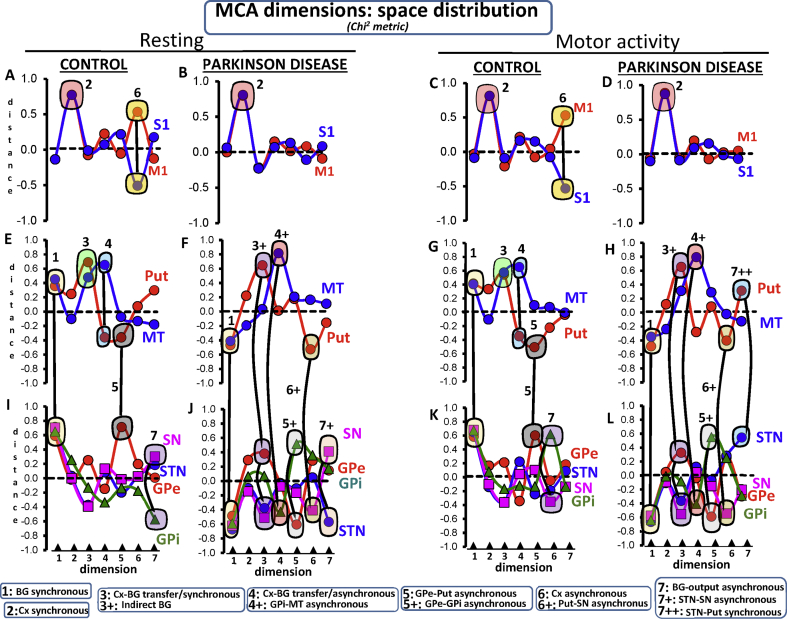
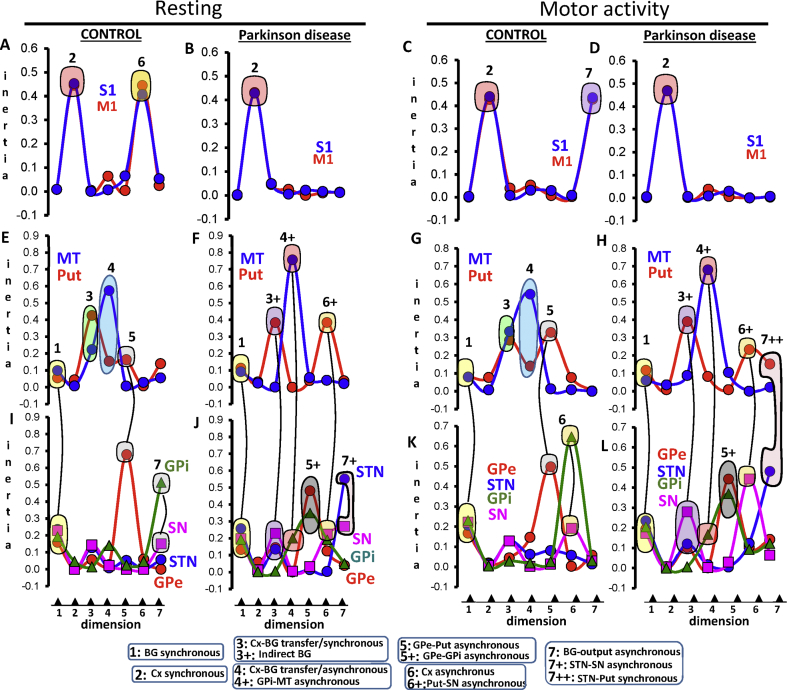
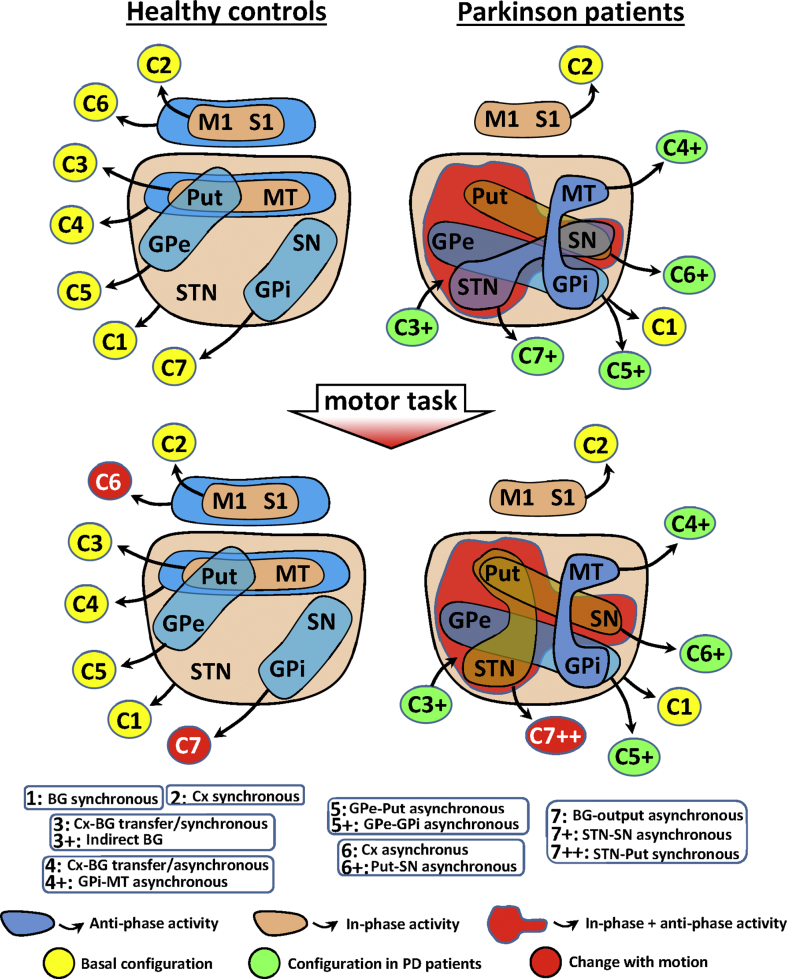
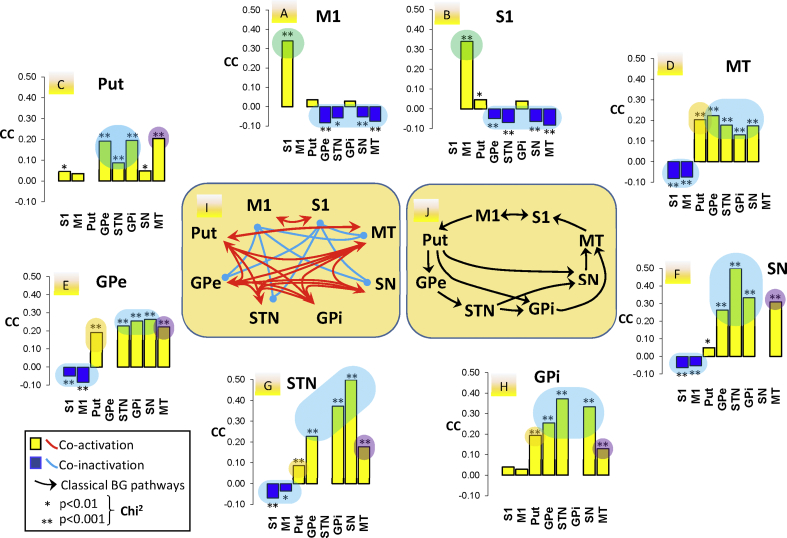
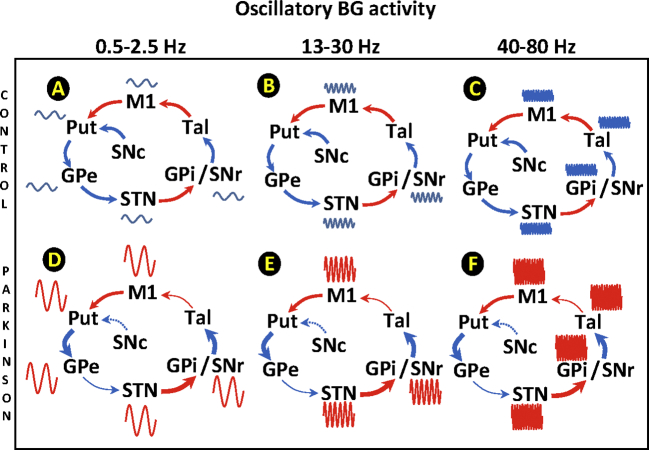
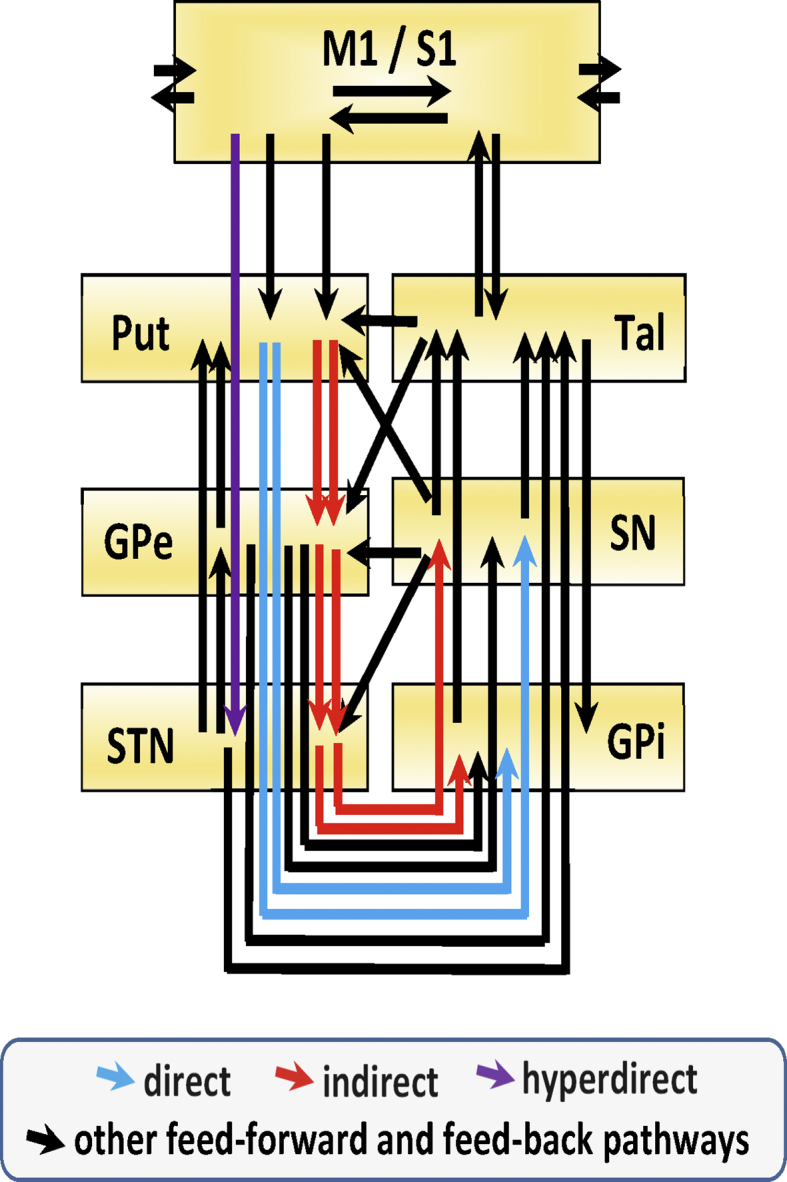
The motor symptoms in Parkinson's disease (PD) have been linked to changes in the excitatory/inhibitory interactions of centers involved in the cortical-subcortical closed-loop circuits which connect basal ganglia (BG) and the brain cortex. This approach may explain some motor symptoms of PD but not others, which has driven the study of BG from new perspectives. Besides their cortical-subcortical linear circuits, BG have a number of subcortical circuits which directly or indirectly connect each BG with all the others. This suggests that BG may work as a complex network whose output is the result of massive functional interactions between all of their nuclei (decentralized network; DCN), more than the result of the linear excitatory/inhibitory interactions of the cortical-subcortical closed-loops. The aim of this work was to study BG as a DCN, and to test whether the DCN behavior of BG changes in PD. BG activity was recorded with MRI methods and their complex interactions were studied with a procedure based on multiple correspondence analysis, a data-driven multifactorial method which can work with non-linear multiple interactions. The functional connectivity of twenty parkinsonian patients and eighteen age-matched controls were studied during resting and when they were performing sequential hand movements. Seven functional configurations were identified in the control subjects during resting, and some of these interactions changed with motor activity. Five of the seven interactions found in control subjects changed in Parkinson's disease. The BG response to the motor task was also different in PD patients and controls. These data show the basal ganglia as a decentralized network where each region can perform multiple functions and each function is performed by multiple regions. This framework of BG interactions may provide new explanations concerning motor symptoms of PD which are not explained by current BG models.

Keywords: Basal ganglia; Functional connectivity; Motor disorders; Multiple correspondence analysis; Parkinson's disease.


Figures

Unlabelled Image
Graphical abstract
Fig. 1
Fig. 1
BG closed-loop circuits according to the classical BG-model (top) and possible subcortical BG-circuits. Top diagrams (A) show the direct pathway, the indirect pathway, and the hyperdirect pathway in healthy subjects (1) and PD-patients (2). The bottom diagrams (B) indicate possible partial (1–3), local (4–13) and open (14–16) subcortical circuits according to animal studies. Red arrows indicate excitatory pathways and blue arrows inhibitory pathways. Thick arrows indicate an increased basal activity, thin arrows a decreased basal activity, and dotted arrows degenerated pathways.M1: primary motor cortex, STN: subthalamic nucleus, Put: post-commissural putamen, GPe: external globus pallidum, GPi: internal globus pallidum, SN substantia nigra, and MT: motor thalamus, D: direct pathway, I: indirect pathway, HD: hyperdirect pathway.
Fig. 2
Fig. 2
Multiple Correspondence Analysis (MCA) and Correspondence Coefficient (CC) methods. BOLD-signals of averaged ROIs were normalized (around their mean value) and categorized (binarized by replacing data higher than the mean value with the number 1 and those lower or equal to the mean value with the number 0). Binarized data were used to compute the Contingence Table, which at each recording-time shows the high/ low status of each of the BG (BG-activity profile). The Burt table shows the frequency of low-low (0–0), high-high (1–1), high-low (1–0) and low-high (0–1) coincidences between every two BG. Working with the Correspondence and the Burt tables, MCA identifies the most frequent BG-coincidences of activity (BG-activity profiles) and segregates and sorts them into a seven dimensional space. The characteristics and reliability of each region in each configuration was computed with the different procedures indicated at the bottom-left. The bottom-right indicates the procedure used to compute the CC.
Fig. 3
Fig. 3
The Eigenvalue and Accumulated Inertia of the seven MCA-dimensions of the Control and Parkinson's patients during resting and motor activity.
Fig. 4
Fig. 4
The space-distribution of each BG in the seven MCA-dimensions during resting (left-side) and motor activity (right-side). The significant BG and cortical areas of the functional configuration of each dimension are surrounded by colored circles (linked by lines). Each BG-configuration is identified with a number which refers to the name of the configuration at the bottom of the Fig. M1: primary motor cortex, STN: subthalamic nucleus, Put: post-commissural putamen, GPe: external globus pallidum, GPi: internal globus pallidum, SN substantia nigra, and MT: motor thalamus.
Fig. 5
Fig. 5
Relative inertia of each BG in the seven MCA-dimensions during resting (left-side) and motor activity (right-side). The significant BG and cortical areas of the functional configuration of each dimension are surrounded by colored areas. Each BG-configuration is identified with a number which refers to the name of the configuration at the bottom of the fig. M1: primary motor cortex, STN: subthalamic nucleus, Put: post-commissural putamen, GPe: external globus pallidum, GPi: internal globus pallidum, SN substantia nigra, and MT: motor thalamus.
Fig. 6
Fig. 6
Functional configurations identified by the MCA in healthy controls (left side) and PD patients (right side) during the resting task (top) and the motor task (bottom). In-phase configurations are shown by brown areas, anti-phase configurations by blue areas, and the combined in-phase/anti-phase configuration by a red area. Each configuration is shown by a number in a yellow circle (normal-resting configurations), a red circle (configurations which changed with motion) or a green circle (configurations which changed in Parkinson's disease). The name of the configuration corresponding to each number is shown at the bottom of the fig. M1: primary motor cortex, STN: subthalamic nucleus, Put: post-commissural putamen, GPe: external globus pallidum, GPi: internal globus pallidum, SN substantia nigra, and MT: motor thalamus.
Fig. 7
Fig. 7
Correspondence Coefficient (CC) of the control group during the resting task. Peripheral graphics show the CC of the region at the top of each image with all the other regions (at the bottom of each image). The diagram in the middle shows a summary of the statistically significant CC for the different regions, red arrows connecting regions with a significant positive CC and blue arrows connecting regions with a significant negative CC. Non-significant CC are not shown. M1: primary motor cortex, STN: subthalamic nucleus, Put: post-commissural putamen, GPe: external globus pallidum, GPi: internal globus pallidum, SN substantia nigra, and MT: motor thalamus.
Supplementary Fig. 1
Oscillatory activity of basal ganglia in healthy subjects (A, B and C) and Parkinson’s disease (D, E and F). Three periodic fluctuations have been reported, the 0.5-2.5 Hz (left column; A and D), the 13-30 Hz (middle column; B and E) and the 40-80 Hz (right column; C and F). The amplitude (potency) of the three fluctuations increased in Parkinson’s disease in most of the centers. Red arrows indicate excitatory pathways and blue arrows inhibitory pathways. Thick arrows indicate an increased basal activity, thin arrows a decreased basal activity, and dotted arrows degenerated pathways. M1: primary motor cortex, STN: subthalamic nucleus, Put: post-commissural putamen, GPe: external globus pallidum, GPi: internal globus pallidum, SNc substantia nigra compacta, SNr substantia nigra reticulata, and Tal: motor thalamus.
supplementary Fig. 2
Massive structural connections between basal ganglia (BG) and the primary M1/S1 cortex. Feed-forward and feed-back connections between BG and M1/S1 are shown. Blue arrows indicate the direct pathway, red arrows the indirect pathway, purple arrows the hyperdirect pathway, and back arrows indicate other feed-forward and feed-back pathways. M1: primary motor cortex, STN: subthalamic nucleus, Put: putamen, GPe: external globus pallidum, GPi: internal globus pallidum, SNn:  substantia nigra compacta, SN:  substantia nigra, Tal: motor thalamus.

Similar articles

Cited by

References

    1. Abel J.H., Meeker K., Granados-Fuentes D., St John P.C., Wang T.J., Bales B.B., Doyle F.J., 3rd, Herzog E.D., Petzold L.R. Functional network inference of the suprachiasmatic nucleus. Proc. Natl. Acad. Sci. U. S. A. 2016;113:4512–4517. - PMC - PubMed
    1. Albin R.L., Young A.B., Penney J.B. The functional anatomy of basal ganglia disorders. Trends Neurosci. 1989;12:366–375. - PubMed
    1. Alexander G.E., DeLong M.R., Strick P.L. Parallel organization of functionally segregated circuits linking basal ganglia and cortex. Annu. Rev. Neurosci. 1986;9:357–381. - PubMed
    1. Alonso-Frech F., Zamarbide I., Alegre M., Rodriguez-Oroz M.C., Guridi J., Manrique M., Valencia M., Artieda J., Obeso J.A. Slow oscillatory activity and levodopa-induced dyskinesias in Parkinson's disease. Brain. 2006;129:1748–1757. - PubMed
    1. Arthurs O.J., Boniface S. How well do we understand the neural origins of the fMRI BOLD signal? Trends Neurosci. 2002;25:27–31. - PubMed

Publication types