

Activation of CD8⁺ T Cell Responses after Melanoma Antigen Targeting to CD169⁺ Antigen Presenting Cells in Mice and Humans
- PMID: 30764534
- PMCID: PMC6406251
- DOI: 10.3390/cancers11020183
Activation of CD8⁺ T Cell Responses after Melanoma Antigen Targeting to CD169⁺ Antigen Presenting Cells in Mice and Humans
Abstract
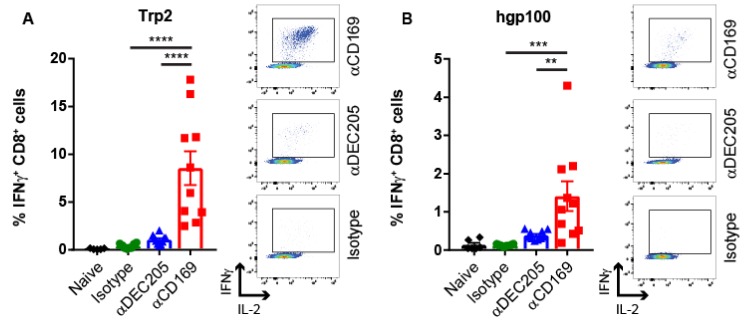
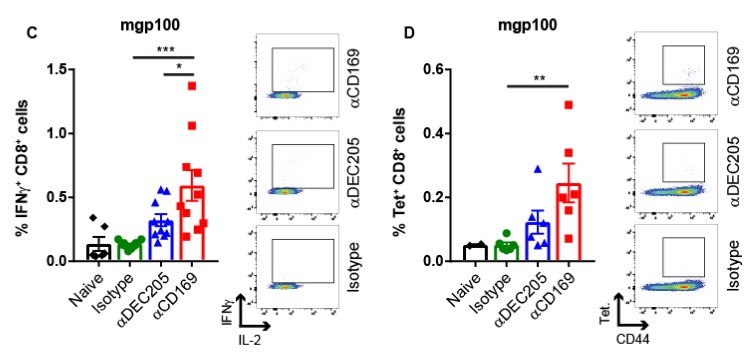
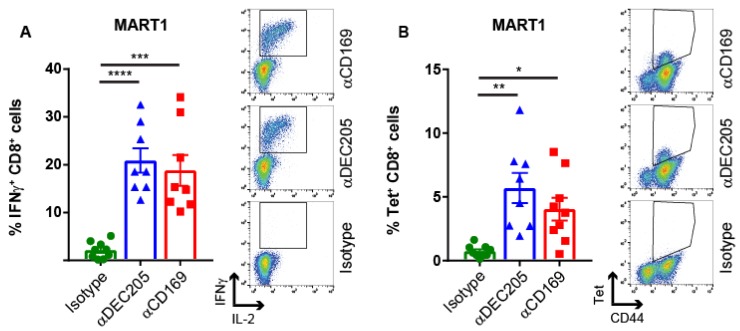
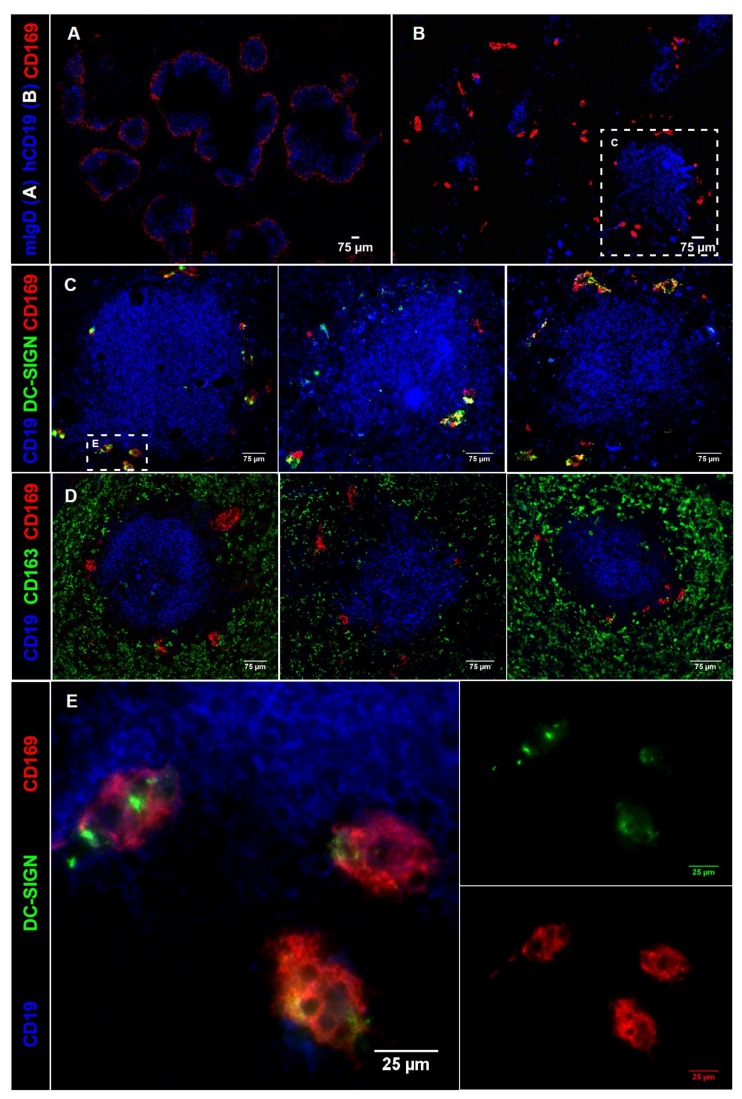
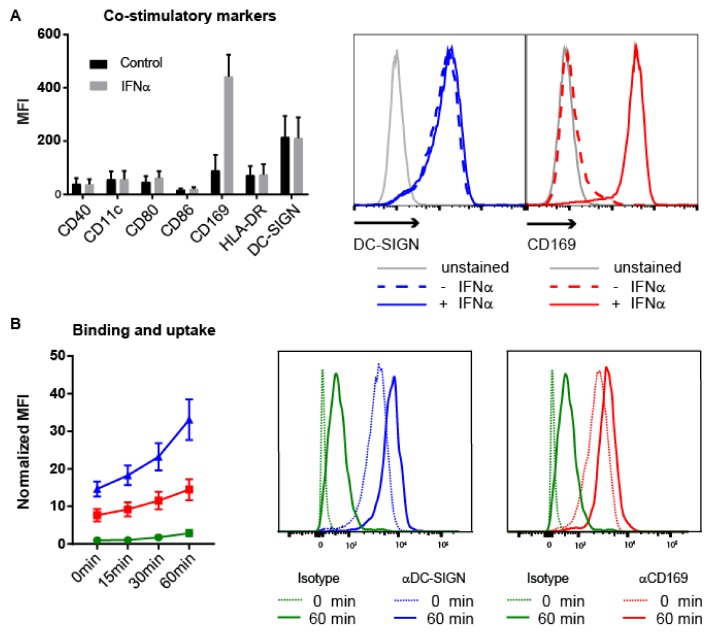
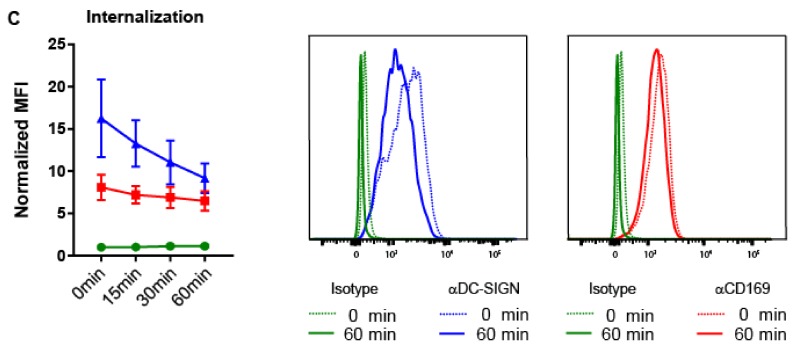
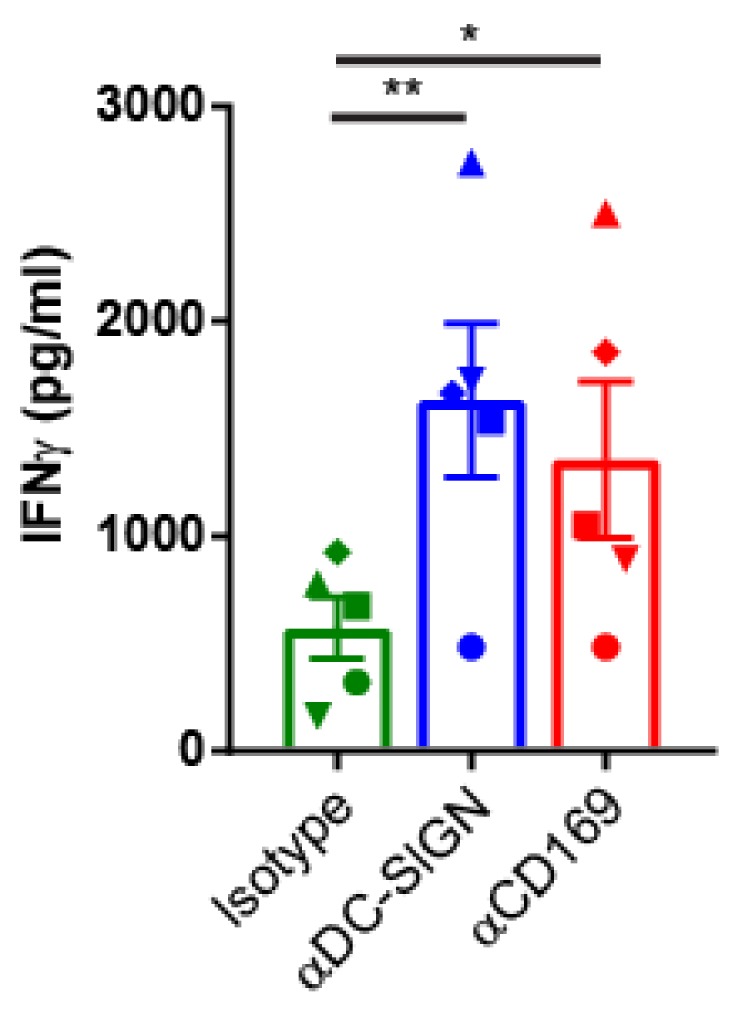
The lack of tumor-reactive T cells is one reason why immune checkpoint inhibitor therapies still fail in a significant proportion of melanoma patients. A vaccination that induces melanoma-specific T cells could potentially enhance the efficacy of immune checkpoint inhibitors. Here, we describe a vaccination strategy in which melanoma antigens are targeted to mouse and human CD169 and thereby induce strong melanoma antigen-specific T cell responses. CD169 is a sialic acid receptor expressed on a subset of mouse splenic macrophages that captures antigen from the blood and transfers it to dendritic cells (DCs). In human and mouse spleen, we detected CD169⁺ cells at an equivalent location using immunofluorescence microscopy. Immunization with melanoma antigens conjugated to antibodies (Abs) specific for mouse CD169 efficiently induced gp100 and Trp2-specific T cell responses in mice. In HLA-A2.1 transgenic mice targeting of the human MART-1 peptide to CD169 induced strong MART-1-specific HLA-A2.1-restricted T cell responses. Human gp100 peptide conjugated to Abs specific for human CD169 bound to CD169-expressing monocyte-derived DCs (MoDCs) and resulted in activation of gp100-specific T cells. Together, these data indicate that Ab-mediated antigen targeting to CD169 is a potential strategy for the induction of melanoma-specific T cell responses in mice and in humans.
Keywords: CD169; Siglec-1; T cell responses; cancer vaccines; dendritic cell; macrophage; melanoma; sialoadhesin.
Conflict of interest statement
The authors declare no conflict of interest.
Figures
Similar articles
-
Comparison of Protein and Peptide Targeting for the Development of a CD169-Based Vaccination Strategy Against Melanoma.Front Immunol. 2018 Sep 6;9:1997. doi: 10.3389/fimmu.2018.01997. eCollection 2018. Front Immunol. 2018. PMID: 30237798 Free PMC article.
-
Selective tumor antigen vaccine delivery to human CD169+ antigen-presenting cells using ganglioside-liposomes.Proc Natl Acad Sci U S A. 2020 Nov 3;117(44):27528-27539. doi: 10.1073/pnas.2006186117. Epub 2020 Oct 16. Proc Natl Acad Sci U S A. 2020. PMID: 33067394 Free PMC article.
-
Optimization of Liposomes for Antigen Targeting to Splenic CD169+ Macrophages.Pharmaceutics. 2020 Nov 25;12(12):1138. doi: 10.3390/pharmaceutics12121138. Pharmaceutics. 2020. PMID: 33255564 Free PMC article.
-
CD169+ Macrophages Capture and Dendritic Cells Instruct: The Interplay of the Gatekeeper and the General of the Immune System.Front Immunol. 2018 Oct 26;9:2472. doi: 10.3389/fimmu.2018.02472. eCollection 2018. Front Immunol. 2018. PMID: 30416504 Free PMC article. Review.
-
Exploring CD169+ Macrophages as Key Targets for Vaccination and Therapeutic Interventions.Vaccines (Basel). 2025 Mar 20;13(3):330. doi: 10.3390/vaccines13030330. Vaccines (Basel). 2025. PMID: 40266235 Free PMC article. Review.
Cited by
-
Recent advances in antigen targeting to antigen-presenting cells in veterinary medicine.Front Immunol. 2023 Mar 10;14:1080238. doi: 10.3389/fimmu.2023.1080238. eCollection 2023. Front Immunol. 2023. PMID: 36969203 Free PMC article. Review.
-
A co-culture model to study modulators of tumor immune evasion through scalable arrayed CRISPR-interference screens.Front Immunol. 2024 Oct 21;15:1444886. doi: 10.3389/fimmu.2024.1444886. eCollection 2024. Front Immunol. 2024. PMID: 39497819 Free PMC article.
-
Peptide Vaccines in Melanoma: Chemical Approaches towards Improved Immunotherapeutic Efficacy.Pharmaceutics. 2023 Jan 30;15(2):452. doi: 10.3390/pharmaceutics15020452. Pharmaceutics. 2023. PMID: 36839774 Free PMC article. Review.
-
Controlling Antigen Fate in Therapeutic Cancer Vaccines by Targeting Dendritic Cell Receptors.Mol Pharm. 2023 Oct 2;20(10):4826-4847. doi: 10.1021/acs.molpharmaceut.3c00330. Epub 2023 Sep 18. Mol Pharm. 2023. PMID: 37721387 Free PMC article. Review.
-
CD169 Defines Activated CD14+ Monocytes With Enhanced CD8+ T Cell Activation Capacity.Front Immunol. 2021 Jul 28;12:697840. doi: 10.3389/fimmu.2021.697840. eCollection 2021. Front Immunol. 2021. PMID: 34394090 Free PMC article.
References
-
- Dobry A.S., Zogg C.K., Hodi F.S., Smith T.R., Ott P.A., Iorgulescu J.B. Management of metastatic melanoma: Improved survival in a national cohort following the approvals of checkpoint blockade immunotherapies and targeted therapies. Cancer Immunol. Immunother. 2018;67:1833–1844. doi: 10.1007/s00262-018-2241-x. - DOI - PMC - PubMed
-
- Iorgulescu J.B., Harary M., Zogg C.K., Ligon K.L., Reardon D.A., Hodi F.S., Aizer A.A., Smith T.R. Improved risk-adjusted survival for melanoma brain metastases in the era of checkpoint blockade immunotherapies: Results from a national cohort. Cancer Immunol. Res. 2018;6:1039–1045. doi: 10.1158/2326-6066.CIR-18-0067. - DOI - PMC - PubMed
Grants and funding
LinkOut - more resources
Full Text Sources
Other Literature Sources
Molecular Biology Databases
Research Materials
