. 2019 Feb 5;20(3):689.
doi: 10.3390/ijms20030689.

Accessibility of Cations to the Selectivity Filter of KcsA in the Inactivated State: An Equilibrium Binding Study

Affiliations

Accessibility of Cations to the Selectivity Filter of KcsA in the Inactivated State: An Equilibrium Binding Study

Ana Marcela Giudici et al. Int J Mol Sci. .

Abstract

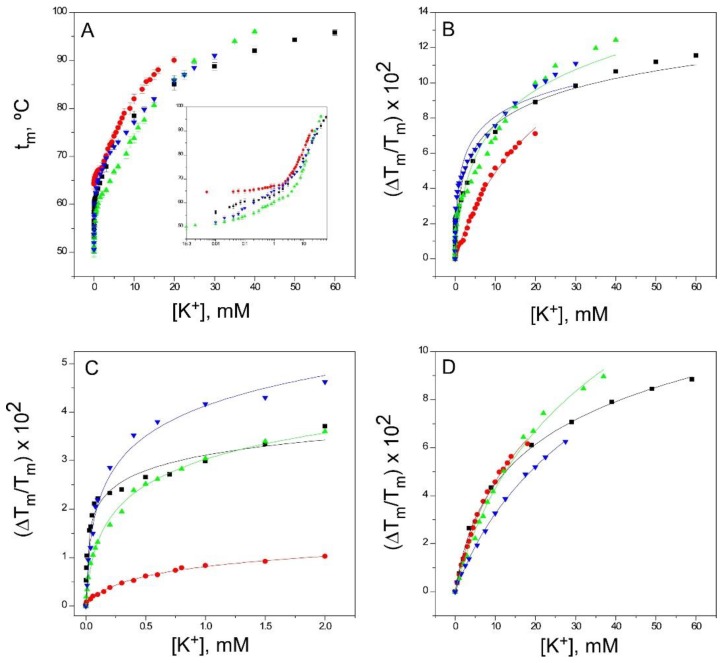
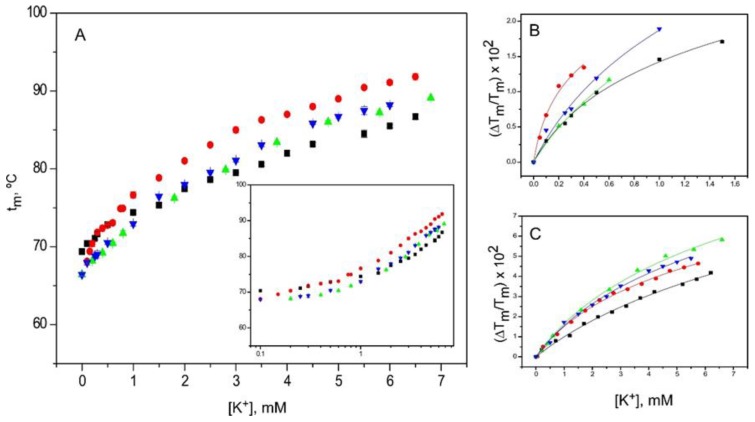
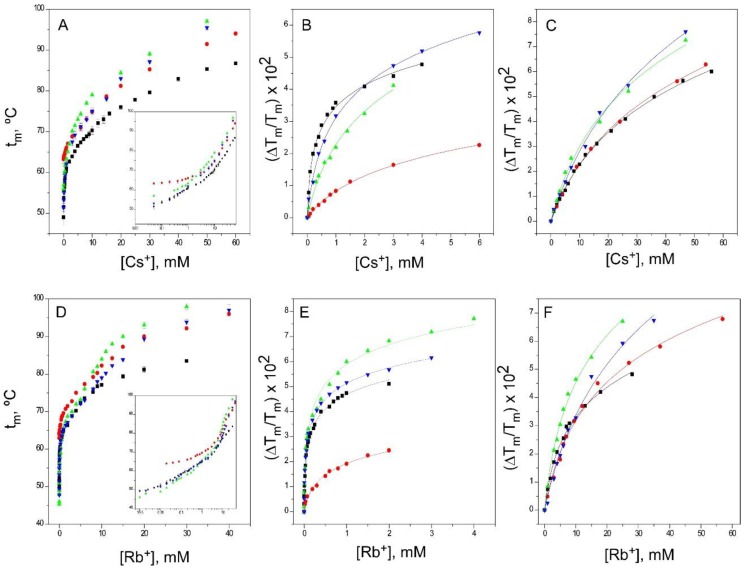
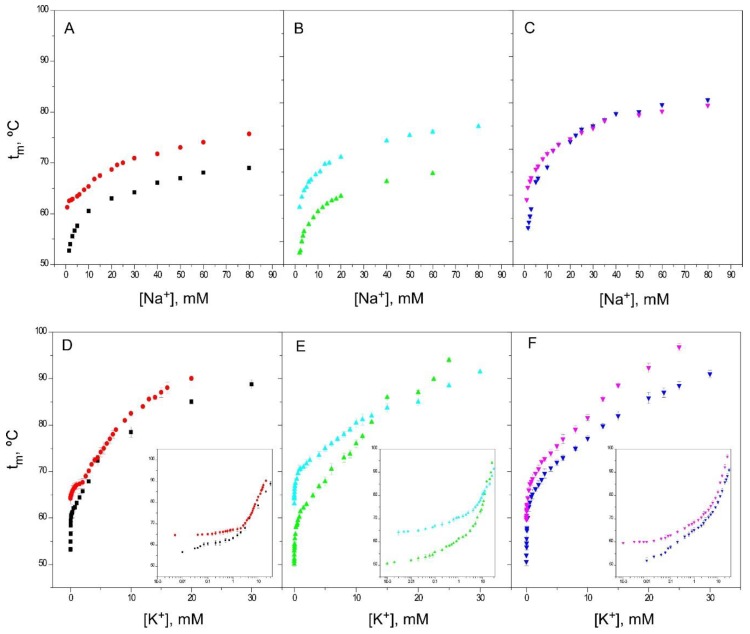
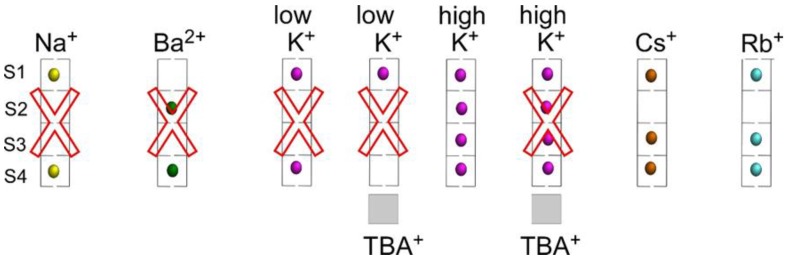
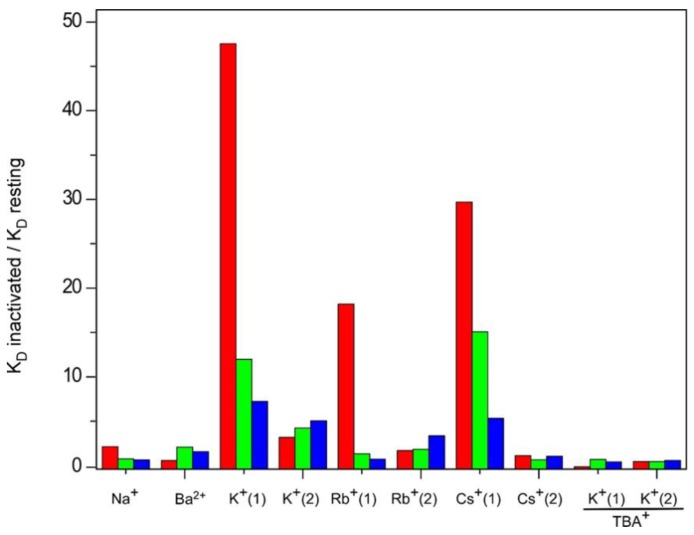
Cation binding under equilibrium conditions has been used as a tool to explore the accessibility of permeant and nonpermeant cations to the selectivity filter in three different inactivated models of the potassium channel KcsA. The results show that the stack of ion binding sites (S1 to S4) in the inactivated filter models remain accessible to cations as they are in the resting channel state. The inactivated state of the selectivity filter is therefore "resting-like" under such equilibrium conditions. Nonetheless, quantitative differences in the apparent KD's of the binding processes reveal that the affinity for the binding of permeant cations to the inactivated channel models, mainly K⁺, decreases considerably with respect to the resting channel. This is likely to cause a loss of K⁺ from the inactivated filter and consequently, to promote nonconductive conformations. The most affected site by the affinity loss seems to be S4, which is interesting because S4 is the first site to accommodate K⁺ coming from the channel vestibule when K⁺ exits the cell. Moreover, binding of the nonpermeant species, Na⁺, is not substantially affected by inactivation, meaning that the inactivated channels are also less selective for permeant versus nonpermeant cations under equilibrium conditions.

Keywords: C-type inactivation; fluorescence; ion-protein interactions; potassium channels; protein thermal stability; selectivity filter conformation.


Conflict of interest statement

The authors declare no conflict of interest.

Figures

Figure 1
Figure 1
Schematic structure of the potassium channel KcsA. Panel A shows a side view of the full-length tetramer (PDB entry: 3EFF). Each monomer is highlighted in a different color. The location of the outer and inner gates, the latter in its closed conformation, is indicated by red squares. Panel B zooms in on the transmembrane portion of the channel (only two of the four identical subunits have been drawn for clarity) (PDB entry: 1K4C). Each monomer exhibits two transmembrane helices (TM1 and TM2), connected by the P-loop region and the selectivity filter (highlighted in red). Tryptophan residues are colored in blue and cations within the filter and in the channel vestibule appear as red spheres.
Figure 2
Figure 2
TBA+ binding to the resting and inactivated models of the KcsA channel. Thermal denaturation of DDM-solubilized KcsA was recorded in the presence of increasing concentrations of TBA+ by monitoring the temperature dependence of the protein intrinsic fluorescence. The midpoint temperature of the denaturation process (tm) at each TBA+ concentration was calculated from the thermal denaturation curves and plotted versus the TBA+ concentration. Panel A shows the results obtained from the resting KcsA channel (WT pH 7 (■) and from the three inactivated channel models (WT pH 4 (); 1–125 () and OPEN () KcsA). All TBA+ titrations started with the channel proteins at a 1 µM concentration in either 20 mM Hepes (pH 7.0) or 10 mM succinic acid (pH 4.0) buffers, both containing 5 mM DDM and 1.5 mM NaCl. Here, as well as in all tm vs. cation concentration plots in Figure 2, Figure 3, Figure 4, Figure 5, Figure 6, Figure 7 and Figure 8, the experimental results are the average tm (in Celsius) ± SD at each cation concentration from three to four independent titrations. The term “independent” denotes that the samples were prepared from different protein stocks and the titrations were carried out on different days. Panel B illustrates the fitting of the average Tm (in kelvins) experimental data from panel A to the theoretical function given in Equation (1). The apparent dissociation constants estimated for the WT pH 7, WT pH 4, and the 1–125 and OPEN KcsA channels were 5 × (2.8–8.9) × 10−9, 3.5 × (2.9–4.3) × 10−4 M, 1.7 × (1.3–2.3) × 10−5 M and 1.7 × (1.2–2.5) × 10−5 M, respectively. In parentheses are the confidence intervals (CIs), using a percentage of confidence of 95%.
Figure 3
Figure 3
Binding of Na+ to KcsA. Panel A illustrates Na+ binding to KcsA channels, monitored through the Na+ concentration dependence of the tm of thermal denaturation. The results are the average (n = 3) tm (in Celsius) ± SD. Symbols and colors are the same as in Figure 2. Panel B shows the fitting of the experimental data from Panel A to Equation (1) (see Methods). The apparent KD values for the above binding events are given in Table 1.
Figure 4
Figure 4
Binding of Ba2+ to KcsA. Panel A illustrates Ba2+ binding to KcsA channels, monitored through the Ba2+ concentration dependence of the tm of thermal denaturation. The results are the average (n = 3) tm (in Celsius) ± SD. The symbols and colors are the same as in Figure 2. Panel B shows the fitting of the experimental data from Panel A to Equation (1) (see Methods). The apparent KD values for the above binding events are given in Table 1.
Figure 5
Figure 5
Binding of K+ to KcsA. Panel A shows K+ titrations covering the widest possible range of concentrations (i.e., those increasing the tm to near the thermostat limit of our circulating water bath) conducted on KcsA samples containing 1.5 mM Na+ as the starting point. The results are the average (n = 3) tm (in Celsius) ± SD. The symbols and colors are the same as in Figure 2. Inset to panel A are semi-log plots of the binding processes to illustrate in a simple manner the presence of two different sets of K+ binding sites. Indeed, fitting the data from panel A to Equation (1) fails when taking into account the whole titration curve (i.e., assuming a single set of binding sites) (Panel B), but it suffices when the low (Panel C) and the high (Panel D) K+ concentration ranges are analyzed separately, suggesting that at least two different sets of K+ binding sites are present in the KcsA samples. The analysis of the binding data to more than one set of binding sites and the determination of the apparent dissociation constants for the individual binding events, as in Figure 5, Figure 6 and Figure 7, have been described in detail in the Supplementary Information to Reference [33]. The apparent KD values estimated for the above binding events are given in Table 1.
Figure 6
Figure 6
Effects of TBA+ blockade on the binding of K+ to KcsA. Panel A shows titration experiments conducted on KcsA samples as in Figure 5, but in the continuous presence of 10 mM TBA+. The results are the average (n = 3) tm (in Celsius) ± SD. The symbols and colors are the same as in Figure 2. Inset to panel A is a semi-log plot that still reveals the presence of two sets of K+ binding sites, even under TBA+ blockade. Panels B and C show the fitting of the experimental data from the low and high K+ concentration ranges, respectively, to Equation (1). The apparent KD values derived from such fittings are included in Table 1.
Figure 7
Figure 7
Binding of Cs+ and Rb+ to KcsA. The changes in the apparent tm with the concentration of Cs+ and Rb+ (Panels A and D, respectively) allows the detection of two sets of thermodynamically different binding sites, as illustrated in the insets to Panels A and D. The results are the average (n = 3) tm (in Celsius) ± SD. Panels B and E show the fitting of the experimental data to Equation (1) for the first sets of binding sites for the two cations (low concentration range), whereas Panels C and F show the fits for the second set of binding sites (high concentration range). The symbols and colors are the same as in Figure 2. The apparent KD values calculated for these experiments are included in Table 1.
Figure 8
Figure 8
Effect of pH 4 on the thermal stability of the different KcsA models. Panels A, B and C compare the Na+ binding profiles, while Panels D, E and F show the K+ binding profiles (and the corresponding semi-log plots as insets) of the same KcsA samples prepared at pH 7 and pH 4. The results are the average (n = 3) tm (in Celsius) ± SD. Symbols and colors are WT KcsA at pH 4 () and pH 7 (■); 1–125 KcsA at pH 4 () and pH 7 () and OPEN KcsA at pH 4 () and pH 7 ().
Figure 9
Figure 9
Idealized potential occupation of the KcsA selectivity filter by Na+, Ba2+, K+, Cs+ and Rb+, in the presence or absence of TBA+ bound to the channel’s vestibule. Red crosses indicate nonconductive conformations for the selectivity filter under those experimental conditions. The PDB entries used for these models are: 2ITC (Na+), 2ITD (Ba2+), 1K4D (low K+), 2HVJ (low K+, TBA+), 1K4C (high K+), 2HVK (high K+, TBA+), 1R3L (Cs+) and 1R3I (Rb+).
Figure 10
Figure 10
Relative affinities for nonpermeant and permeant cations presented by the three KcsA inactivated model channels, with respect to the resting state. The bar graph shows the ratio between the mean apparent KD’s of the inactivated and resting states given in Table 1. Colors represent: KcsA at pH 4 (), 1–125 KcsA at pH 7 () and OPEN KcsA at pH 7 ().

Similar articles

Cited by

References

    1. Hille B. Ion Channels of Excitable Membranes. Sinauer Assoc. Inc.; Sunderland, MA, USA: 2001. p. 5.
    1. Doyle D.A. The Structure of the Potassium Channel: Molecular Basis of K+ Conduction and Selectivity. Science. 1998;280:69–77. doi: 10.1126/science.280.5360.69. - DOI - PubMed
    1. Uysal S., Vasquez V., Tereshko V., Esaki K., Fellouse F.A., Sidhu S.S., Koide S., Perozo E., Kossiakoff A. Crystal structure of full-length KcsA in its closed conformation. Proc. Natl. Acad. Sci. USA. 2009;106:6644–6649. doi: 10.1073/pnas.0810663106. - DOI - PMC - PubMed
    1. Zhou Y., Morais-Cabral J.H., Kaufman A., Mackinnon R. Chemistry of ion coordination and hydration revealed by a K+channel-Fab complex at 2.0 Å resolution. Nature. 2001;414:43–48. doi: 10.1038/35102009. - DOI - PubMed
    1. Cheng W.W.L., McCoy J.G., Thompson A.N., Nichols C.G., Nimigean C.M. Mechanism for selectivity-inactivation coupling in KcsA potassium channels. Proc. Natl. Acad. Sci. USA. 2011 doi: 10.1073/pnas.1014186108. - DOI - PMC - PubMed

LinkOut - more resources