. 2019 Feb 5;8(2):191.
doi: 10.3390/jcm8020191.

Indoxyl Sulfate Induces Apoptosis Through Oxidative Stress and Mitogen-Activated Protein Kinase Signaling Pathway Inhibition in Human Astrocytes

Affiliations

Indoxyl Sulfate Induces Apoptosis Through Oxidative Stress and Mitogen-Activated Protein Kinase Signaling Pathway Inhibition in Human Astrocytes

Yi-Ting Lin et al. J Clin Med. .

Abstract

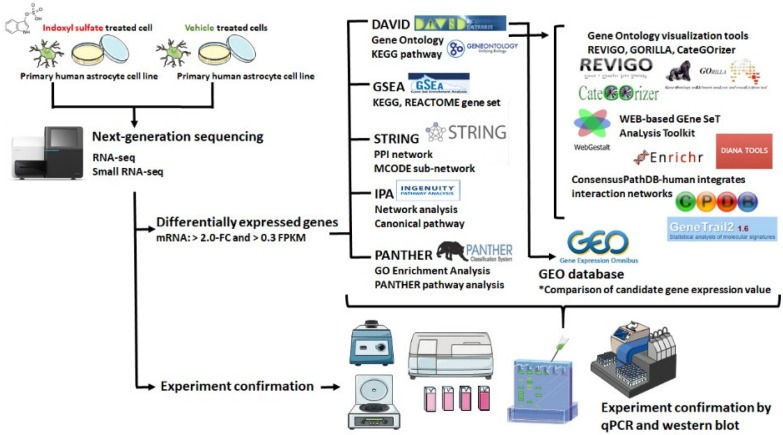
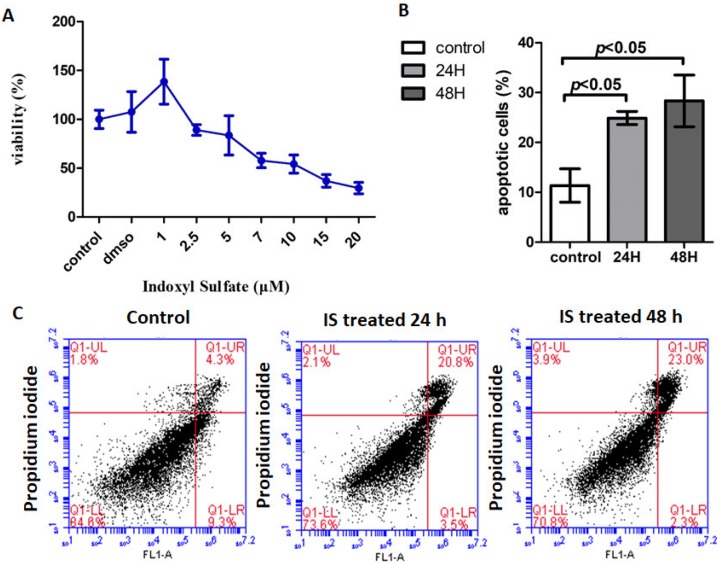
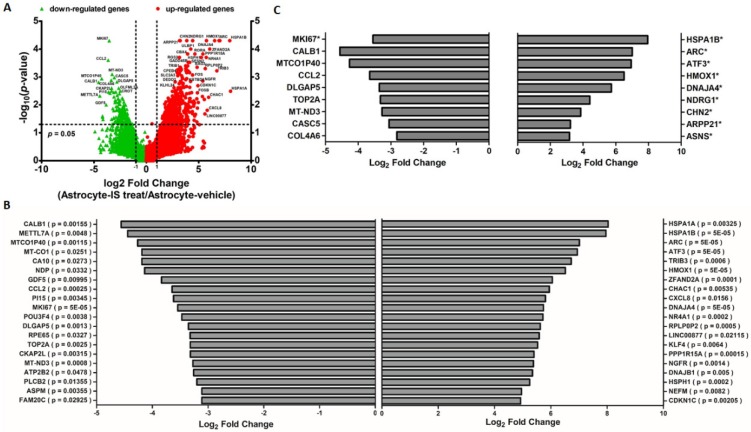
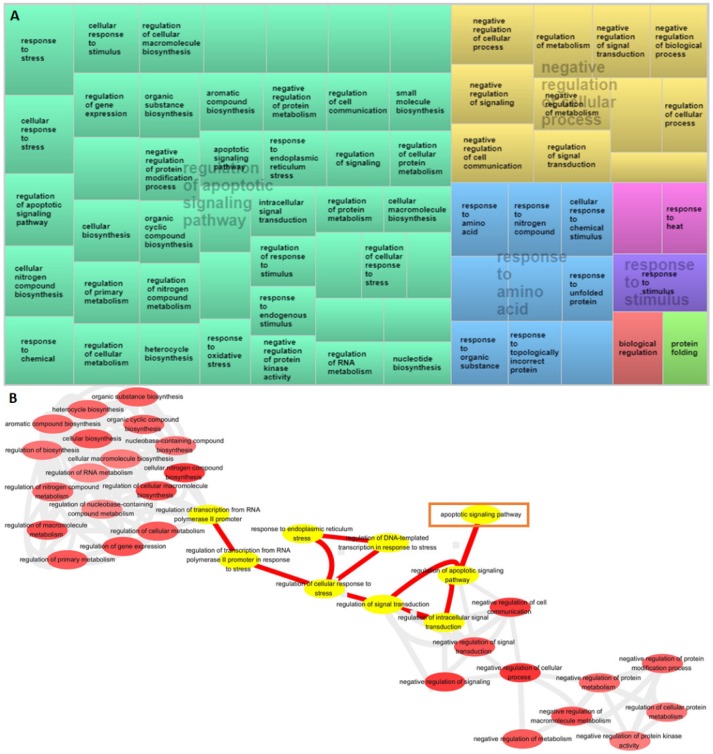
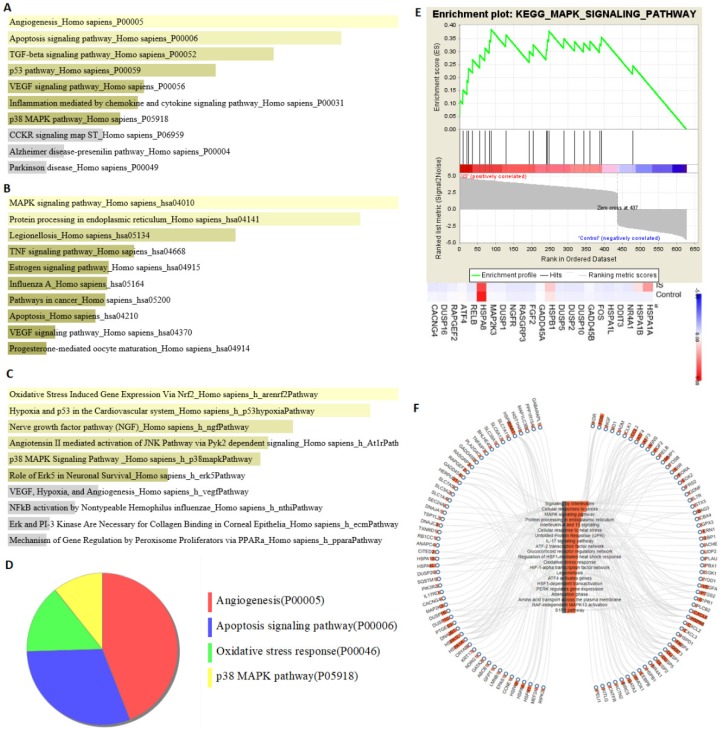
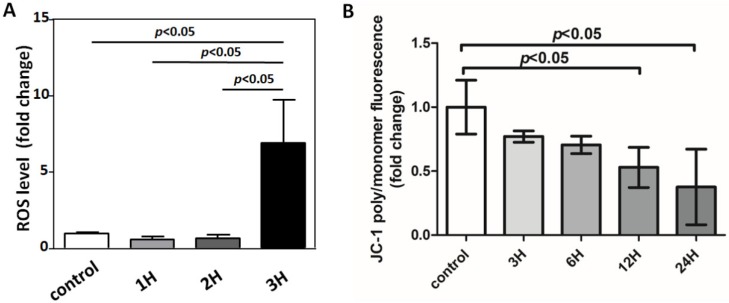
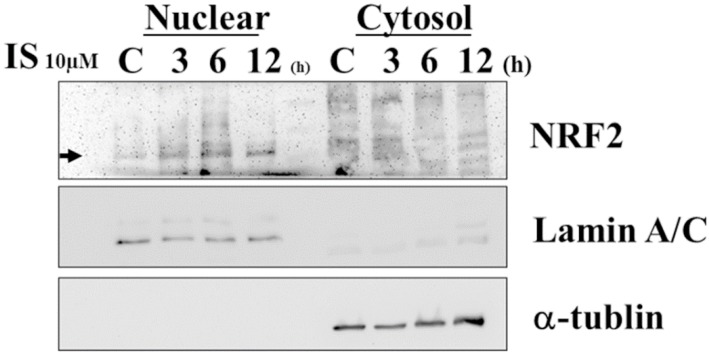
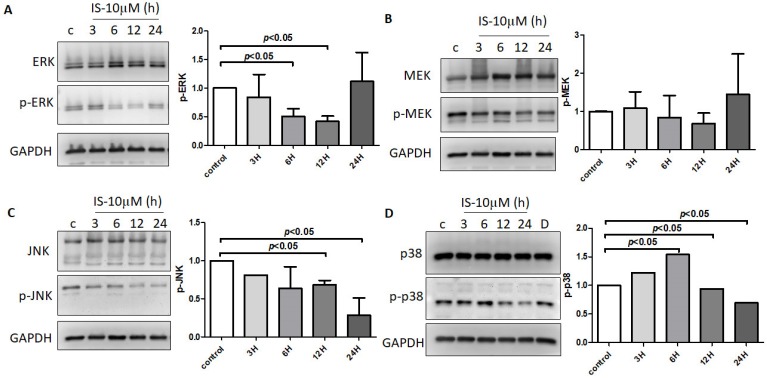
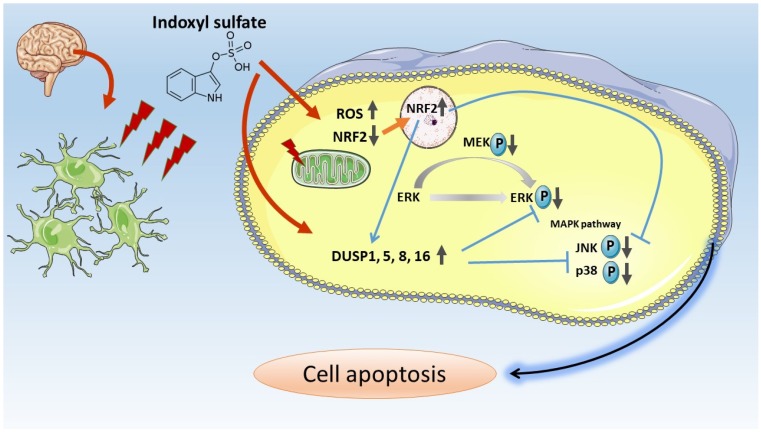
Uremic toxins accumulated in chronic kidney disease (CKD) increases the risk of cognitive impairment. Indoxyl sulfate (IS) is a well-known protein-bound uremic toxin that is correlated with several systemic diseases, but no studies on human brain cells are available. We investigated the effect of IS on primary human astrocytes through next-generation sequencing and cell experiment confirmation to explore the mechanism of IS-associated brain damage. Total RNAs extracted from IS-treated and control astrocytes were evaluated by performing functional and pathway enrichment analysis. The toxicities of IS in the astrocytes were investigated in terms of cell viability through flow cytometry; the signal pathway was then investigated through immunoblotting. IS stimulated the release of reactive oxygen species, increased nuclear factor (erythroid-derived 2)-like 2 levels, and reduced mitochondrial membrane potential. IS triggered astrocyte apoptosis by inhibiting the mitogen-activated protein kinase (MAPK) pathway, including extracellular-signal-regulated kinase (ERK), MAPK/ERK kinase, c-Jun N-terminal kinase, and p38. The decreased ERK phosphorylation was mediated by the upregulated dual-specificity phosphatase 1, 5, 8, and 16. In conclusion, IS can induce neurotoxicity in patients with CKD and the pathogenesis involves cell apoptosis through oxidative stress induction and MAPK pathway inhibition in human astrocytes.

Keywords: astrocyte; dual specific phosphatase; indoxyl sulfate; mitogen-activated protein kinase; oxidative stress; uremic toxins.


Conflict of interest statement

The authors declare no conflict of interest.

Figures

Figure 1
Figure 1
Flowchart of study design. The primary human astrocytes with and without IS treatment were cultured and harvested for RNA sequencing and expression profiling. Differentially expressed genes with >2-fold change (FC) and >0.3 fragments per kilo base of transcript million (FPKM) were selected for further enrichment analyses by using different bioinformatics resources. Array data related to IS-treated cell lines were searched in the Gene Expression Omnibus (GEO) database, and the expression patterns of candidate genes of interest in these arrays were analyzed. The bioinformatics analysis results were further verified by experimental confirmation.
Figure 2
Figure 2
The cellular toxicity of IS treated human astrocyte. (A) Effect of IS on cell viability of human astrocytes. Cell viability was assessed with WST-1 assay after 72 h of treatment with different concentrations of IS. The cell toxicity of IS was found to be dose dependent. Exposure to 1, 2.5, 5, 7.5, 10, 15, and 20 μM IS decreased cell viability. The graph represents mean cell viability (%) ± standard deviation (SD) of three independent experiments. (B) IS induced human astrocyte apoptosis at 24 h and 48 h compared to control. (C) Human astrocytes were treated in either control or IS for 24 h and 48 h. The results were analyzed using a flow cytometer with fluorescein-isothiocyanate-conjugated Annexin V and propidium iodide stain. Increased apoptosis was noted in the astrocytes treated with IS for 24 h and 48 h.
Figure 3
Figure 3
Display of differential expression patterns of IS-treated and vehicle-treated human astrocyte from deep sequencing. (A) Volcano plot of the RNA sequencing result of differential gene expression in IS and vehicle-treated astrocyte. The x-axis indicates the logarithm to the base 2 of expression fold-change (astrocyte-IS treat/Astrocyte-vehicle), and the y-axis indicates the negative logarithm to the base 10 of the p-values. Red circular marks represent upregulated genes in the Astrocyte-IS treat group, and green triangular marks represent downregulated genes in the Astrocyte-IS treat group. Vertical lines reflect the filtering thresholds of 2.0-fold-change, and horizontal line reflect filtering threshold of p-value = 0.05. A total of 437 significantly upregulated and 191 significantly downregulated genes in IS-treated astrocytes can be identified. (B) Bar graphs display the top 20 upregulated and 20 downregulated genes in IS-treated astrocytes with p-value < 0.05. (C) Bar graphs display the upregulated and downregulated genes in IS-treated astrocytes with a false discovery rate (FDR) adjusted p-value (* indicates FDR-adjusted p-value < 0.05).
Figure 4
Figure 4
Gene Ontology (GO) enrichment analysis of differentially expressed genes based on over-representation analysis (ORA). (A) Enrichment of DEGs among biological process category in IS-treated astrocytes. Treemaps of DEGs generated using REVIGO. Each rectangle is a single cluster representative. The representatives are joined into “superclusters” of loosely related terms, visualized with different colors. Similar colors denote semantic similarity, and the dimension of the area is proportional to the overall direction of impact. Sizes of the rectangles reflect either the p-value or the frequency of the GO term in a given cluster. (B) REVIGO interactive graph accessed using Gorilla-summarized gene ontology biological process categories.
Figure 5
Figure 5
Pathway enrichment analysis of differentially expressed genes. The results of (A) PANTHER (Protein ANalysis THrough Evolutionary Relationships), (B) KEGG (Kyoto Encyclopedia of Genes and Genomes), and (C) BioCarta pathway enrichment analyses performed using Enrichr method. (D) The major PANTHER pathway identified using the Benjamini–Hochberg false discovery rate (FDR) multiple test correction. (E) The Gene Set Enrichment Analysis (GSEA) result of differentially expressed genes. The 628 differentially expressed genes in IS-treated astrocytes were uploaded into GSEA for enrichment analysis. The KEGG gene sets database was used as the gene set collection for analysis. GSEA performed 1000 permutations. The cutoff for significant gene sets was a false discovery rate <25%. (F) The correlation of KEGG pathway and associated gene expression on IS-treated astrocytes using WebGIVI web-based gene visualization tool. The bar chart on the node represents the frequency of the said node.
Figure 6
Figure 6
Network analysis of differentially expressed genes. Central gene identification according to IPA core analysis. ERK is the central gene in the interaction network.
Figure 7
Figure 7
IS induced mitochondrial dysfunction and ROS production. (A) Cells treated with IS for various durations (1 h, 2 h, and 3 h), and ROS level determined by staining with H2DCFDA fluorescent dye, followed by flow cytometry analysis. The ROS increases markedly at 3 h after IS treatment. (B) IS-treated astrocytes induce loss of mitochondrial membrane potential as measured by JC-1 and flow cytometry at 12 and 24 h. Data represent mean ± SD of a representative experiment.
Figure 8
Figure 8
Representative immunoblot analysis of NRF2 in nucleus and cytosol. NRF2 was detected and normalized to lamin A/C in the nucleus and α-tubulin in cytosol. After astrocytes were treated with 10 μM IS for different durations (3, 6, and 12 h), NRF2 was examined in nuclear and cytosolic fractions. NRF2 protein expression was decreased in cytosol and increased in the nucleus.
Figure 9
Figure 9
Human astrocytes treated with control or 10 μM IS for various durations (3 h, 6 h, 12 h, and 24 h). The phosphorylated and total protein levels in the cell lysates were assessed with an immunoblot assay. The results shown are representative of three independent experiments performed on different days, along with relative expression levels to the corresponding control groups at the same time point. IS decreased the phosphorylation of (A) ERK, (B) MEK, (C) JNK, and (D) p-38 at 12 h treatment in human astrocytes. Data represent mean ± SD of a representative experiment.
Figure 10
Figure 10
Scheme of proposed IS-induced apoptosis via ROS-NRF2 and MAPK signaling pathways in human astrocytes.

Similar articles

Cited by

References

    1. O’Lone E., Connors M., Masson P., Wu S., Kelly P.J., Gillespie D., Parker D., Whiteley W., Strippoli G.F., Palmer S.C., et al. Cognition in People with End-Stage Kidney Disease Treated with Hemodialysis: A Systematic Review and Meta-analysis. Am. J. Kidney Dis. 2016;67:925–935. doi: 10.1053/j.ajkd.2015.12.028. - DOI - PubMed
    1. Kurella Tamura M., Covinsky K.E., Chertow G.M., Yaffe K., Landefeld C.S., McCulloch C.E. Functional status of elderly adults before and after initiation of dialysis. N. Engl. J. Med. 2009;361:1539–1547. doi: 10.1056/NEJMoa0904655. - DOI - PMC - PubMed
    1. Rakowski D.A., Caillard S., Agodoa L.Y., Abbott K.C. Dementia as a predictor of mortality in dialysis patients. Clin. J. Am. Soc. Nephrol. CJASN. 2006;1:1000–1005. doi: 10.2215/CJN.00470705. - DOI - PubMed
    1. Kurella Tamura M., Yaffe K. Dementia and cognitive impairment in ESRD: Diagnostic and therapeutic strategies. Kidney Int. 2011;79:14–22. doi: 10.1038/ki.2010.336. - DOI - PMC - PubMed
    1. Bugnicourt J.M., Godefroy O., Chillon J.M., Choukroun G., Massy Z.A. Cognitive disorders and dementia in CKD: the neglected kidney-brain axis. J. Am. Soc. Nephrol. JASN. 2013;24:353–363. doi: 10.1681/ASN.2012050536. - DOI - PubMed