. 2019 Feb 19;8(4):e010926.
doi: 10.1161/JAHA.118.010926.

Metabolic Changes in Spontaneously Hypertensive Rat Hearts Precede Cardiac Dysfunction and Left Ventricular Hypertrophy

Affiliations

Metabolic Changes in Spontaneously Hypertensive Rat Hearts Precede Cardiac Dysfunction and Left Ventricular Hypertrophy

Jie Li et al. J Am Heart Assoc. .

Abstract

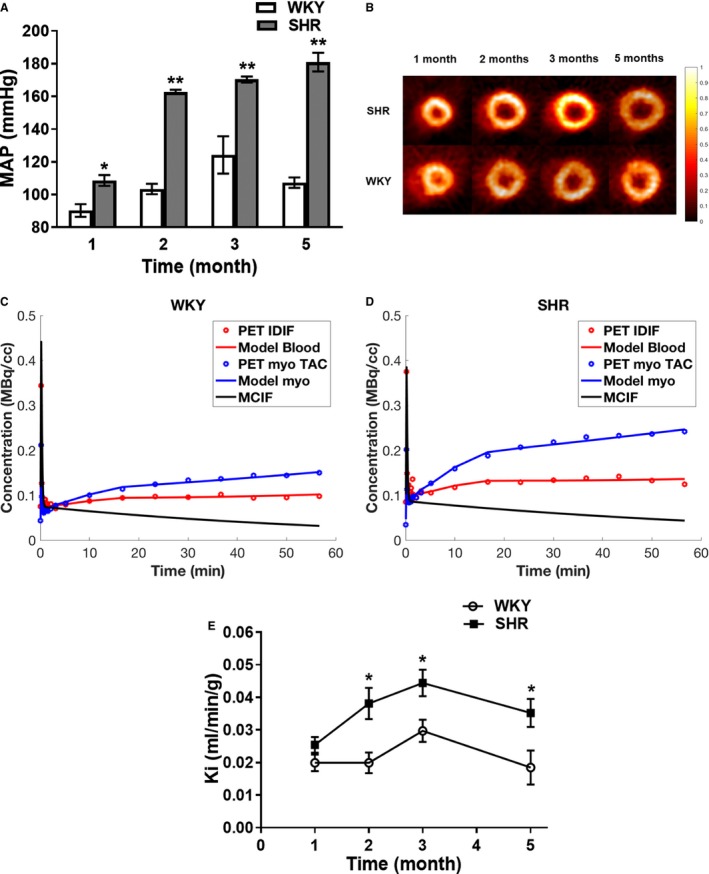
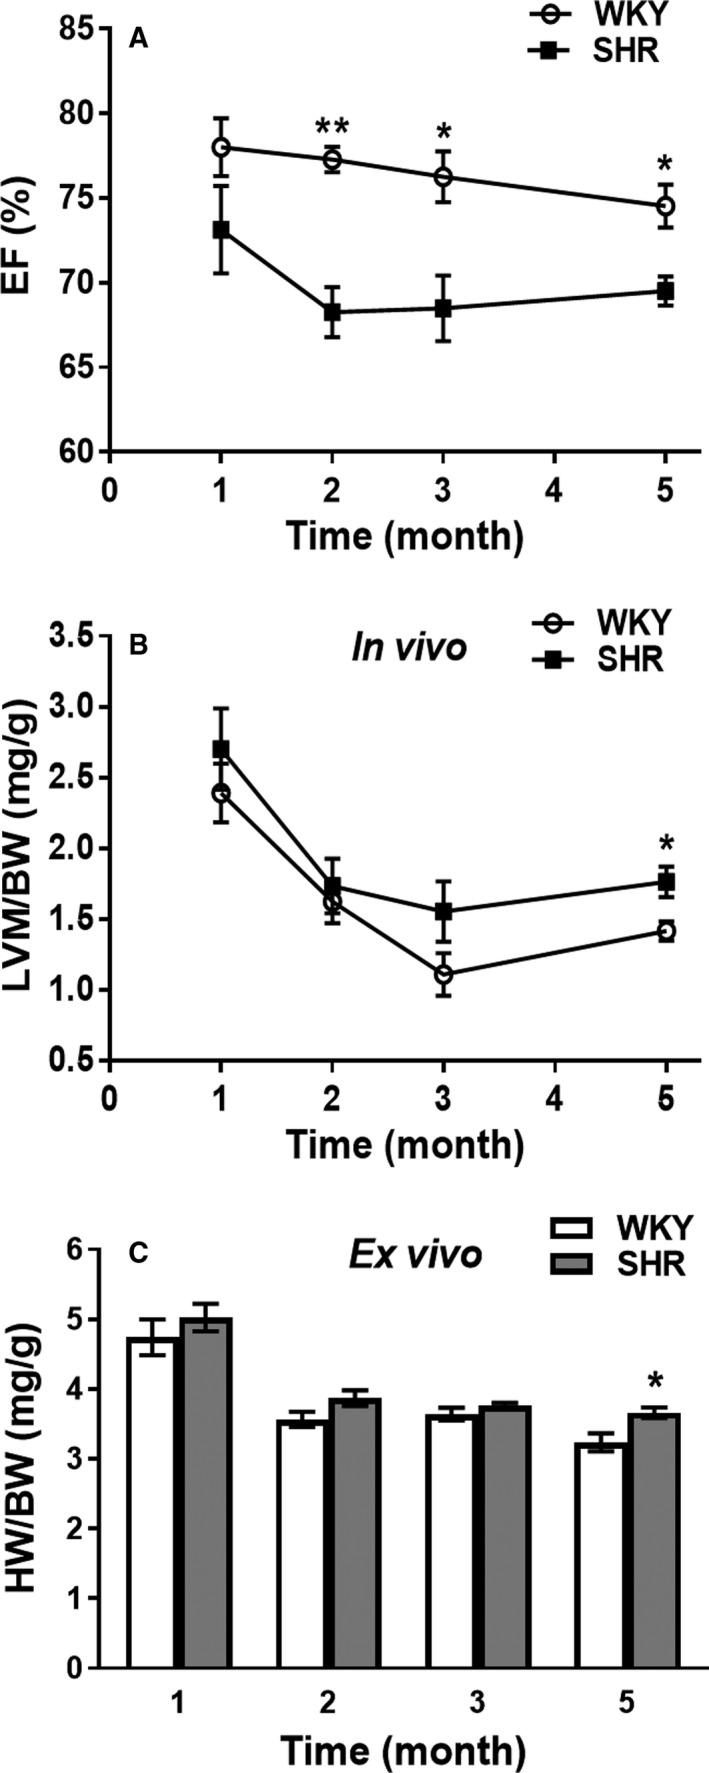
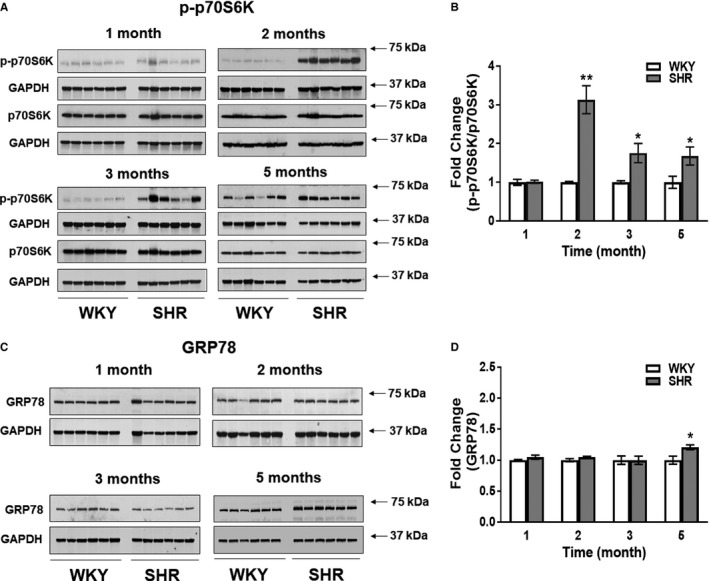
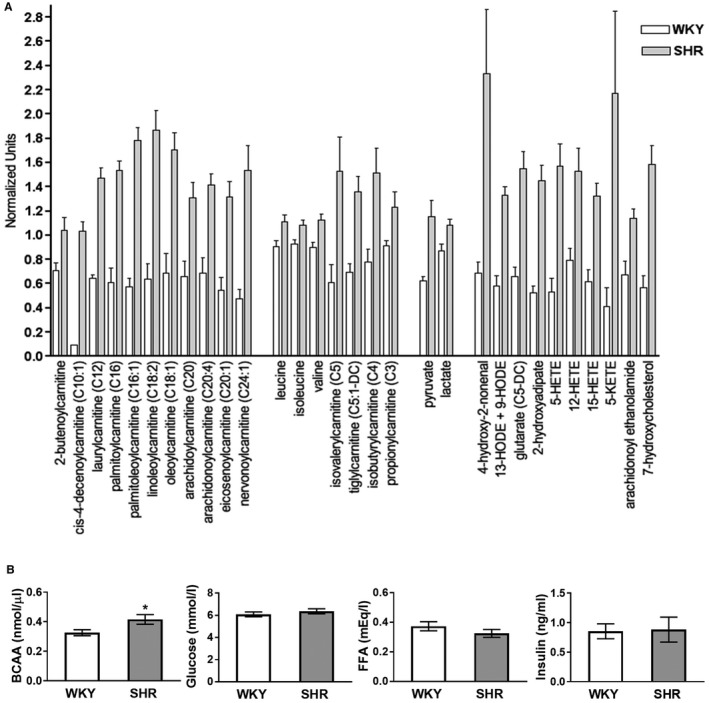
Background Sustained pressure overload leads to changes in cardiac metabolism, function, and structure. Both time course and causal relationships between these changes are not fully understood. Therefore, we studied spontaneously hypertensive rats (SHR) during early hypertension development and compared them to control Wistar Kyoto rats. Methods and Results We serially evaluated myocardial glucose uptake rates (Ki) with dynamic 2-[18F] fluoro-2-deoxy-D-glucose positron emission tomography, and ejection fraction and left ventricular mass to body weight ratios with cardiac magnetic resonance imaging in vivo, determined glucose uptake and oxidation rates in isolated perfused hearts, and analyzed metabolites, mammalian target of rapamycin activity and endoplasmic reticulum stress in dissected hearts. When compared with Wistar Kyoto rats, SHR demonstrated increased glucose uptake rates (Ki) in vivo, and reduced ejection fraction as early as 2 months of age when hypertension was established. Isolated perfused SHR hearts showed increased glucose uptake and oxidation rates starting at 1 month. Cardiac metabolite analysis at 2 months of age revealed elevated pyruvate, fatty acyl- and branched chain amino acid-derived carnitines, oxidative stress, and inflammation. Mammalian target of rapamycin activity increased in SHR beginning at 2 months. Left ventricular mass to body weight ratios and endoplasmic reticulum stress were elevated in 5 month-old SHR. Conclusions Thus, in a genetic hypertension model, chronic cardiac pressure overload promptly leads to increased myocardial glucose uptake and oxidation, and to metabolite abnormalities. These coincide with, or precede, cardiac dysfunction while left ventricular hypertrophy develops only later. Myocardial metabolic changes may thus serve as early diagnostic markers for hypertension-induced left ventricular hypertrophy.

Keywords: hypertension; hypertrophy/remodeling; metabolic imaging; myocardial metabolism; rats.


Figures

Figure 1
Figure 1
Increased glucose uptake during hypertension development in SHR. A, Blood pressure. MAP was measured in SHR (n=6) and WKY (n=6) at 1, 2, 3, and 5 months of age. MAP were recorded every minute and values averaged to obtain the reported data with standard errors. *P=0.020 SHR vs WKY. B, Transverse in vivo FDG PET images. SHR (n=8) and WKY (n=5) rats were serially imaged at 1, 2, 3, and 5 months of age using FDG PET imaging. Representative transverse last time frame intensity images of SHR and WKY hearts normalized to the injected dose and animal weight are shown. C and D, Time activity curves for WKY (C) and SHR (D) at 2 months of age. Representative time activity curves for LV blood pools and myocardium, model fits, and model corrected blood input function (MCIF). E, myocardial glucose uptake rates in vivo in SHR. Glucose uptake rates were computed from serial FDG PET images of SHR (n=8) and WKY (n=5) hearts. All data are shown as mean±SE. MAP indicates mean arterial pressure; PET, positron emission tomography; SHR, spontaneously hypertensive rats; TAC, time activity curve; IDIF, image‐derived input function; WKY, Wistar Kyoto rats. *P<0.05 SHR vs WKY.
Figure 2
Figure 2
Early deteriorating cardiac function, and development of left ventricular hypertrophy (LVH) in SHR in vivo. A, Ejection fractions (EF) and B, left ventricular mass to body weight ratios (LVM/BW), were determined in SHR (n=8) and WKY (n=5) at 1, 2, 3, and 5 months of age using CMR. C, Heart weight to body weight ratios ex vivo. Entire heart weights were determined after dissection from SHR (n=6) and WKY (n=6) and normalized to body weight (HW/BW). All data are shown as mean±SE. BW indicates body weight; CMR, cardiac magnetic resonance; EF, ejection fraction; HW, heart weight; LVH, left ventricular hypertrophy; LVM, left ventricular mass; SHR, spontaneously hypertensive rats; WKY, Wistar Kyoto rats. *P<0.05 and P<0.001 SHR vs WKY.
Figure 3
Figure 3
Increased glucose uptake and oxidation in isolated perfused SHR hearts. Rates of myocardial glucose uptake (A and B) and oxidation (C and D) were measured in isolated perfused working hearts of SHR (n=6) and WKY (n=6) rats at 1, 2, 3, and 5 months of age at normal workload (Baseline) (A and C) and at increased workload (Afterload) (B and D). All data are shown as mean±SE. SHR indicates spontaneously hypertensive rats; WKY, Wistar Kyoto rats. *P<0.001 SHR vs WKY.
Figure 4
Figure 4
mTOR and ER stress activation in SHR. A, SHR (n=6) and WKY (n=6) hearts were immunoblotted for phospho‐p70S6K (p‐p70S6K), a marker for mTOR activity, total p70S6K, and GAPDH at 1, 2, 3, and 5 months of age. B, Signal intensities for p‐p70S6K and p70S6K were normalized to GAPDH, and p‐p70S6K/p70S6K ratios determined. Results were normalized within age groups (for which samples were analyzed on the same immunoblots) and fold changes reported. C, SHR (n=6) and WKY (n=6) hearts were immunoblotted for GRP78, a marker for endoplasmic reticulum stress, and GAPDH. D, Signal intensities for GRP78 normalized to GAPDH are presented. Results were normalized within age groups (for which samples were analyzed on the same immunoblots) and fold changes reported. All data are shown as mean±SE. *P<0.05 and P<0.001 SHR vs WKY. SHR indicates spontaneously hypertensive rats; WKY, Wistar Kyoto rats.
Figure 5
Figure 5
A, Changes in cardiac fatty acid, BCAA, and glucose metabolites and markers of oxidative stress and inflammation in SHR. Metabolites were analyzed in hearts of SHR (n=9) and WKY (n=10) at 2 months of age as described in S1. Data for biochemicals in raw area counts were rescaled to set medians equal to 1 and plotted. Data are shown as mean±SE. P<0.05 for all metabolites comparing SHR with WKY. B, Circulating BCAA, glucose, FFA, and insulin levels in SHR. Total circulating metabolite levels were measured in SHR (n=8) and WKY (n=8) at 2 months of age. BCAA were significantly higher in SHR (*P<0.05). There were no significant differences in circulating glucose, FFA and insulin concentrations between SHR and WKY. BCAA indicates branched chain amino acids; FFA; free fatty acids; SHR, spontaneously hypertensive rats; WKY, Wistar Kyoto rats. *P<0.05.

References

    1. Bhatia RS, Tu JV, Lee DS, Austin PC, Fang J, Haouzi A, Gong Y, Liu PP. Outcome of heart failure with preserved ejection fraction in a population‐based study. N Engl J Med. 2006;355:260–269. - PubMed
    1. De Jong KA, Lopaschuk GD. Complex energy metabolic changes in heart failure with preserved ejection fraction and heart failure with reduced ejection fraction. Can J Cardiol. 2017;33:860–871. - PubMed
    1. Gropler RJ, Beanlands RS, Dilsizian V, Lewandowski ED, Villanueva FS, Ziadi MC. Imaging myocardial metabolic remodeling. J Nucl Med. 2010;51:88S–101S. - PMC - PubMed
    1. Osterholt M, Sen S, Dilsizian V, Taegtmeyer H. Targeted metabolic imaging to improve the management of heart disease. JACC Cardiovasc Imaging. 2012;5:214–226. - PMC - PubMed
    1. Zhong M, Kundu BK. Optimization of a model corrected blood input function from dynamic FDG‐PET images of small animal heart in vivo. IEEE Trans Nucl Sci. 2013;60:3417–3422. - PMC - PubMed

Publication types

MeSH terms