

Autism, spectrum or clusters? An EEG coherence study
- PMID: 30764794
- PMCID: PMC6375153
- DOI: 10.1186/s12883-019-1254-1
Autism, spectrum or clusters? An EEG coherence study
Abstract
Background: Autism prevalence continues to grow, yet a universally agreed upon etiology is lacking despite manifold evidence of abnormalities especially in terms of genetics and epigenetics. The authors postulate that the broad definition of an omnibus 'spectrum disorder' may inhibit delineation of meaningful clinical correlations. This paper presents evidence that an objectively defined, EEG based brain measure may be helpful in illuminating the autism spectrum versus subgroups (clusters) question.
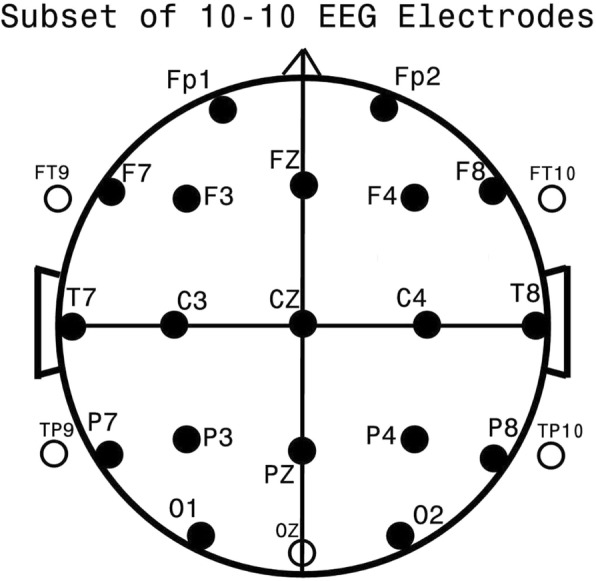
Methods: Forty objectively defined EEG coherence factors created in prior studies demonstrated reliable separation of neuro-typical controls from subjects with autism, and reliable separation of subjects with Asperger's syndrome from all other subjects within the autism spectrum and from neurotypical controls. In the current study, these forty previously defined EEG coherence factors were used prospectively within a large (N = 430) population of subjects with autism in order to determine quantitatively the potential existence of separate clusters within this population.
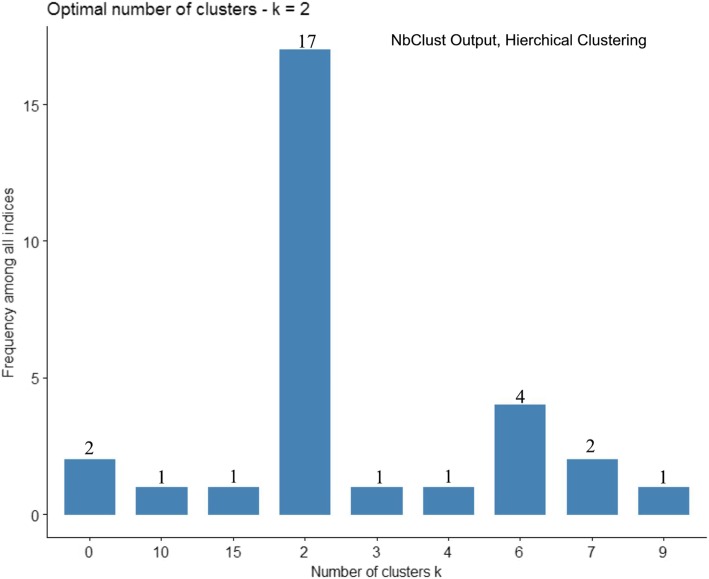
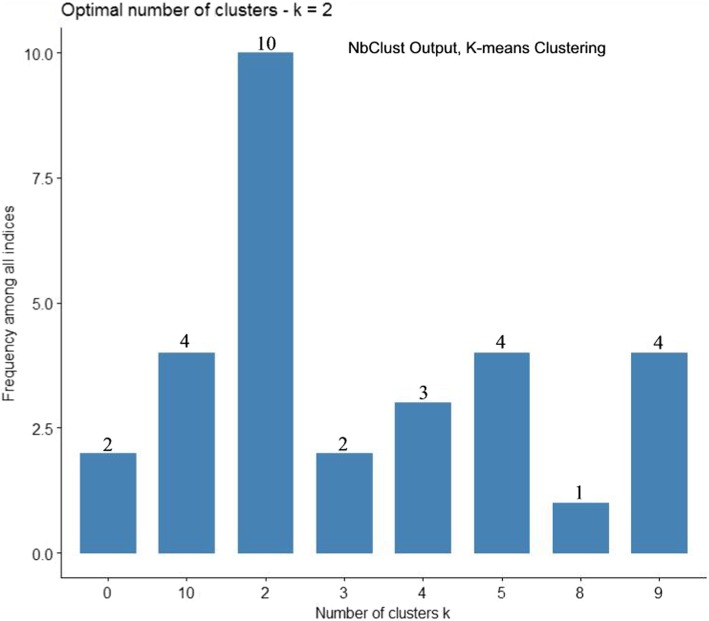
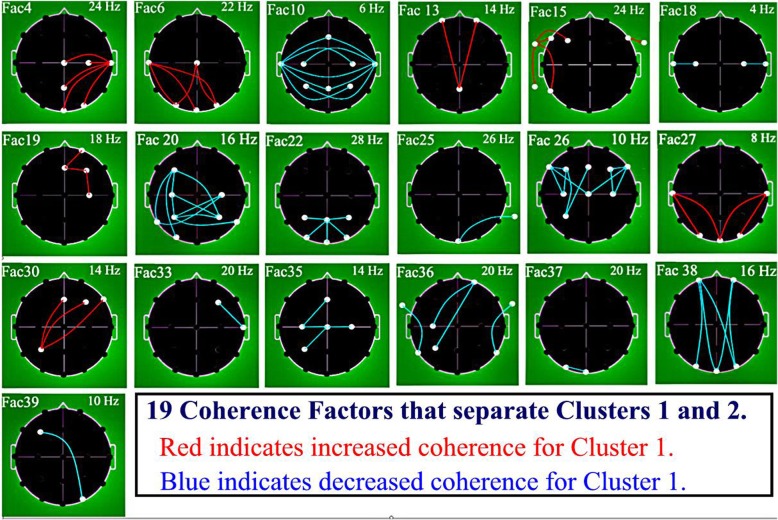
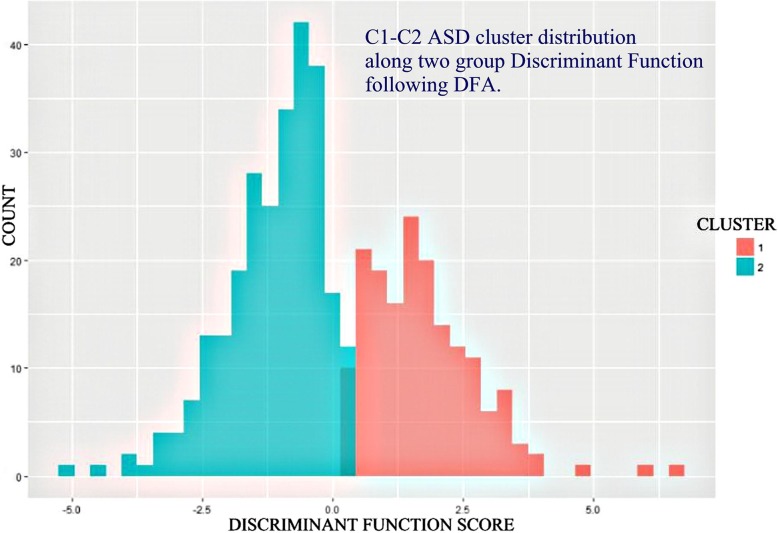
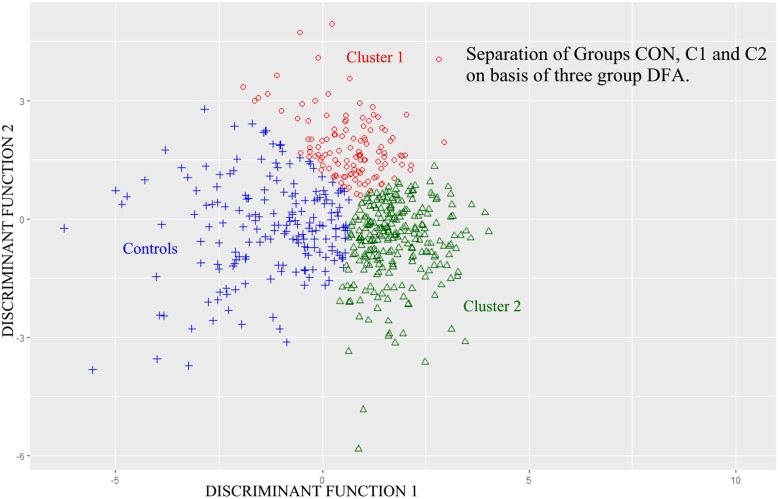
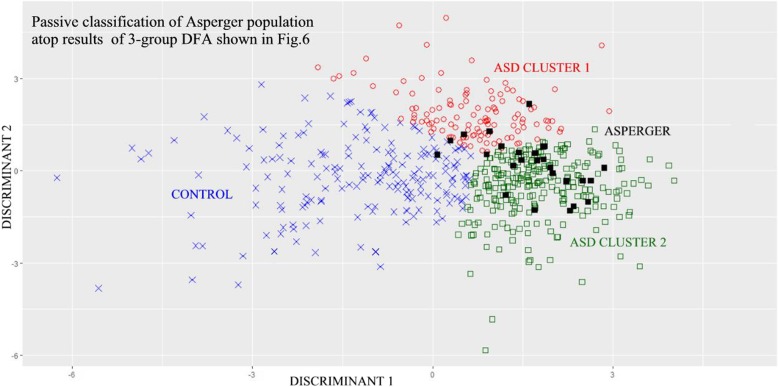
Results: By use of a recently published software package, NbClust, the current investigation determined that the 40 EEG coherence factors reliably identified two distinct clusters within the larger population of subjects with autism. These two clusters demonstrated highly significant differences. Of interest, many more subjects with Asperger's syndrome fell into one rather than the other cluster.
Conclusions: EEG coherence factors provide evidence of two highly significant separate clusters within the subject population with autism. The establishment of a unitary "Autism Spectrum Disorder" does a disservice to patients and clinicians, hinders much needed scientific exploration, and likely leads to less than optimal educational and/or interventional efforts.
Keywords: Asperger’s syndrome (ASP); Autism spectrum disorder (ASD); Cluster analysis; Connectivity; Discriminant analysis; EEG coherence factors; Hierarchical; K-means; NbClust.
Conflict of interest statement
Authors’ information
FHD is a physician, child neurologist, clinical electroencephalographer and research neurophysiologist with degrees in electrical engineering and mathematics. Current research interests are in neuro-developmental disorders and epilepsy, including the development and utilization of specialized analytic techniques to support related investigations. As a clinician FHD has evaluated and managed many patients on the ‘Autism Spectrum’ and has evaluated and officially reported very many clinical EEGs for the BCH Division of Epilepsy and Clinical Neurophysiology. HA is a research and a licensed clinical psychologist with research interests and considerable clinical expertise in newborn, infant and child neuro-development, including generation of early predictors of later outcome from behavioral, MRI, and neurophysiological data.
Ethics approval and consent to participate
All control subjects, as appropriate, and/or their families or guardians gave written informed consent in accordance with protocols approved by the Institutional Review Board (IRB) of Boston Children’s Hospital, Office of Clinical Investigation, which is in keeping with the Declaration of Helsinki, a statement of ethical principles for medical research involving human subjects. Consent was provided by the parents or legally appointed representatives of all minors included in the research presented in this manuscript. The approved protocol is in full compliance with the Declaration of Helsinki. All previous clinical EEG studies of subjects with autism were separately approved for research analysis and subsequent publications by the above IRB with the condition that all data be de-identified. This protocol is also in full compliance with the Declaration of Helsinki. All data for this project were de-identified prior to analysis.
Consent for publication
Not applicable (see paragraph above).
Competing interests
The authors declare that they have no competing interests.
Publisher’s Note
Springer Nature remains neutral with regard to jurisdictional claims in published maps and institutional affiliations.
Figures
References
-
- Association AP . Diagnostic and statistical manual of mental disorders Fith edition DSM-5. Washington, D.C.: American Psychiatric Publishing, Incorporated; 2013.
-
- Association AP. Diagnostic and statistical manual of mental disorders (3rd edition). Washington: American Paychiatric Association; 1980.
-
- Association AP . Diagnostic and statistical manual of mental disorder, DSM-IV. 4. Washington, DC: American Psychiatric Association; 1994.
-
- Mattila ML, Kielinen M, Linna SL, Jussila K, Ebeling H, Bloigu R, Joseph RM, Moilanen I. Autism spectrum disorders according to DSM-IV-TR and comparison with DSM-5 draft criteria: an epidemiological study. J Am Acad Child Adolesc Psychiatry. 2011;50(6):583–592. doi: 10.1016/j.jaac.2011.04.001. - DOI - PubMed
MeSH terms
Grants and funding
LinkOut - more resources
Full Text Sources
Other Literature Sources
Medical
