Comparative Study
. 2019 Feb 14;20(1):35.
doi: 10.1186/s13059-019-1630-6.

Rapid turnover of life-cycle-related genes in the brown algae

Affiliations
Comparative Study

Rapid turnover of life-cycle-related genes in the brown algae

Agnieszka P Lipinska et al. Genome Biol. .

Erratum in

Abstract

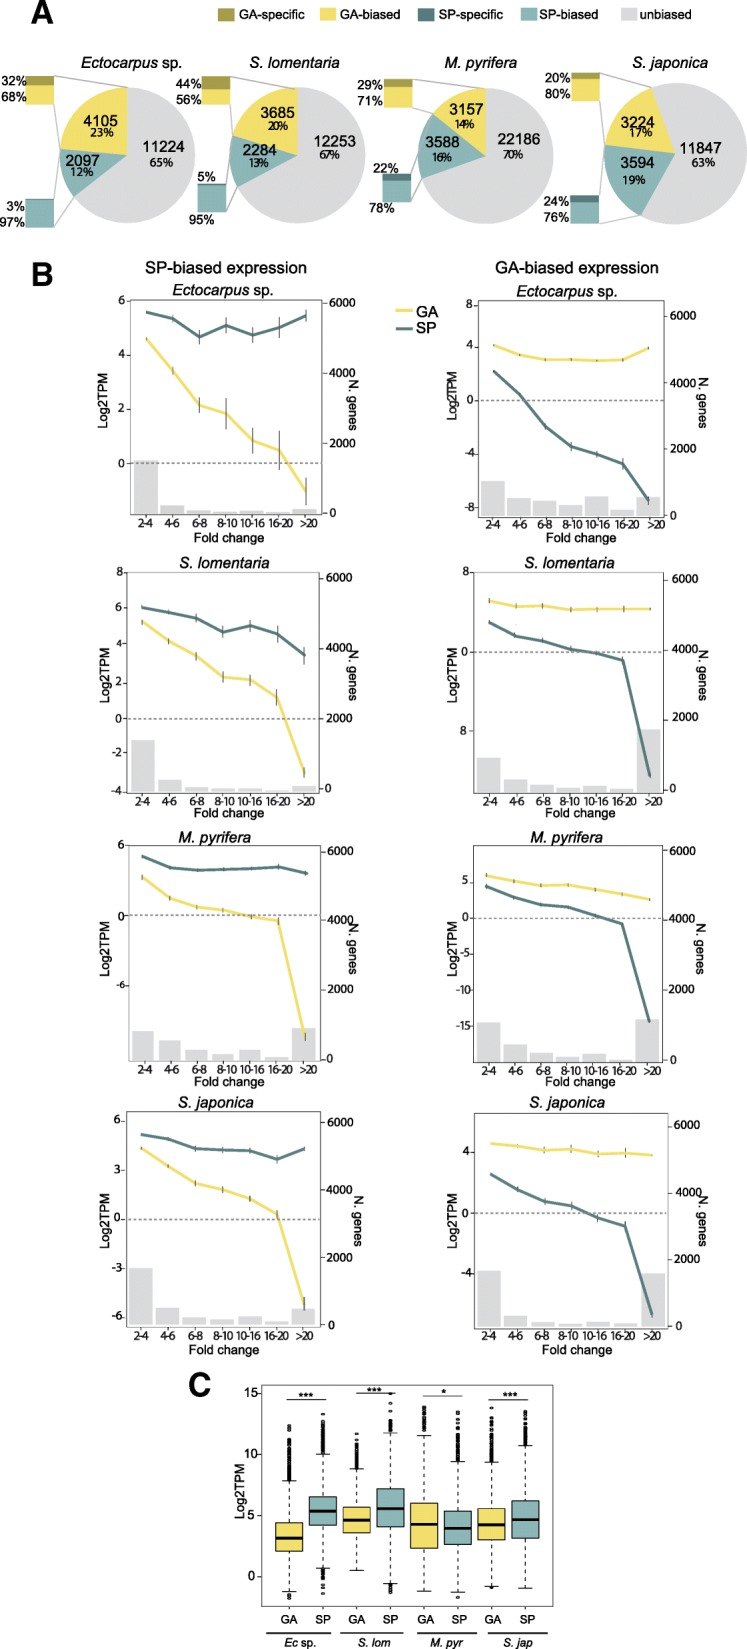
Background: Sexual life cycles in eukaryotes involve a cyclic alternation between haploid and diploid phases. While most animals possess a diploid life cycle, many plants and algae alternate between multicellular haploid (gametophyte) and diploid (sporophyte) generations. In many algae, gametophytes and sporophytes are independent and free-living and may present dramatic phenotypic differences. The same shared genome can therefore be subject to different, even conflicting, selection pressures during each of the life cycle generations. Here, we analyze the nature and extent of genome-wide, generation-biased gene expression in four species of brown algae with contrasting levels of dimorphism between life cycle generations.

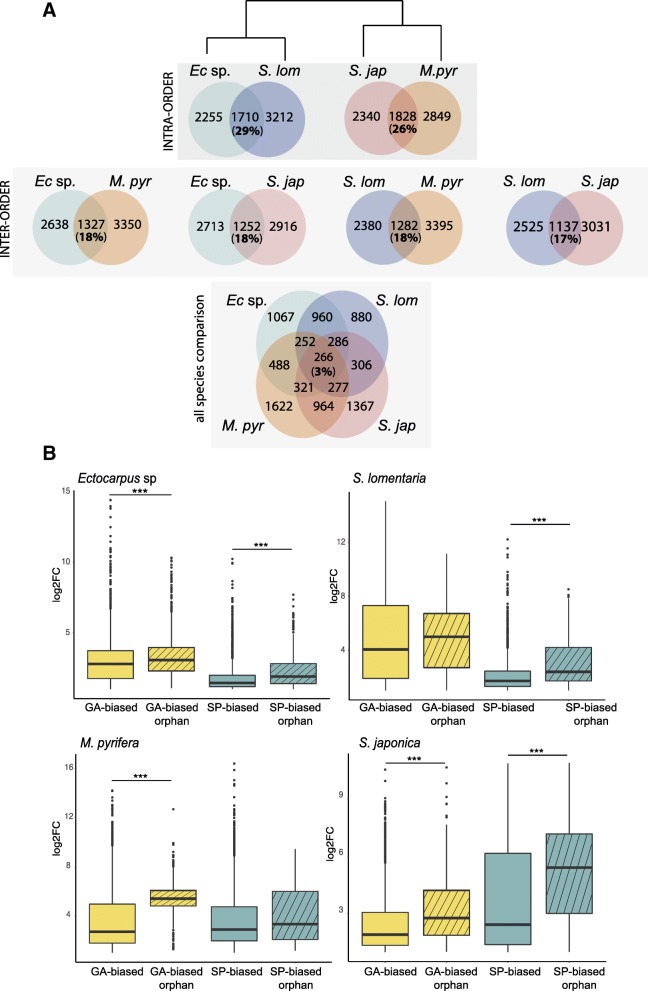
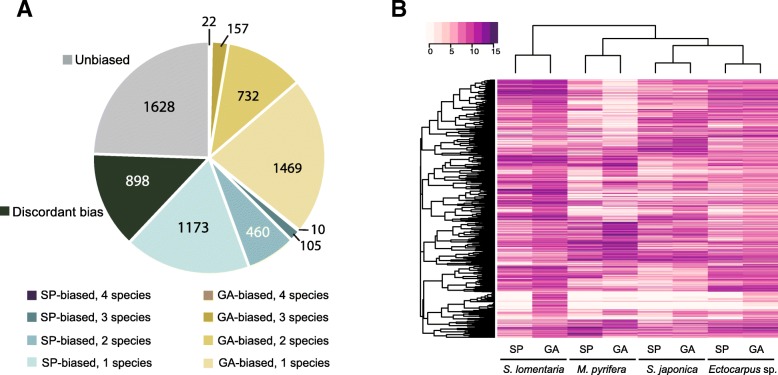
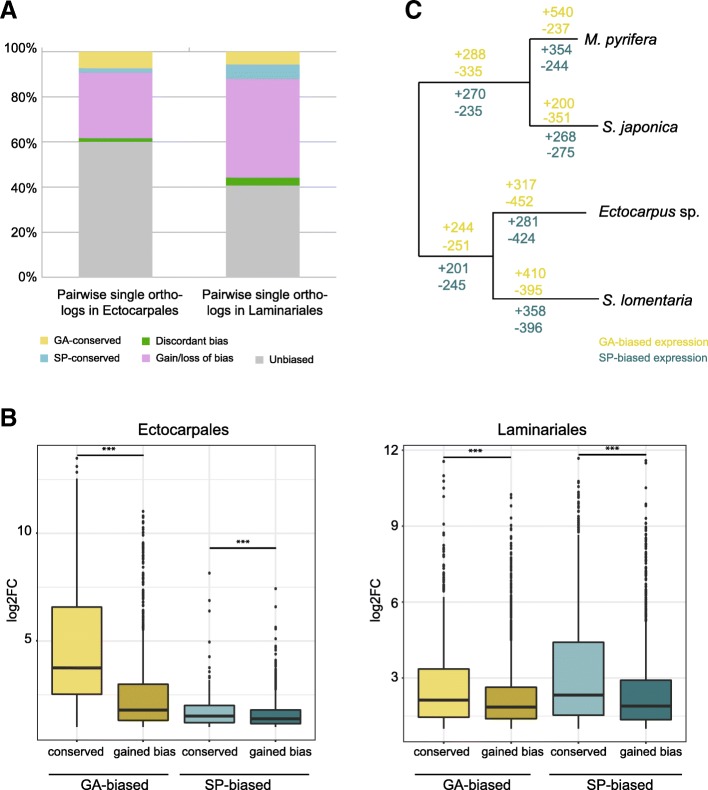
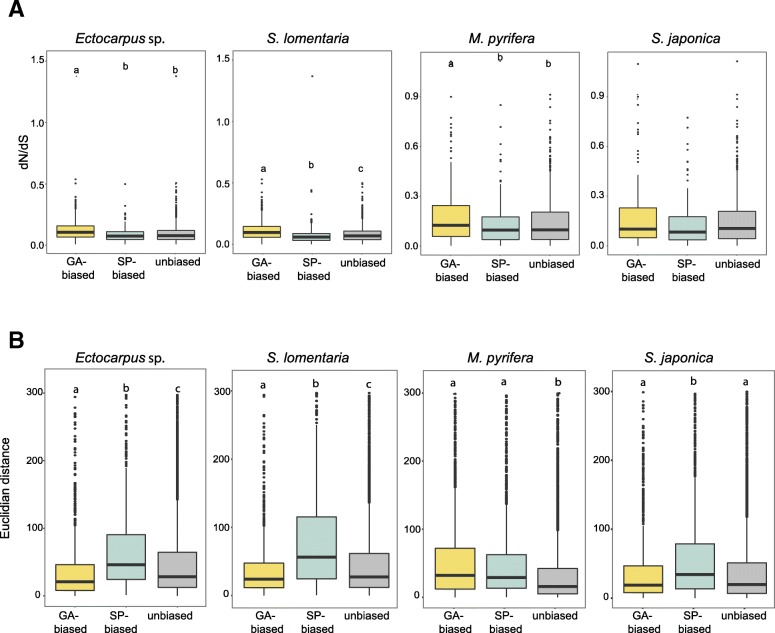
Results: We show that the proportion of the transcriptome that is generation-specific is broadly associated with the level of phenotypic dimorphism between the life cycle stages. Importantly, our data reveals a remarkably high turnover rate for life-cycle-related gene sets across the brown algae and highlights the importance not only of co-option of regulatory programs from one generation to the other but also of a role for newly emerged, lineage-specific gene expression patterns in the evolution of the gametophyte and sporophyte developmental programs in this major eukaryotic group. Moreover, we show that generation-biased genes display distinct evolutionary modes, with gametophyte-biased genes evolving rapidly at the coding sequence level whereas sporophyte-biased genes tend to exhibit changes in their patterns of expression.

Conclusion: Our analysis uncovers the characteristics, expression patterns, and evolution of generation-biased genes and underlines the selective forces that shape this previously underappreciated source of phenotypic diversity.


Conflict of interest statement

Ethics approval and consent to participate

Not applicable.

Competing interests

The authors declare that they have no competing interests.

Publisher’s Note

Springer Nature remains neutral with regard to jurisdictional claims in published maps and institutional affiliations.

Figures

Fig. 1
Fig. 1
Generation-biased gene expression across the four brown algal species. a Proportions of unbiased, gametophyte- and sporophyte-biased genes across the four studied species. Bar inserts represent the proportion of generation-specific genes among the generation-biased genes in each species. b Mean gene expression levels (log2TPM) at several degrees of generation bias (fold change, FC, represented by gray histograms) for gametophyte-biased (yellow) and sporophyte-biased (blue) genes in the four studied species. The number of genes in each category of FC is represented on the right side of the graph. Error bars represent standard errors. GA gametophyte, SP sporophyte. c Boxplot showing the mean expression levels (log2TPM) of gametophyte- and sporophyte-biased genes
Fig. 2
Fig. 2
OGs with generation-biased genes are poorly conserved across brown algal species and the generation-biased gene sets include many orphan genes. a Shared OGs with generation-biased genes across the four studied species. Venn diagrams representing the number of shared versus species-specific generation-biased OGs. Comparisons were made at several evolutionary distances. b Levels of generation-biased expression (log2 fold change) for generation-biased genes that are part of an orthogroup compared with orphan generation-biased genes. ***p value < 0.0001 (Wilcoxon test)
Fig. 3
Fig. 3
Conservation of generation-biased gene expression across species. a Numbers of ASOs showing unbiased, discordant bias, or different degrees of shared bias between the four studied species. GA gametophyte, SP sporophyte. b Hierarchical clustering and heatmap of gene expression for all the members of the 1:1:1:1 ortholog dataset with at least one generation-biased member in one of the studied species (Heatmap3 package, R). The dendogram was constructed using hierarchical clustering with 1000 bootstraps (pvclust package, R)
Fig. 4
Fig. 4
Conservation of generation bias across the Ectocarpales (Ectocarpus sp. and S. lomentaria) and Laminariales (S. japonica and M. pyrifera). a Pairwise single orthologs (PSOs) in Ectocarpales and Laminariales. Genes with conserved gametophyte (yellow) or sporophyte bias (blue) exhibited the same bias in the same generation in the two species. Genes with “discordant bias” (green) were gametophyte-biased in one species and sporophyte-biased in the other species. “Gain/loss of bias” genes (pink) were generation-biased in one species but not in the other species. Unbiased PSOs are shown in gray. b Overall level of generation-biased expression (log2FC) for PSOs that are conserved versus PSOs that gained bias in Ectocarpales and Laminariales. c Representations of generation-biased gene gain/loss events across the branches of the Ectocarpales and Laminariales phylogeny. Expected numbers of events are based on multiple stochastic mappings (see the “Methods” section for detail)
Fig. 5
Fig. 5
Evolution of generation-biased genes. a Evolutionary rates measured as dN/dS between species pairs (Ectocarpus sp./S. lomentaria, M. pyrifera/S. japonica) for unbiased, gametophyte-biased, and sporophyte-biased genes in the four brown algal species. b Gene expression divergence measured as Euclidean distances for unbiased, gametophyte-biased, and sporophyte-biased genes in each of the four brown algal species. Different letters above the plots indicate significant differences (pairwise Wilcoxon test; p value < 0.05)

References

    1. Coelho SM, Peters AF, Charrier B, Roze D, Destombe C, Valero M, et al. Complex life cycles of multicellular eukaryotes: new approaches based on the use of model organisms. Gene. 2007;406:152–170. doi: 10.1016/j.gene.2007.07.025. - DOI - PubMed
    1. Valero M, Richerd S, Perrot V, Destombe C. Evolution of alternation of haploid and diploid phases in life cycles. Trends Ecol Evol. 1992;7:25–29. doi: 10.1016/0169-5347(92)90195-H. - DOI - PubMed
    1. Arun A, Peters NT, Scornet D, Peters AF, Cock JM, Coelho SM. Non-cell autonomous regulation of life cycle transitions in the model brown alga Ectocarpus. New Phytol. 2013;197:503–510. doi: 10.1111/nph.12007. - DOI - PubMed
    1. Coelho SM, Godfroy O, Arun A, Le Corguillé G, Peters AF, Cock JM. OUROBOROS is a master regulator of the gametophyte to sporophyte life cycle transition in the brown alga Ectocarpus. Proc Natl Acad Sci U S A. 2011;108:11518–11523. doi: 10.1073/pnas.1102274108. - DOI - PMC - PubMed
    1. Perrot V, Richerd S, Valero M. Transition from haploidy to diploidy. Nature. 1991;351:315–317. doi: 10.1038/351315a0. - DOI - PubMed

Publication types