. 2019 Mar 20;101(6):1109-1116.e5.
doi: 10.1016/j.neuron.2019.01.019. Epub 2019 Feb 11.

Manipulation of Subcortical and Deep Cortical Activity in the Primate Brain Using Transcranial Focused Ultrasound Stimulation

Affiliations

Manipulation of Subcortical and Deep Cortical Activity in the Primate Brain Using Transcranial Focused Ultrasound Stimulation

Davide Folloni et al. Neuron. .

Abstract

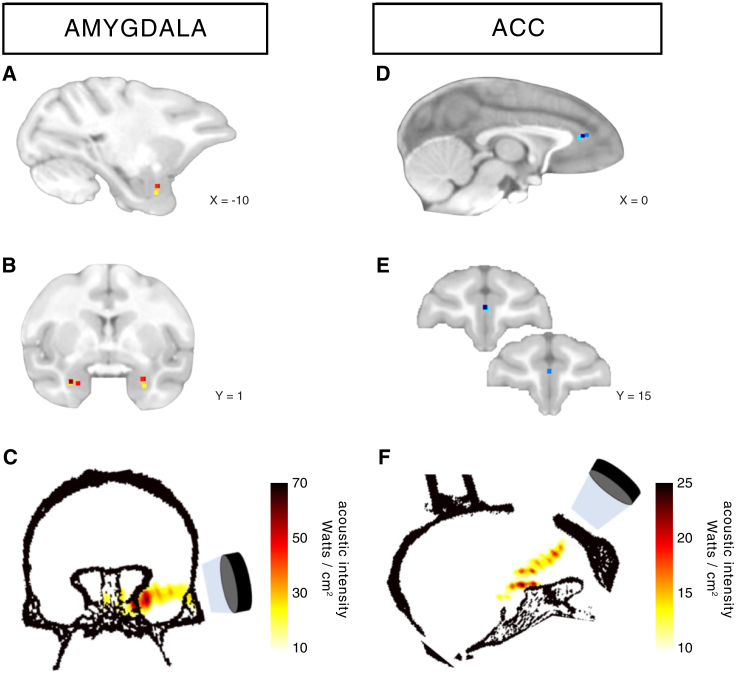
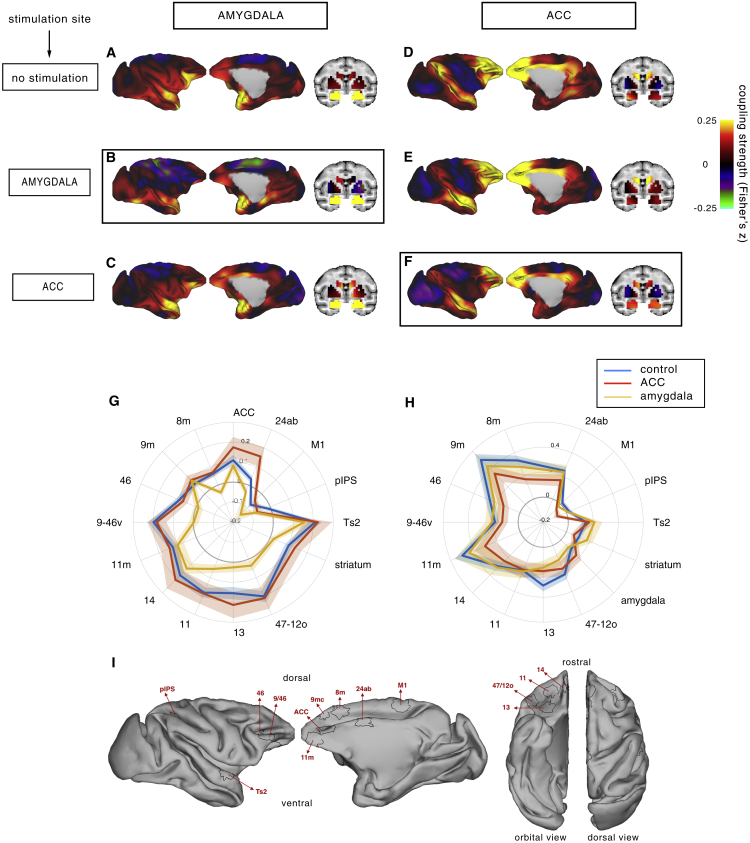
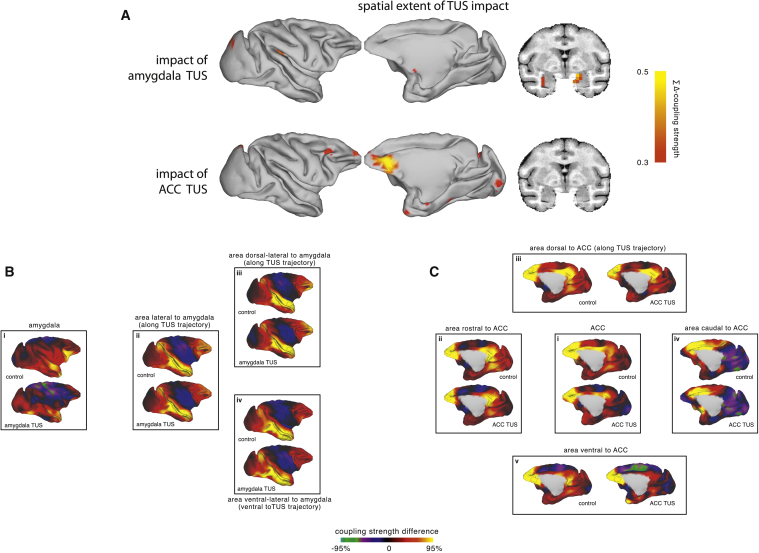
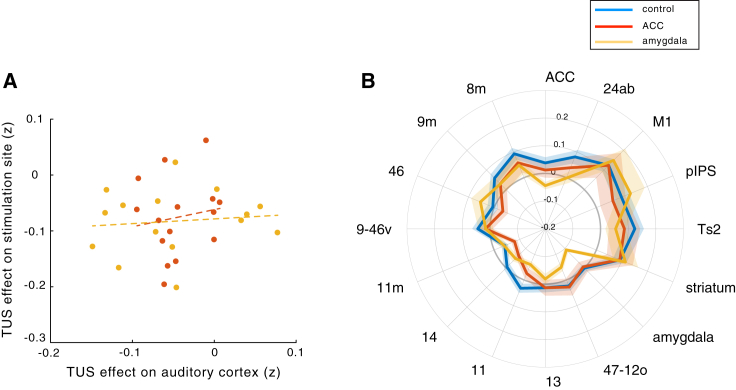
The causal role of an area within a neural network can be determined by interfering with its activity and measuring the impact. Many current reversible manipulation techniques have limitations preventing their application, particularly in deep areas of the primate brain. Here, we demonstrate that a focused transcranial ultrasound stimulation (TUS) protocol impacts activity even in deep brain areas: a subcortical brain structure, the amygdala (experiment 1), and a deep cortical region, the anterior cingulate cortex (ACC, experiment 2), in macaques. TUS neuromodulatory effects were measured by examining relationships between activity in each area and the rest of the brain using functional magnetic resonance imaging (fMRI). In control conditions without sonication, activity in a given area is related to activity in interconnected regions, but such relationships are reduced after sonication, specifically for the targeted areas. Dissociable and focal effects on neural activity could not be explained by auditory confounds.

Keywords: amygdala; cingulate cortex; functional connectivity; limbic; macaque monkey; neuromodulation; resting-state connectivity; transcranial stimulation; ultrasound.


Figures

Figure 1
Figure 1
Stimulation Targets (A–F) Stimulation target position is shown for each individual animal (colored dots) on sagittal and coronal views for TUS targeted at amygdala (A and B) and ACC (D and E). Acoustic intensity field (W/cm2) generated by the ultrasound beam in the brain is shown for one example animal per TUS target, amygdala (C) and ACC (F). The target position can be delineated with accuracy in all animals in (A), (B), (D), and (E) by using each individual’s own MRI scan. As a result, the activity and functional connectivity of the target areas can be examined accurately in each animal. However, some slight imprecision in the estimation in the acoustic intensity maps in (C) and (F) may occur; this is because group average targets are used in conjunction with the computed tomography X-ray scan of a single individual during the modeling.
Figure 2
Figure 2
Amygdala and ACC Functional Coupling Changes after Stimulation (A–C) Activity coupling between amygdala (in yellow on the coronal view) and the rest of the brain in the no stimulation (control) condition (A), after amygdala TUS (B), and after ACC TUS (C). (D–F) Activity coupling between ACC (outlined in black) and the rest of the brain in the no stimulation (control) condition (D), after amygdala TUS (E), and after ACC TUS (F). Hot colors indicate positive coupling (Fisher’s z). Functional connectivity from TUS-targeted regions is highlighted by black boxes. Each type of TUS had a selective effect on the stimulated area; amygdala coupling was strongly changed by amygdala TUS only (B), and ACC coupling was strongly changed by ACC TUS only (F). (G) Connectivity fingerprint representation of the strength of activity coupling between amygdala and other brain areas in control animals (blue), after amygdala TUS (yellow), and after ACC TUS (red). (H) Activity coupling between ACC and the rest of the brain in control animals (blue), after ACC TUS (red), and after amygdala TUS (yellow). Each type of TUS had a selective effect on the stimulated area; amygdala coupling was strongly affected by amygdala TUS (the yellow line is closer to the center of the panel than the blue line), and ACC coupling was strongly disrupted by ACC TUS (the red line is closer to the center of the panel than the blue line). SEM is indicated by shading around each line. (I) The regions of interest constituting the fingerprints depicted on lateral, medial, orbital, and dorsal views.
Figure 3
Figure 3
Spatial Extent of the TUS Neuromodulatory Effect and Its Impact on Areas Neighboring the Stimulated Region (A) Amplitude and spatial extent of the impact of amygdala TUS (top row) and ACC TUS (bottom row) on the coupling of each point in the brain with the same set of a-priori-defined areas used in Figures 2G and 2H. Hot colors indicate a strong decrement in coupling after TUS compared to the control state (summed delta Fisher’s z). The effect of TUS on activity coupling was restricted to the amygdala after amygdala TUS (top row) and to the ACC and regions immediately ventral along the ultrasound trajectory following ACC TUS (bottom row). (B) The whole-brain coupling of the amygdala target region (i, also shown in Figure 2) and regions along (ii and iii) or immediately surrounding the trajectory of the ultrasound stimulation beam (iv) in the control condition and after amygdala TUS. There were no major changes in the coupling of these off-target regions and the rest of the brain. (C) The whole-brain coupling of the ACC target region (i, also shown in Figure 2) and surrounding regions near the ACC target (ii–v) in both the ACC TUS and control conditions. Some changes in coupling can be seen along the stimulation trajectory in the area just ventral to the target (v) and also in an area that is unlikely to have been hit directly by the ultrasound beam (iv). These areas are strongly anatomically connected with the targeted area. Seed regions in (B) and (C) are indicated with black outlines.
Figure 4
Figure 4
Effect of Amygdala and ACC TUS on the Functional Coupling of Primary Auditory Cortex (A) ACC TUS (red line) had no effect on the functional coupling of A1. Amygdala TUS (yellow line) affected the relationship between A1’s activity and activity in several areas that are linked to the A1 via the amygdala, including the amygdala itself, lateral orbitofrontal cortex area 47/12o, and ACC. (B) Mediation via the auditory cortex cannot explain the effects seen after either amygdala (yellow) or ACC (red) TUS.

Comment in

  • Making waves with ultrasound.
    Bray N. Bray N. Nat Rev Neurosci. 2019 Apr;20(4):189. doi: 10.1038/s41583-019-0149-x. Nat Rev Neurosci. 2019. PMID: 30833705 No abstract available.

References

    1. Airan R.D., Butts Pauly K. Hearing out ultrasound neuromodulation. Neuron. 2018;98:875–877. - PubMed
    1. Amaral D.G., Price J.L. Amygdalo-cortical projections in the monkey (Macaca fascicularis) J. Comp. Neurol. 1984;230:465–496. - PubMed
    1. Constans C., Deffieux T., Pouget P., Tanter M., Aubry J.-F. A 200-1380-kHz quadrifrequency focused ultrasound transducer for neurostimulation in rodents and primates: transcranial in vitro calibration and numerical study of the influence of skull cavity. IEEE Trans. Ultrason. Ferroelectr. Freq. Control. 2017;64:717–724. - PubMed
    1. Dallapiazza R.F., Timbie K.F., Holmberg S., Gatesman J., Lopes M.B., Price R.J., Miller G.W., Elias W.J. Noninvasive neuromodulation and thalamic mapping with low-intensity focused ultrasound. J. Neurosurg. 2018;128:875–884. - PMC - PubMed
    1. Deffieux T., Younan Y., Wattiez N., Tanter M., Pouget P., Aubry J.-F. Low-intensity focused ultrasound modulates monkey visuomotor behavior. Curr. Biol. 2013;23:2430–2433. - PubMed

Publication types