. 2019 Mar 4;216(3):638-655.
doi: 10.1084/jem.20181444. Epub 2019 Feb 14.

The transcription factor Duxbl mediates elimination of pre-T cells that fail β-selection

Affiliations

The transcription factor Duxbl mediates elimination of pre-T cells that fail β-selection

Fabian Klein et al. J Exp Med. .

Abstract

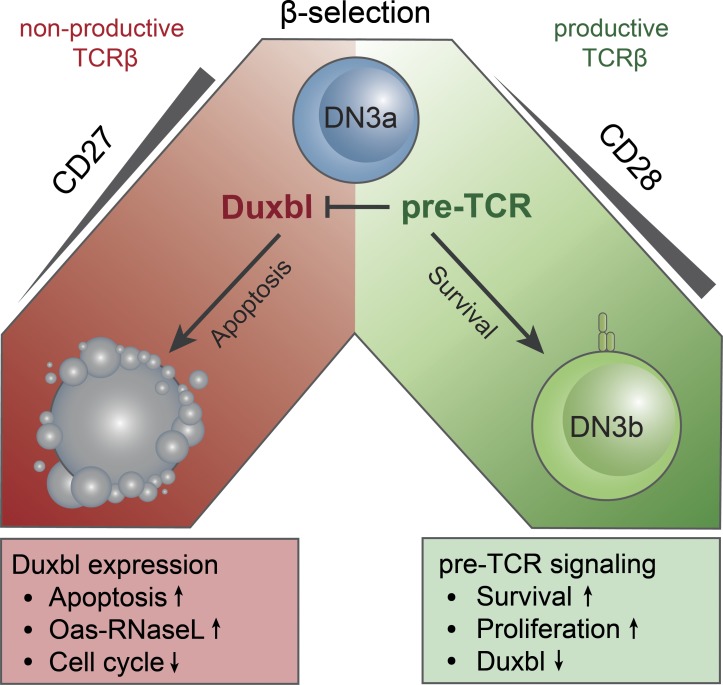
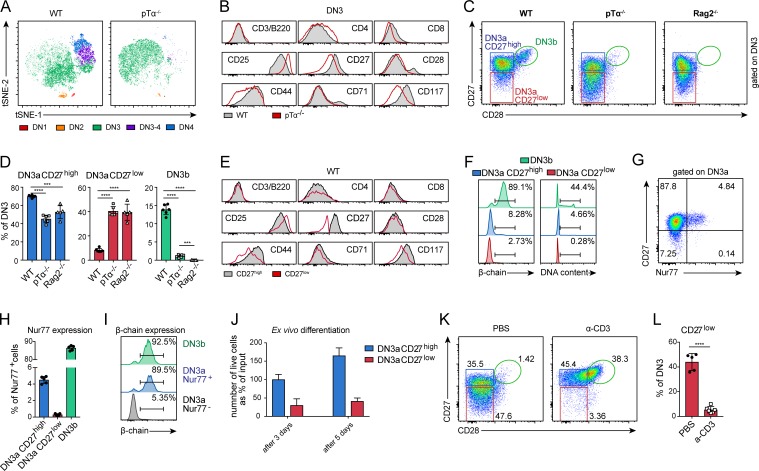
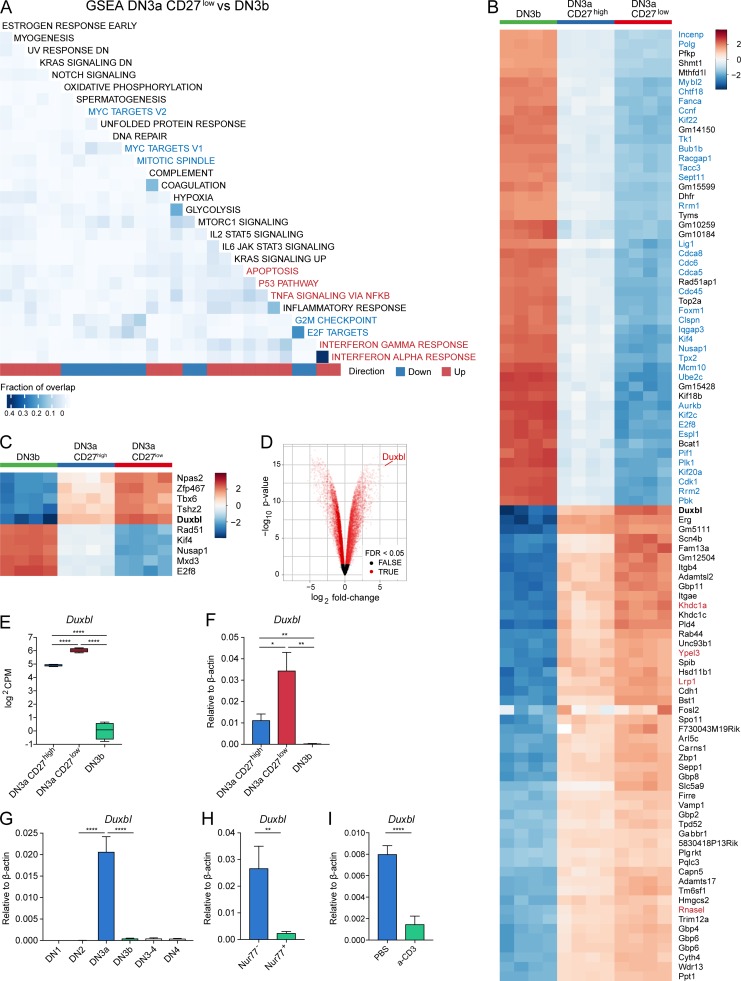
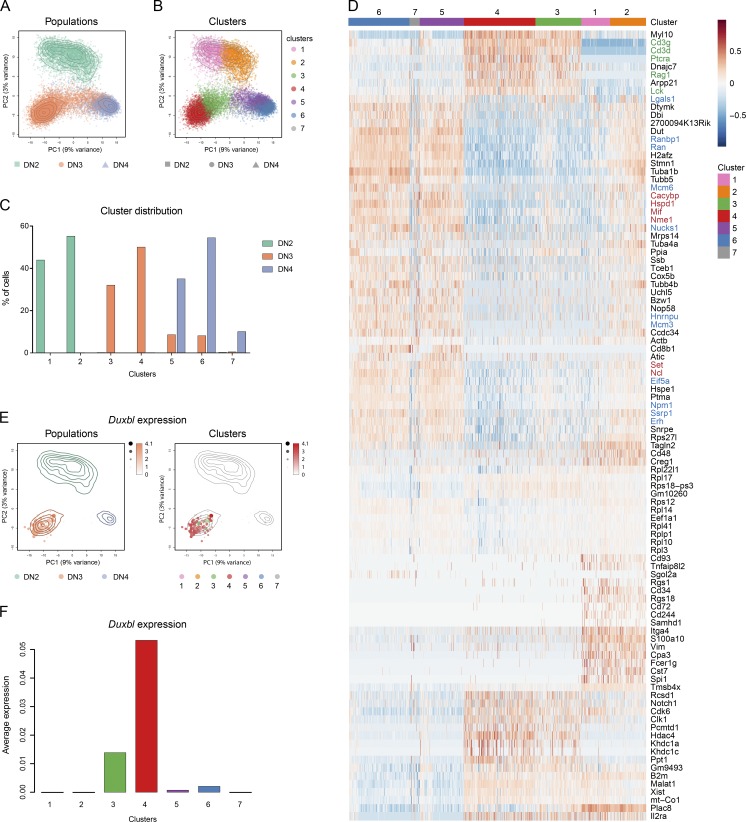
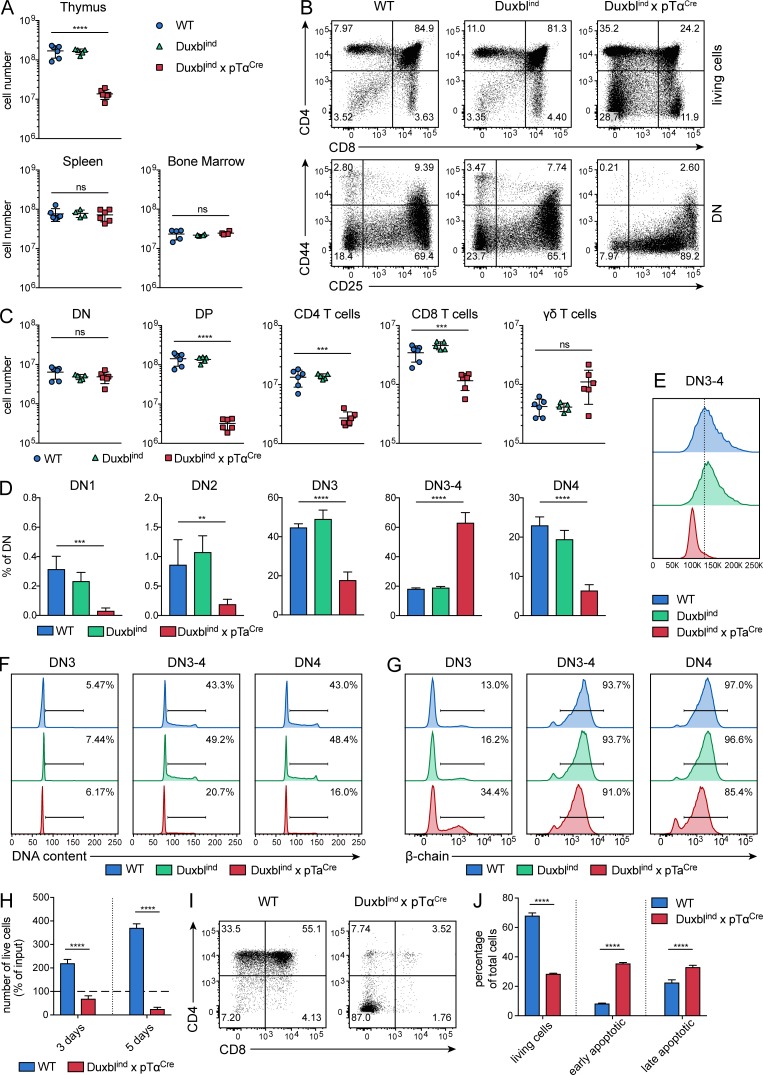
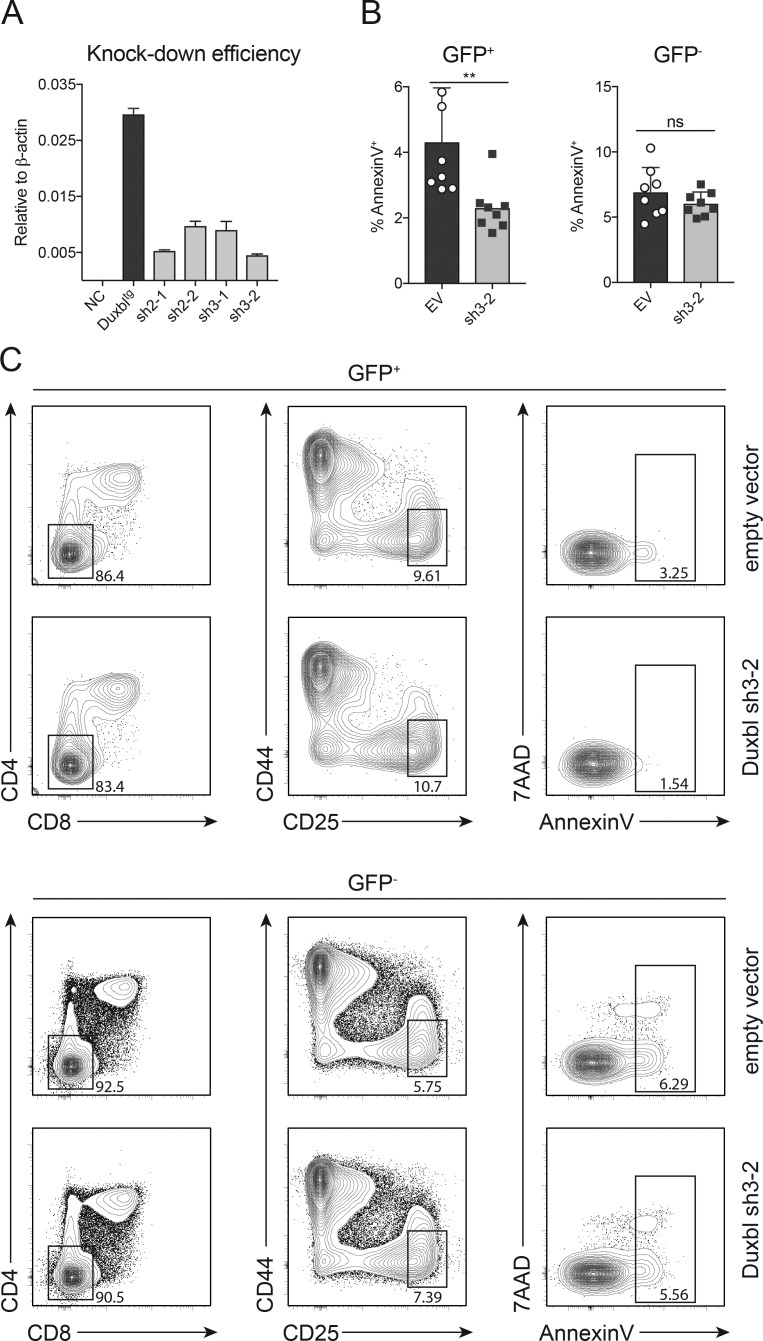
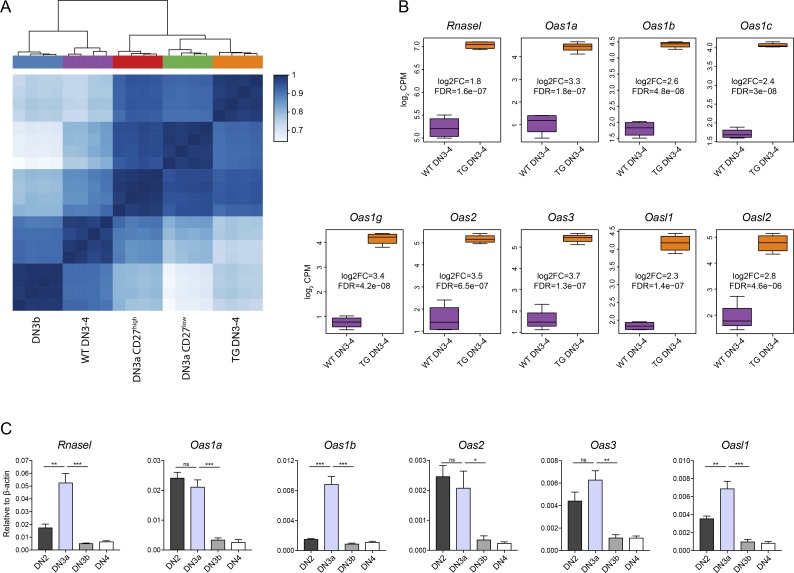
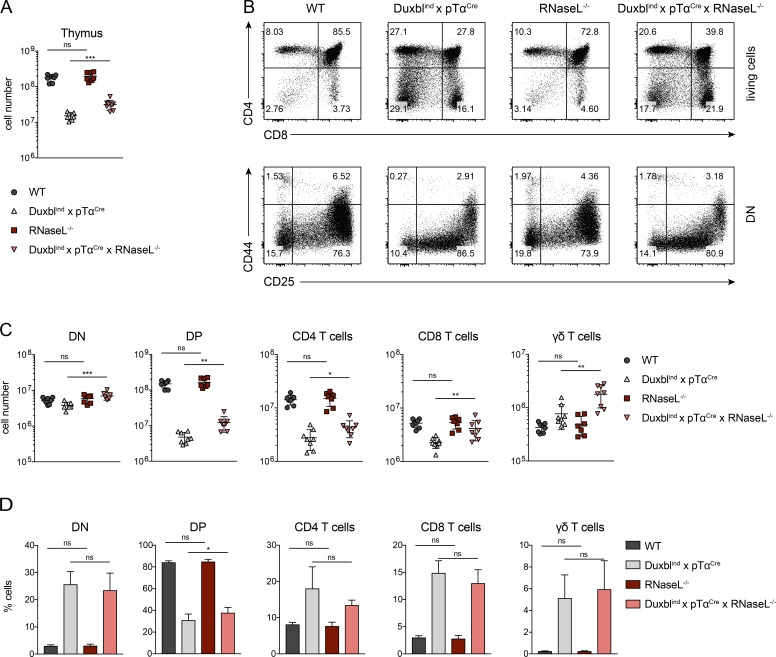
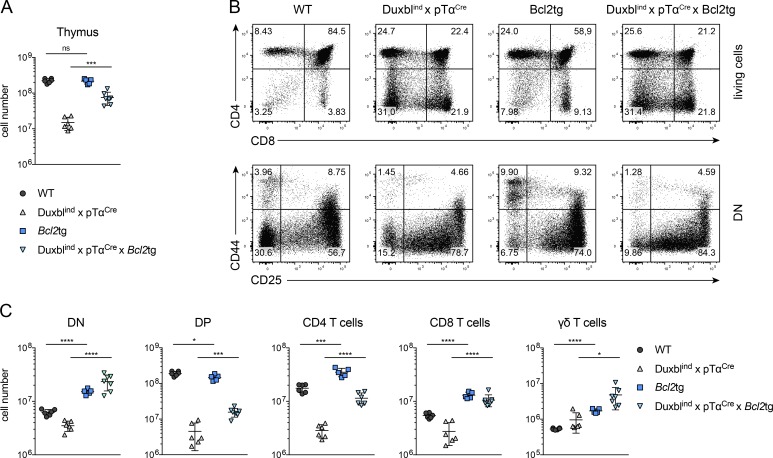
T cell development is critically dependent on successful rearrangement of antigen-receptor chains. At the β-selection checkpoint, only cells with a functional rearrangement continue in development. However, how nonselected T cells proceed in their dead-end fate is not clear. We identified low CD27 expression to mark pre-T cells that have failed to rearrange their β-chain. Expression profiling and single-cell transcriptome clustering identified a developmental trajectory through β-selection and revealed specific expression of the transcription factor Duxbl at a stage of high recombination activity before β-selection. Conditional transgenic expression of Duxbl resulted in a developmental block at the DN3-to-DN4 transition due to reduced proliferation and enhanced apoptosis, whereas RNA silencing of Duxbl led to a decrease in apoptosis. Transcriptome analysis linked Duxbl to elevated expression of the apoptosis-inducing Oas/RNaseL pathway. RNaseL deficiency or sustained Bcl2 expression led to a partial rescue of cells in Duxbl transgenic mice. These findings identify Duxbl as a regulator of β-selection by inducing apoptosis in cells with a nonfunctional rearrangement.


Figures

None
Graphical abstract
Figure 1.
Figure 1.
CD27 down-regulation marks cells failing β-selection. (A) tSNE-based comparison of pTα−/− and WT DN cells using the surface markers CD3/B220, CD4, CD8, CD25, CD27, CD28, CD44, CD71, and CD117. DN stages were identified by FACS as shown in Fig. S1. (B) Histograms of markers used in A of WT and pTα−/− DN3 cells. (A and B) Two independent experiments were performed, with representative data from one experiment shown. (C) Representative FACS plots for the separation of DN3 cells in pTα−/−, Rag2−/−, and WT mice using CD27 and CD28 expression. Three independent experiments were performed, with representative data from one experiment shown. (D) Frequencies of DN3a CD27high (left), DN3a CD27low (middle), and DN3b (right) cells as percentage of DN3 in WT (n = 6), pTα−/− (n = 6), and Rag2−/− (n = 5) mice. Data were collected from three independent experiments. (E) Histograms of markers used in A of WT DN3a CD27high and DN3a CD27low cells. Three independent experiments were performed, with representative data from one experiment shown. (F) Representative histograms showing intracellular β-chain expression (left) or DNA content (right) of WT DN3a CD27low, DN3a CD27high, and DN3b cells. Three independent experiments were performed, with representative data from one experiment shown. (G) Representative FACS plot of Nur77 expression in CD27high and CD27low DN3a cells in Nur77GFP mice. Three independent experiments were performed, with representative data from one experiment shown. (H) Frequencies of Nur77+ cells within the DN3a CD27high or CD27low and DN3b population (n = 5). Data were collected from three independent experiments. (I) Representative histograms showing intracellular β-chain expression in Nur77 or Nur77+ DN3a and DN3b cells. Two independent experiments were performed, with representative data from one experiment shown. (J) Numbers of sorted WT DN3a CD27high and DN3a CD27low cells as percentage of input after 3 and 5 d of culture in wells coated with Dll4 and supplemented with Cxcl12. Two independent experiments were performed, with representative data from one experiment shown. (K) Representative FACS plots of CD27 and CD28 expression in pTα−/− DN3 cells 1 d after intraperitoneal injection of 100 µg anti-CD3ε antibodies or PBS. Three independent experiments were performed, with representative data from one experiment shown. (L) Frequency of DN3a CD27low cells as percentage of DN3 in pTα−/− mice 1 d after intraperitoneal injection of 100 µg anti-CD3ε antibodies (n = 6) or PBS (n = 5). Data were collected from three independent experiments. Gate numbers in FACS plots and histograms indicate frequencies of parent gate. Statistical analysis was done with two-tailed unpaired Student’s t test. ***, P < 0.001; ****, P < 0.0001. Error bars indicate standard deviation.
Figure 2.
Figure 2.
Transcriptome comparison reveals specific up-regulation of the transcription factor Duxbl in DN3a CD27low cells. (A–C) Bulk RNA-seq of DN3a CD27high, DN3a CD27low, and DN3b cells, performed as described in Materials and methods. (A) Heat map illustrating the results of the gene set enrichment analysis (GSEA) of DN3a CD27low versus DN3b cells using gene sets from the hallmark collection of the Molecular Signature Database. Only sets containing >10 genes and with a false discovery rate (FDR) <5% are illustrated. The fraction of genes overlapping across gene sets is indicated by the color intensity on the heat map. Down-regulated hallmark signatures related to cell cycle/division and DNA replication are highlighted with blue font, and up-regulated ones related to apoptosis pathways in red font. (B) Heat map displaying the centered gene expression levels of the top 50 significantly overexpressed genes and top 50 significantly underexpressed genes in DN3a CD27low compared with DN3b cells. Genes are clustered using hierarchical clustering, but the dendrogram is not displayed. Duxbl is marked in bold font. The color gradient illustrates the normalized log2CPM values centered across all samples for each gene. (C) Heat map displaying the centered gene expression levels of the top 10 transcription factors (i.e., annotated to Gene Ontology category GO:0003677) with the highest absolute fold change among differentially expressed genes (FDR <0.05) between DN3a CD27low and DN3b cells. Duxbl is marked in bold font. The color gradient illustrates the normalized log2CPM values centered across all samples for each gene. (D) Volcano plot of differentially expressed genes between DN3a CD27low and DN3b cells. Genes with an FDR <0.05 are marked in red, and genes with an FDR >0.05 in black. (E and F) Normalized log2CPM obtained from the bulk RNA-seq (E) and relative expression obtained by qPCR (F) of Duxbl in DN3a CD27high, DN3a CD27low, and DN3b cells. (G) Relative expression of Duxbl in DN1, DN2, DN3a, DN3b, DN3-4, and DN4 cells. (H) Relative expression of Duxbl in Nur77 and Nur77+ DN3a CD27high cells isolated from Nur77GFP mice. (I) Relative expression of Duxbl in DN3 cells isolated from pTα−/− mice 1 d after intraperitoneal injection of 100 µg anti-CD3ε antibodies (n = 7) or PBS (n = 5). As housekeeping gene, β-actin was used. Data were collected from four (G and H) or three (F and I) independent experiments. DN stages were identified by FACS as shown in Fig. S1. Statistical analysis was done with two-tailed unpaired Student’s t test. *, P < 0.05; **, P < 0.01; ****, P < 0.0001. Error bars indicate standard deviation.
Figure 3.
Figure 3.
Single-cell RNA-seq elucidates a developmental trajectory through β-selection. Single-cell RNA-seq of DN2, DN3, and DN4 cells, performed as described in the Materials and methods. (A and B) PCA based on the 500 most variable genes across all cells. The colors represent cells from the different populations (A) or the different clusters (B). Contour lines indicate the density of the DN2, DN3, and DN4 cells in the PCA space. (C) Relative frequency of DN2, DN3, and DN4 cells within the different clusters. (D) Heat map displaying the centered and scaled expression across the 18,128 cells of the top cluster-specific genes (resulting from the union of the top 23 differentially expressed genes from each pairwise comparison between clusters). The color gradient illustrates the normalized log-count values centered and scaled across all samples for each gene. Colors at the top indicate the membership of cells to the different clusters. Font colors indicate genes involved in recombination and pre-TCR (green), cell cycle/division and DNA replication (blue), and negative regulation of apoptosis (red). (E) Expression of Duxbl shown in the PCA space. Size and color intensity of the dots indicate relative expression level of Duxbl in each cell, and the colors correspond to the respective population (left) or cluster (right). (F) Bar plot showing the average normalized log-counts of Duxbl across all cells from each cluster.
Figure 4.
Figure 4.
Blocked T cell development in DuxblindxpTαCre mice. (A) Total numbers of live, nucleated cells in the thymus, spleen, and bone marrow of WT (n = 6), Duxblind (n = 5), and DuxblindxpTαCre (n = 6) mice. Data were collected from three independent experiments. (B) Representative FACS plots of CD4 and CD8 expression in total live cells (top) and CD44 and CD25 expression in DN cells (bottom) of WT, Duxblind, and DuxblindxpTαCre mice. DN cells were gated as CD4, CD8, CD3, and B220 negative. Three independent experiments were performed, with representative data from one experiment shown. (C) Numbers of DN, DP, CD4 T cells, CD8 T cells, and γδ-T cells in WT (n = 6), Duxblind (n = 5), and DuxblindxpTαCre (n = 6) mice. (D) Frequencies of DN1, DN2, DN3, DN3-4, and DN4 cells as percentage of DN cells in WT (n = 6), Duxblind (n = 5), and DuxblindxpTαCre (n = 6) mice. (C and D) Data were collected from three independent experiments. (E) Representative histogram showing the size (FSC-A) of DN3-4 cells in WT, Duxblind, and DuxblindxpTαCre mice. Three independent experiments were performed, with representative data from one experiment shown. (F and G) Histograms showing the DNA content (F) and intracellular β-chain expression (G) of DN3, DN3-4, and DN4 cells in WT, Duxblind, and DuxblindxpTαCre mice. Four independent experiments were performed, with representative data from one experiment shown. (H) Numbers of sorted DN3 cells from WT and DuxblindxpTαCre mice as percentage of input after 3 and 5 d of culture in wells coated with Dll 4 and supplemented with Cxcl12. (I) Representative FACS plots of sorted DN3 cells from WT and DuxblindxpTαCre mice showing CD4 and CD8 expression after 5 d of culture. (J) Frequencies of living, early apoptotic, and late apoptotic cells after 3 d of culture of sorted DN3 cells from WT and DuxblindxpTαCre mice. Living cells were defined as annexinV 7AAD, early apoptotic cells as annexinV+ 7AAD, and late apoptotic cells as annexinV+ 7AAD+. (H–J) Three independent experiments were performed, with representative data from one experiment shown. Gate numbers in FACS plots and histograms indicate frequencies of parent gate. DN stages were identified by FACS as shown in Fig. S1. Statistical analysis was done with two-tailed unpaired Student’s t test. **, P < 0.01; ***, P < 0.001; ****, P < 0.0001; ns, not significant. Error bars indicate standard deviation.
Figure 5.
Figure 5.
Decreased apoptosis in DN3 cells after Duxbl knockdown. (A) Knockdown efficiency of four different shRNAs illustrated by relative expression of Duxbl in the 40E1 cell line overexpressing Duxbl with or without additional transduction of the described shRNAs. As housekeeping gene, β-actin was used. Two independent experiments were performed, with representative data from one experiment shown. (B) Frequencies of annexinV+ cells within GFP+ (left) or GFP (right) cells transduced with an empty vector control or shRNA 3–2 4 d after removal of IL-7 from the fetal liver OP9-Dll1 cultures. Data were collected from three independent experiments. (C) Representative FACS plots showing CD4 and CD8 expression (left), CD44 and CD25 expression within DN (middle), and annexinV and 7AAD levels within DN3 cells (right) 4 d after removal of IL-7 from the fetal liver OP9-Dll1 cultures. Plots were gated either on GFP+ or GFP cells. Three independent experiments were performed, with representative data from one experiment shown. Gate numbers in FACS plots indicate frequencies of parent gate. Statistical analysis was done with two-tailed unpaired Student’s t test. **, P < 0.01. Error bars indicate standard deviation.
Figure 6.
Figure 6.
Gene expression analysis identifies up-regulation of the Oas/RNaseL system in Duxbl transgenic DN3-4 cells. (A and B) Bulk RNA-seq of WT and DuxblindxpTαCre DN3-4 cells, performed as described in the Materials and methods. (A) Heat map and hierarchical clustering based on the matrix of Spearman correlation across the samples of WT and TG (derived from DuxblindxpTαCre mice) DN3-4 cells together with WT DN3a CD27high, DN3a CD27low, and DN3b cells (using the 25% most variable genes). Data were corrected for batch effects across datasets. (B) Boxplots showing the normalized log2CPM of Rnasel, Oas1a, Oas1b, Oas1c, Oas1g, Oas2, Oas3, Oasl1, and Oasl2 in WT and TG (derived from DuxblindxpTαCre mice) DN3-4 cells. Log2 FC and false discovery rate (FDR) are indicated for each gene. (C) Relative expression of Rnasel, Oas1a, Oas1b, Oas2, Oas3, and Oasl1 in WT DN2, DN3a, DN3b, and DN4 cells. As housekeeping gene, β-actin was used. Data were collected from four independent experiments. Statistical analysis was done with two-tailed unpaired Student’s t test. *, P < 0.05; **, P < 0.01; ***, P < 0.001, ns, not significant. Error bars indicate standard deviation (B) or standard error of the mean (C).
Figure 7.
Figure 7.
Disruption of the Oas/RNaseL system in DuxblindxpTαCre mice extenuates the perturbed T cell development. (A) Total number of live, nucleated cells in the thymus of WT (n = 8), DuxblindxpTαCre (n = 8), RNaseL−/− (n = 7), and DuxblindxpTαCrexRNaseL−/− (n = 8) mice. Data were collected from four independent experiments. (B) Representative FACS plots of CD4 and CD8 expression in total live cells (top) and CD44 and CD25 expression in DN cells (bottom) of WT, DuxblindxpTαCre, RNaseL−/−, and DuxblindxpTαCrexRNaseL−/− mice. DN cells were gated as CD4, CD8, CD3, and B220 negative. Four independent experiments were performed, with representative data from one experiment shown. (C) Numbers of DN, DP, CD4 T cells, CD8 T cells, and γδ-T cells in WT (n = 8), DuxblindxpTαCre (n = 8), RNaseL−/− (n = 7), and DuxblindxpTαCrexRNaseL−/− (n = 8) mice. (D) Frequencies of DN, DP, CD4 T cells, CD8 T cells, and γδ-T cells in WT (n = 8), DuxblindxpTαCre (n = 8), RNaseL−/− (n = 7), and DuxblindxpTαCrexRNaseL−/− (n = 8) mice. (C and D) Data were collected from four independent experiments. Gate numbers in FACS plots indicate frequencies of parent gate. DN stages were identified by FACS as shown in Fig. S1. Statistical analysis was done with two-tailed unpaired Student’s t test. *, P < 0.05; **, P < 0.01; ***, P < 0.001; ns, not significant. Error bars indicate standard deviation.
Figure 8.
Figure 8.
Transgenic Bcl2 expression restores T cell populations in DuxblindxpTαCre mice. (A) Total number of live, nucleated cells in the thymus of WT (n = 6), DuxblindxpTαCre (n = 6), Bcl2tg (n = 5), and DuxblindxpTαCrexBcl2tg (n = 7) mice. Data were collected from four independent experiments. (B) Representative FACS plots of CD4 and CD8 expression in total live cells (top) and CD44 and CD25 expression in DN cells (bottom) of WT, DuxblindxpTαCre, Bcl2tg, and DuxblindxpTαCrexBcl2tg mice. DN cells were gated as CD4, CD8, CD3, and B220 negative. Four independent experiments were performed, with representative data from one experiment shown. (C) Numbers of DN, DP, CD4 T cells, CD8 T cells, and γδ-T cells in WT (n = 6), DuxblindxpTαCre (n = 6), Bcl2tg (n = 5), and DuxblindxpTαCrexBcl2tg (n = 7) mice. Data were collected from four independent experiments. Gate numbers in FACS plots indicate frequencies of parent gate. DN stages were identified by FACS as shown in Fig. S1. Statistical analysis was done with two-tailed unpaired Student’s t test. *, P < 0.05; ***, P < 0.001; ****, P < 0.0001. Error bars indicate standard deviation.

References

    1. Akashi K., Kondo M., von Freeden-Jeffry U., Murray R., and Weissman I.L.. 1997. Bcl-2 rescues T lymphopoiesis in interleukin-7 receptor-deficient mice. Cell. 89:1033–1041. 10.1016/S0092-8674(00)80291-3 - DOI - PubMed
    1. Balciunaite G., Ceredig R., Fehling H.J., Zúñiga-Pflücker J.C., and Rolink A.G.. 2005a The role of Notch and IL-7 signaling in early thymocyte proliferation and differentiation. Eur. J. Immunol. 35:1292–1300. 10.1002/eji.200425822 - DOI - PubMed
    1. Balciunaite G., Ceredig R., and Rolink A.G.. 2005b The earliest subpopulation of mouse thymocytes contains potent T, significant macrophage, and natural killer cell but no B-lymphocyte potential. Blood. 105:1930–1936. 10.1182/blood-2004-08-3087 - DOI - PubMed
    1. Bell J.J., and Bhandoola A.. 2008. The earliest thymic progenitors for T cells possess myeloid lineage potential. Nature. 452:764–767. 10.1038/nature06840 - DOI - PubMed
    1. Brekelmans P., van Soest P., Voerman J., Platenburg P.P., Leenen P.J., and van Ewijk W.. 1994. Transferrin receptor expression as a marker of immature cycling thymocytes in the mouse. Cell. Immunol. 159:331–339. 10.1006/cimm.1994.1319 - DOI - PubMed

Publication types

MeSH terms

Substances