. 2019 Mar 5;116(10):4307-4315.
doi: 10.1073/pnas.1810070116. Epub 2019 Feb 14.

Concentric organization of A- and B-type lamins predicts their distinct roles in the spatial organization and stability of the nuclear lamina

Affiliations

Concentric organization of A- and B-type lamins predicts their distinct roles in the spatial organization and stability of the nuclear lamina

Bruce Nmezi et al. Proc Natl Acad Sci U S A. .

Abstract

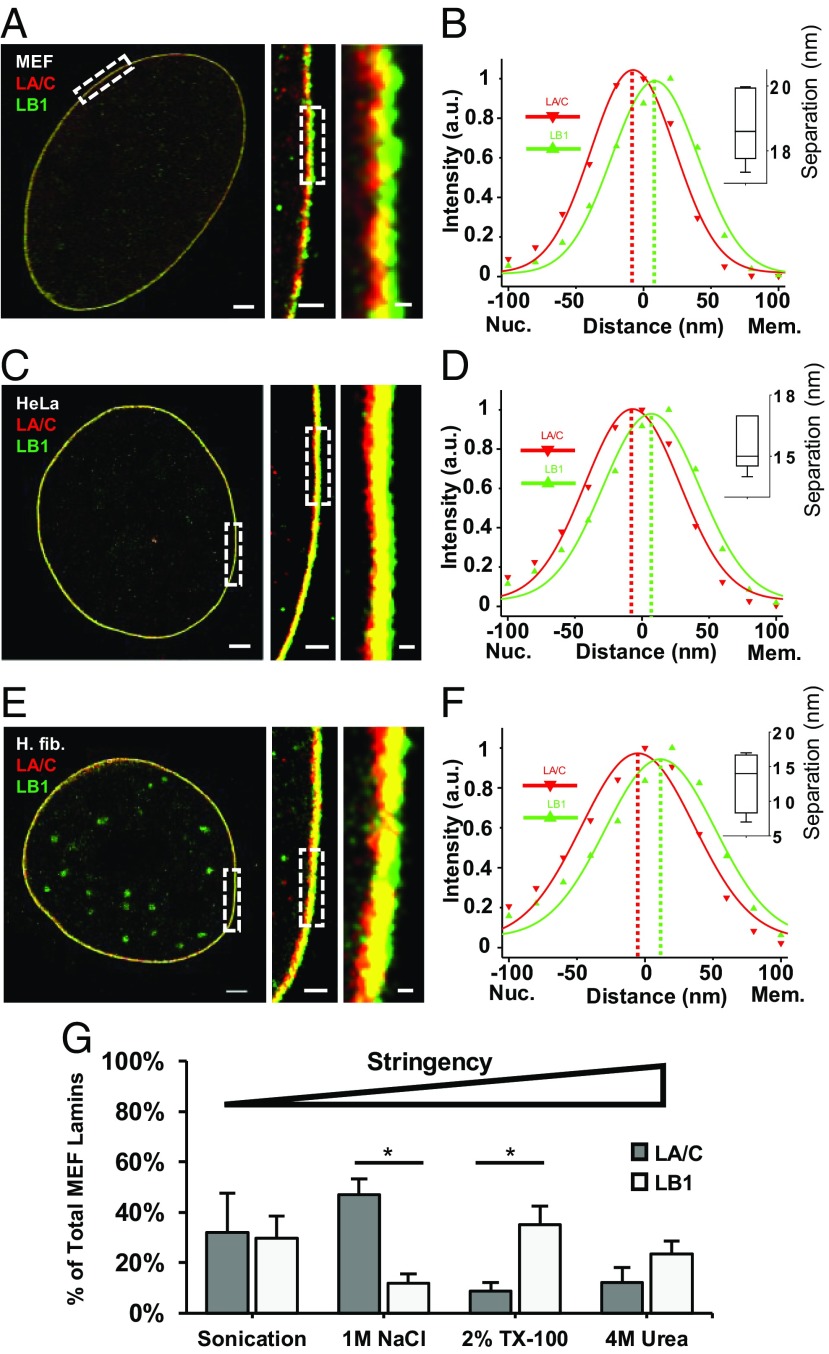
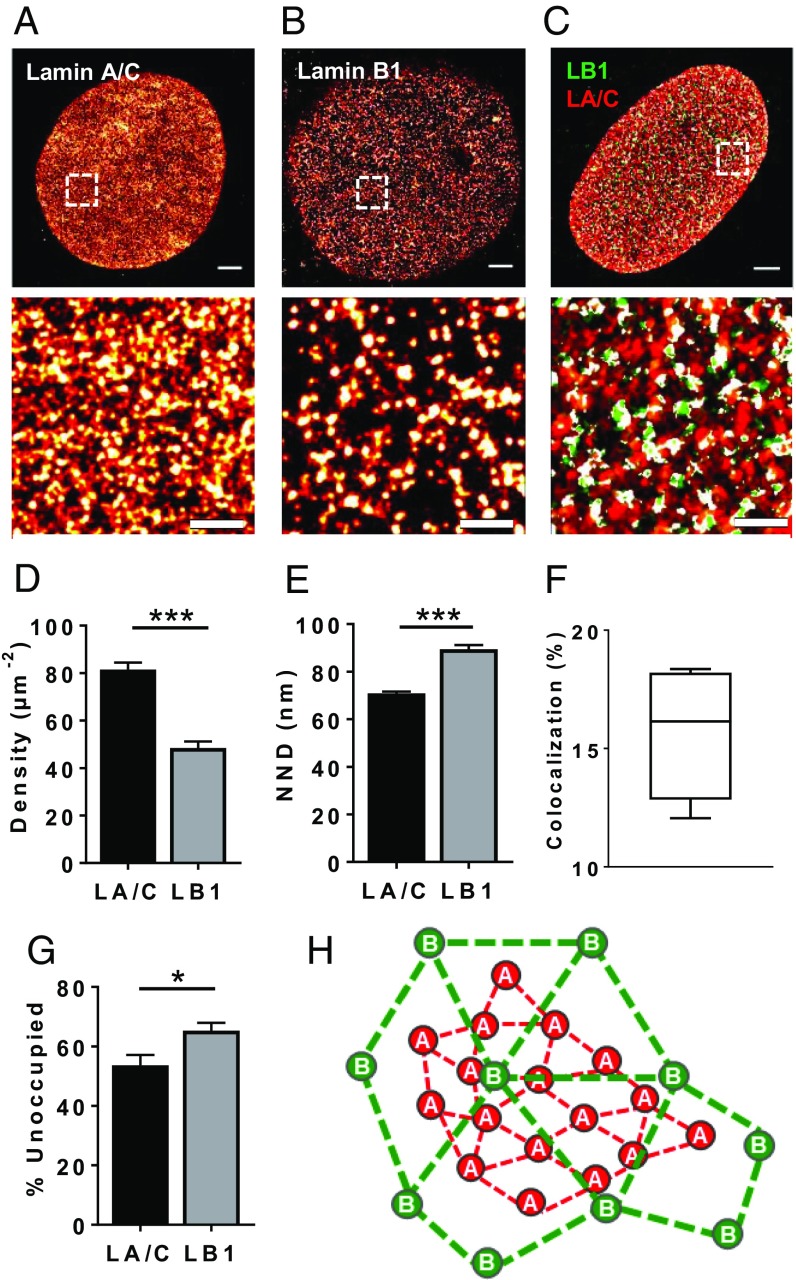
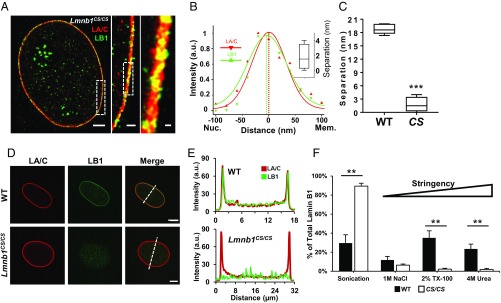
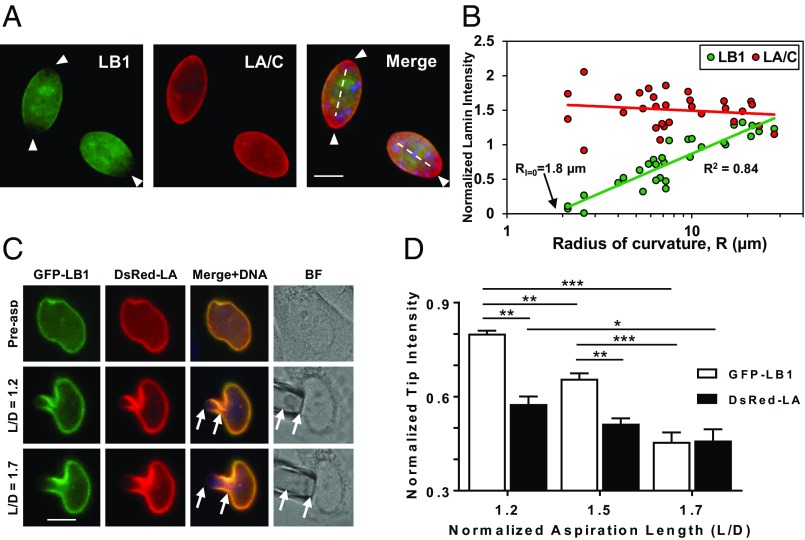
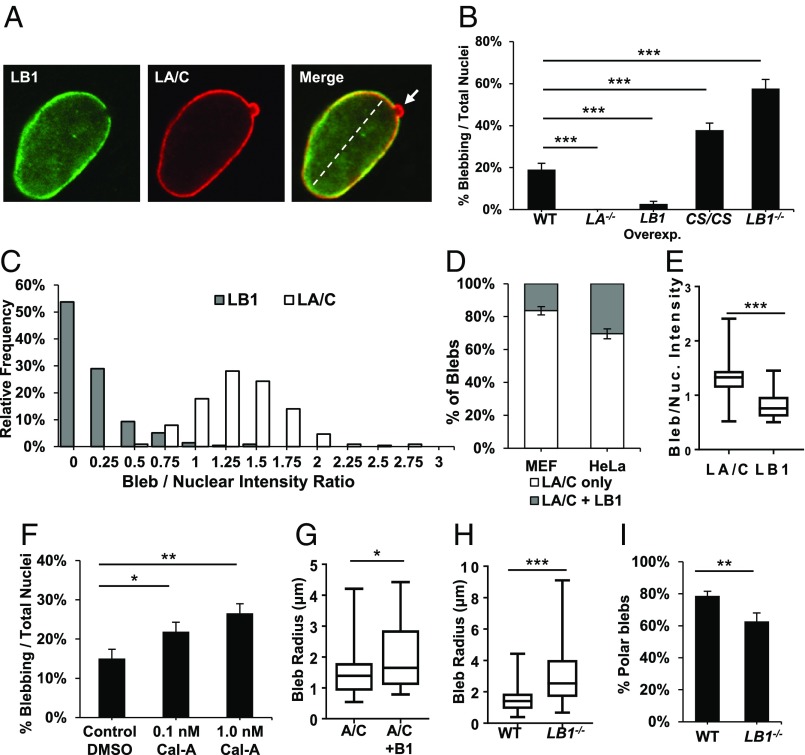
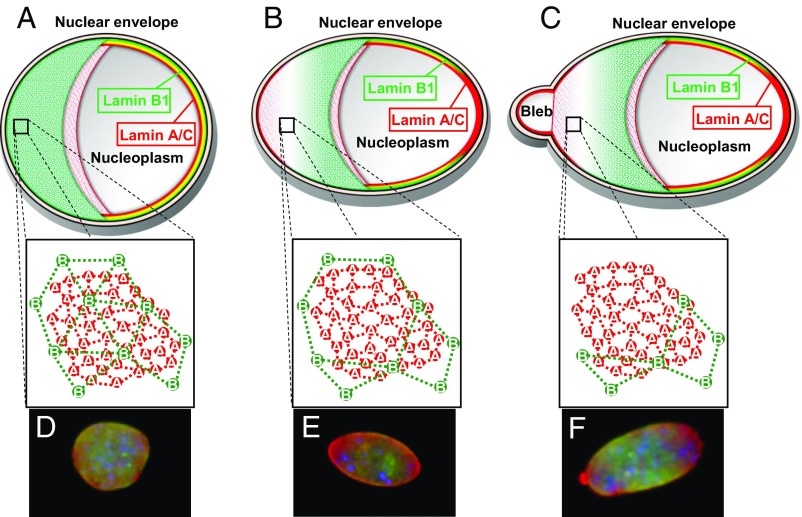
The nuclear lamina is an intermediate filament meshwork adjacent to the inner nuclear membrane (INM) that plays a critical role in maintaining nuclear shape and regulating gene expression through chromatin interactions. Studies have demonstrated that A- and B-type lamins, the filamentous proteins that make up the nuclear lamina, form independent but interacting networks. However, whether these lamin subtypes exhibit a distinct spatial organization or whether their organization has any functional consequences is unknown. Using stochastic optical reconstruction microscopy (STORM) our studies reveal that lamin B1 and lamin A/C form concentric but overlapping networks, with lamin B1 forming the outer concentric ring located adjacent to the INM. The more peripheral localization of lamin B1 is mediated by its carboxyl-terminal farnesyl group. Lamin B1 localization is also curvature- and strain-dependent, while the localization of lamin A/C is not. We also show that lamin B1's outer-facing localization stabilizes nuclear shape by restraining outward protrusions of the lamin A/C network. These two findings, that lamin B1 forms an outer concentric ring and that its localization is energy-dependent, are significant as they suggest a distinct model for the nuclear lamina-one that is able to predict its behavior and clarifies the distinct roles of individual nuclear lamin proteins and the consequences of their perturbation.

Keywords: bleb; curvature; lamin; meshwork; nucleus.


Conflict of interest statement

The authors declare no conflict of interest.

Figures

Fig. 1.
Fig. 1.
Spatially distinct localization and differential membrane binding of lamin B1 and lamin A/C. (A, C, and E) STORM images of immunofluorescently labeled lamin B1 (green) and lamin A/C (red) nuclear proteins in MEF (A), HeLa (C), and human fibroblast (E) nuclei at their equatorial planes. (Scale bar: 2 μm.) Rectangles denote Inset zoomed areas. (Inset scale bars: 500 and 100 nm.) (B, D, and F) Fluorescence-intensity profile plots across the nuclear envelopes in STORM images. x axis, distance (nm). Zero distance denotes center of nuclear lamina y axis: intensity (arbitrary units). (Inset) Box-and-whisker plot of separation (nm) between lamin A/C and B1 fluorescent-intensity peaks (n = 5 nuclei). (G) Quantification of fractional amount of nuclear lamin proteins solubilized in increasingly stringent sequential extractions in WT MEFs. Graph represents fraction of total lamin B1 and lamin A/C signal in each extraction from three independent experiments. Bars, means ± SEM. *P ≤ 0.05 (unpaired two-tailed t test).
Fig. 2.
Fig. 2.
Lamin B1 and A/C have meshworks with distinct structural characteristics. (AC) STORM images at the bottom nuclear surfaces of WT MEFs immunolabeled separately against lamin A/C (A), lamin B1 (B), or dual-color immunolabeled against lamin A/C (red) and lamin B1 (green) (C). White areas represent colocalization. Rectangles denote zoomed area. [Scale bars: Top, 2 μm; Bottom, 500 nm.] (D and E) Density (D) and NND (E) measurements of lamin B1 versus lamin A/C clusters in STORM-imaged WT MEF nuclei (n = 15 nuclei). (F) Box-and-whisker plot of degree of colocalization among lamin molecules calculated from dual-color STORM images (n = 5 nuclei). (G) Quantification of unoccupied area in lamin A/C versus lamin B1 meshworks (n = 15 nuclei). Bars, means ± SEM. *P ≤ 0.05; **P ≤ 0.01; ***P ≤ 0.001 (unpaired two-tailed t test). (H) Simplified schematic representation of A-type and B-type lamins illustrating potential network characteristics based on NND calculations.
Fig. 3.
Fig. 3.
The C-terminal farnesyl group determines the spatial organization of lamin B1. (A) STORM image at equatorial plane of an immunofluorescently labeled Lmnb1CS/CS MEF nucleus. (Scale bar: 2 μm.) Rectangles denote Inset zoomed areas. (Inset scale bars: 500 and 100 nm.) Lamin B1, green; lamin A/C, red. (B) Fluorescence intensity profile plots across the STORM imaged Lmnb1CS/CS MEF nuclear envelope. x axis, distance (nm); y axis, intensity (arbitrary units). (Inset) Box-and-whisker plot of separation (nm) between lamin A/C and B1 fluorescent-intensity peaks from five nuclei. (C) Comparison of lamin B1 and lamin A/C intensity peak separation in WT versus Lmnb1CS/CS MEFs (n = 5 nuclei). (D) Confocal immunofluorescence images of representative WT and Lmnb1CS/CS MEF nuclei taken at the equatorial plane. Lamin B1, green; lamin A/C, red. (Scale bar: 10 μm.) Dotted lines depict measurement lengths of fluorescent-intensity plots shown in Fig. 5E. (E) Fluorescence intensity profile plots across representative WT and Lmnb1CS/CS nuclei. The sharp peaks at each end of the lamin A/C and WT lamin B1 plots represent bright peripheral staining. x axis, measurement distance (μm); y axis, fluorescence intensity (arbitrary units). (F) Comparison of sequential lamin B1 extractions in WT versus Lmnb1CS/CS cells. The graph represents fraction of total lamin B1 signal in each extraction from three independent experiments. Bars, means ± SEM. **P ≤ 0.01; ***P ≤ 0.001 (unpaired two-tailed t test).
Fig. 4.
Fig. 4.
Lamin B1 meshwork is curvature and strain-responsive. (A) Wide-field fluorescent microscopy images of WT MEF nuclei displaying differential localization of lamin B1 and lamin A/C across the nucleus. Dashed lines represent major axes. The vertices at the ends of the major axis are defined as the nuclear poles. Arrowheads point to areas of decreased lamin B1 intensity. (Scale bar: 10 µm.) (B) Plot of normalized lamin intensity versus radius of curvature R for 30 points across 17 nuclei, with logarithmic trend lines. At the x intercept, R = 1.8 µm. (C) MEFs were doubly transfected with GFP-LMNB1 and DsRed-LMNA plasmids and then aspirated with a micropipette. Normalized aspiration length, L/D, is defined as the aspirated projection length, L, divided by the diameter of the micropipette, D. Arrows point to aspiration tip and base. (Scale bar: 10 µm.) (D) Graph of lamin intensities at the aspiration tip versus L/D (n = 5). Lamin intensities at the aspiration tip were normalized to its intensity throughout the rest of the nucleus. Bars, means ± SEM. *P ≤ 0.05; **P ≤ 0.01; ***P ≤ 0.001 (two-way ANOVA with Sidak’s multiple comparisons test).
Fig. 5.
Fig. 5.
Lamin structure determines its roles in maintaining nuclear shape. (A) Confocal images of a WT MEF nucleus at the equatorial plane showing a typical nuclear envelope protrusion referred to as a bleb (arrow). The dashed line represents major axis. (B) Quantification of bleb frequencies among WT (n = 178), Lmna−/− (n = 178), Lamin B1-overexpressing (n = 182), Lmnb1CS/CS (n = 201), and Lmnb1−/− (n = 201) MEF nuclei. (C) Histogram of bleb lamin intensity relative to nuclear body intensity in WT MEFs (n = 214). Median ratios: 1.34 (LA/C), 0.10 (LB1). (D) Frequencies of blebs that contain LA/C only versus both LA/C plus LB1 in primary MEFs (n = 225) and HeLa cells (n = 230). (E) Box-and-whisker plot of lamin fluorescence intensity ratios among blebs that contain both lamin A/C and lamin B1 in WT MEFs (n = 24). (F) Nuclear bleb frequencies in HeLa cells treated with 0.1 nM (n = 288) and 1 nM Cal-A (n = 324), compared with DMSO-treated control (n = 220). (G) Radius measurements of blebs containing only lamin A/C (n = 158) versus both A/C and B1 (n = 31). (H) Radius measurements of blebs in WT (n = 189) versus Lmnb1−/− (n = 87) MEFs. (I) Percentages of polar-localized blebs in WT (n = 206) versus Lmnb1−/− (n = 87) MEFs. Bars, means ± SE. *P ≤ 0.05; **P ≤ 0.01; ***P ≤ 0.001 (χ2 tests were used for B, F, and I; Wilcoxon matched-pairs signed rank test for E, and unpaired two-tailed t test with Welch’s correction for G and H).
Fig. 6.
Fig. 6.
Schematic representation of lamin organization at the nuclear envelope. Lamin B1’s meshwork (green) lies closest to the INM, while lamin A/C’s meshwork (red) faces the nucleoplasm. (A) In circular or slightly elliptical nuclei, the B-type lamin meshwork is sufficient to contain the underlying A-type lamin meshwork. (B) Regions of high curvature in elongated nuclei can result in a dilation or loss of the lamin B1 meshwork. (C) Lamin A/C forms blebs through the gaps within the lamin B1 meshwork. (DF) Representative MEF nuclei displaying circular (D), elongated (E), and blebbed (F) morphologies as illustrated in the above models. Lamin B1, green; lamin A/C, red, DNA, blue.

Similar articles

Cited by

References

    1. Gerace L, Huber MD. Nuclear lamina at the crossroads of the cytoplasm and nucleus. J Struct Biol. 2012;177:24–31. - PMC - PubMed
    1. Ho CY, Lammerding J. Lamins at a glance. J Cell Sci. 2012;125:2087–2093. - PMC - PubMed
    1. Burke B, Stewart CL. The nuclear lamins: Flexibility in function. Nat Rev Mol Cell Biol. 2013;14:13–24. - PubMed
    1. Biamonti G, et al. The gene for a novel human lamin maps at a highly transcribed locus of chromosome 19 which replicates at the onset of S-phase. Mol Cell Biol. 1992;12:3499–3506. - PMC - PubMed
    1. Lin F, Worman HJ. Structural organization of the human gene (LMNB1) encoding nuclear lamin B1. Genomics. 1995;27:230–236. - PubMed

Publication types