. 2019 Mar 22;363(6433):1319-1326.
doi: 10.1126/science.aau7285. Epub 2019 Feb 14.

Parallel adaptation of rabbit populations to myxoma virus

Affiliations

Parallel adaptation of rabbit populations to myxoma virus

Joel M Alves et al. Science. .

Abstract

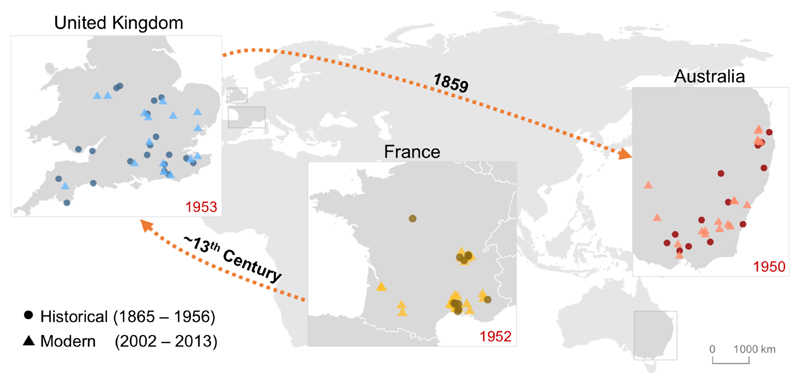
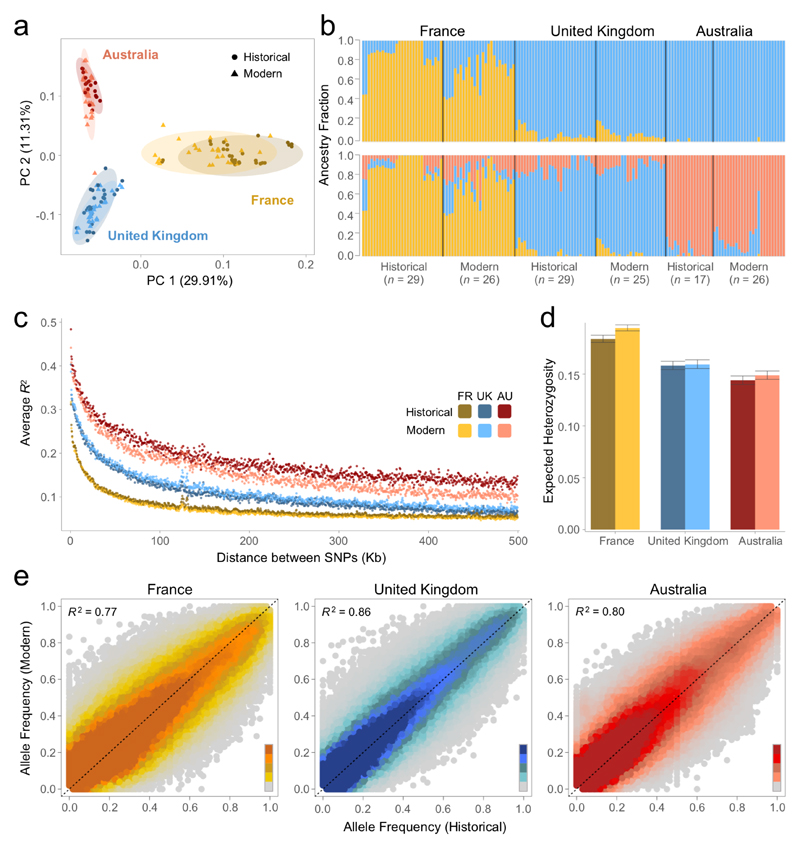
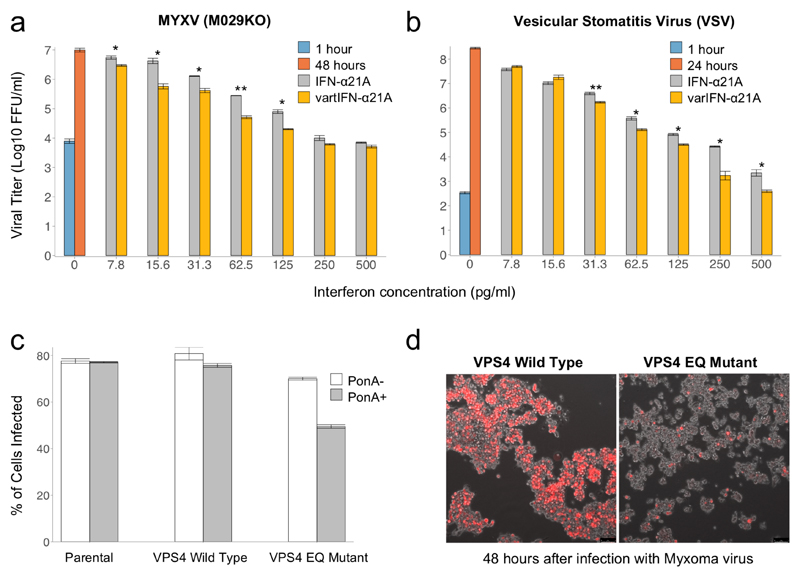
In the 1950s the myxoma virus was released into European rabbit populations in Australia and Europe, decimating populations and resulting in the rapid evolution of resistance. We investigated the genetic basis of resistance by comparing the exomes of rabbits collected before and after the pandemic. We found a strong pattern of parallel evolution, with selection on standing genetic variation favoring the same alleles in Australia, France, and the United Kingdom. Many of these changes occurred in immunity-related genes, supporting a polygenic basis of resistance. We experimentally validated the role of several genes in viral replication and showed that selection acting on an interferon protein has increased the protein's antiviral effect.


Conflict of interest statement

Competing interests: None declared.

Figures

Fig. 1
Fig. 1. Rabbit origins and sampling locations.
Historical (circles) and modern (triangles) sampling locations. Dates in red inside the maps show the date of the first myxomatosis outbreak in the respective countries. Orange dashed arrows and dates reflect historical and archaeological records of the colonisation of European rabbits from France to the United Kingdom and Australia.
Fig. 2
Fig. 2. Genetic structure and diversity in historical and modern populations of France, United Kingdom and Australia
(a) Principal components analysis (PCA). Ellipses show 95% confidence intervals. (b) Ancestry fractions inferred with Ohana structure analysis for K=2 (top) and K=3 (bottom). Each bar shows the inferred ancestry fraction for an individual. Black lines between bars separate populations. Labels above bars identify country and labels below bars identify temporal set and sample size. Individuals are ordered geographically within each population. (c) Decay of linkage disequilibrium for each population. Each dot represents the averaged pairwise R2 values between pairs of SNPs in non-overlapping 500bp windows. Colours represent different populations. (d) Expected heterozygosity for each population. The bars are the mean across chromosome arms, and error bars are 95% bootstrap confidence intervals from resampling chromosome-arms. Colours represent different populations. (e) The correlation between the frequency of the alternative allele in historical and modern populations for France, the UK and Australia. Colours reflects the relative density of points according to the scale on the bottom right of each plot, from darker (more density) to lighter (less density).
Fig. 3
Fig. 3. Parallel changes in allele frequency across three countries.
(a) Venn diagram showing the overlap of the 1000 SNPs with the highest changes in allele frequency between modern and historical samples (FST) in France, the UK, and Australia. Numbers in black show the observed number of SNPs and numbers in red show the expected overlap after 1000 random permutations of modern and historical samples within each country. (b) Scaled histogram of the FST values in the three countries. Bars with dark colours reflect SNPs that are in the top 1000 in both of the other two countries. Bars with light colours are SNPs that are in the top 1000 of only one of the other countries. Grey bars are all the remaining SNPs. (c) Genome-wide selection scan based on allele frequency changes after the introduction of myxomatosis. (supplementary methods, Equation 5; the strength of selection in each population is allowed to vary independently) (d) Selection scan testing whether selection has acted in all three populations (positive values) or just one population (negative values; supplementary methods, Equation 6). (c and d) Y-axis shows likelihood ratio statistic of each model. Orange dotted line shows genome-wide 95% significance threshold from permuting sample collection dates within each country. Shaded boxes show SNPs located in the highlighted genes. Different shades of blue show chromosomes. (e) Mean of the posterior distribution of the derived allele frequency as a function of time for the IFN-α21A and FCRL3 loci from the Bayesian selection analysis (additive model). 95% credible intervals are shaded. Triangles across the bottom represent years of samples (only samples post-1940 are shown). Dotted lines show dates of first reports of MYXV and RHDV. List of the top 1000 SNPs for all figures is available in Files S2, S3, and S4.
Fig. 4
Fig. 4. The effect of IFN-α21A and VPS4 on viral titres.
(a and b) wild-type (IFN-α21A, grey bars) and variant (varIFN-α21A, yellow bars) IFN-α21A were added at different concentrations to cell culture before infection with (a) MYXV-M029KO and (b) vesicular stomatitis virus (VSV). Viral titre was measured 1-hour post-infection (blue bars) and 24/48 hours post infection (orange bars). Error bars show standard error of the mean. Statistical significance between wild and mutated interferon treatments was inferred with a Student's t-test across three replicate assays (* P<0.05; ** P<0.01). (c) HEK293 cell lines stably expressing the wild-type isoform of human VPS4 (wild-type) or a dominant-negative VPS4 (EQ Mutant) under the control of ponasterone A (PonA). The HEK293 non-transfected cell line (Parental) was included as an additional control. Cells were either untreated (PonA-) or pre-treated (PonA+) with 1 µM PonA for 20-24 hours and then infected with wild-type MYXV expressing a red fluorescent protein (vMyx-tdTomato) at a multiplicity of infection (MOI) 10. The percentage of infected cells (tdTomato+) was assessed by flow cytometry. Error bars show standard error of the mean. (d) Fluorescence microscope images of VPS4 wild-type and VPS4 EQ mutant HEK293 cells pre-treated with PonA (20-24 hours), 48 hours post-infection with vMyx-tdTomato (MOI 10). The live cell images were taken using an inverted fluorescence microscope at 10x magnification. FFU, focus forming unit.

Comment in

  • Evolving resistance to pathogens.
    Miller IF, Metcalf CJE. Miller IF, et al. Science. 2019 Mar 22;363(6433):1277-1278. doi: 10.1126/science.aaw8710. Science. 2019. PMID: 30898916 No abstract available.

References

    1. Fenner F, Ratcliffe FN. Myxomatosis. Cambridge University Press; Cambridge ; New York: 1965.
    1. Fenner F, Fantini B. Biological Control of Vertebrate Pests: The History of Myxomatosis - an Experiment in Evolution. CABI publishing; New York, NY, USA: 1999.
    1. Ross J, Sanders MF. The development of genetic resistance to myxomatosis in wild rabbits in Britain. J Hyg (Lond) 1984;92:255–261. - PMC - PubMed
    1. Fenner F, Ross J. In: The European rabbit: The History and Biology of a Successful Colonizer. Thompson HV, King CM, editors. Oxford University Press; Oxford ; New York: 1994. pp. 205–239.
    1. Marshall ID, Fenner F. Studies in the epidemiology of infectious myxomatosis of rabbits. V. Changes in the innate resistance of Australian wild rabbits exposed to myxomatosis. J Hyg (Lond) 1958;56:288–302. - PMC - PubMed

Publication types

MeSH terms

Substances