. 2019 Feb 14;10(1):754.
doi: 10.1038/s41467-019-08734-9.

Direct RNA sequencing on nanopore arrays redefines the transcriptional complexity of a viral pathogen

Affiliations

Direct RNA sequencing on nanopore arrays redefines the transcriptional complexity of a viral pathogen

Daniel P Depledge et al. Nat Commun. .

Abstract

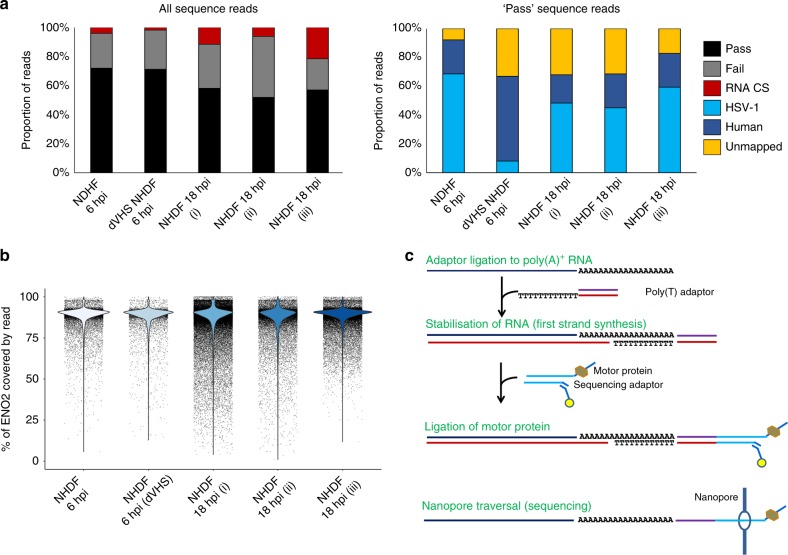
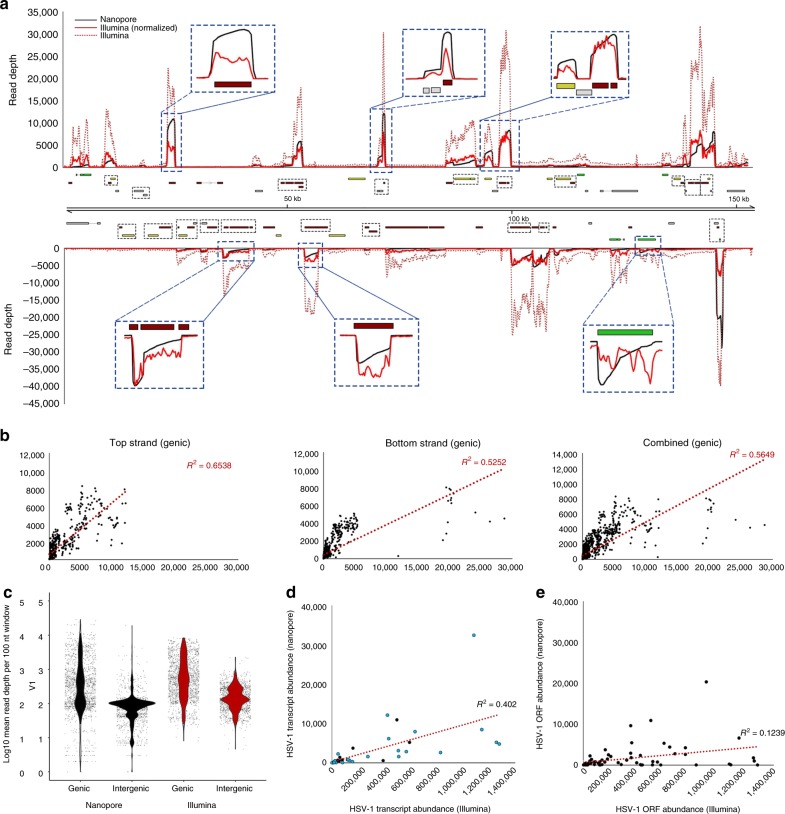
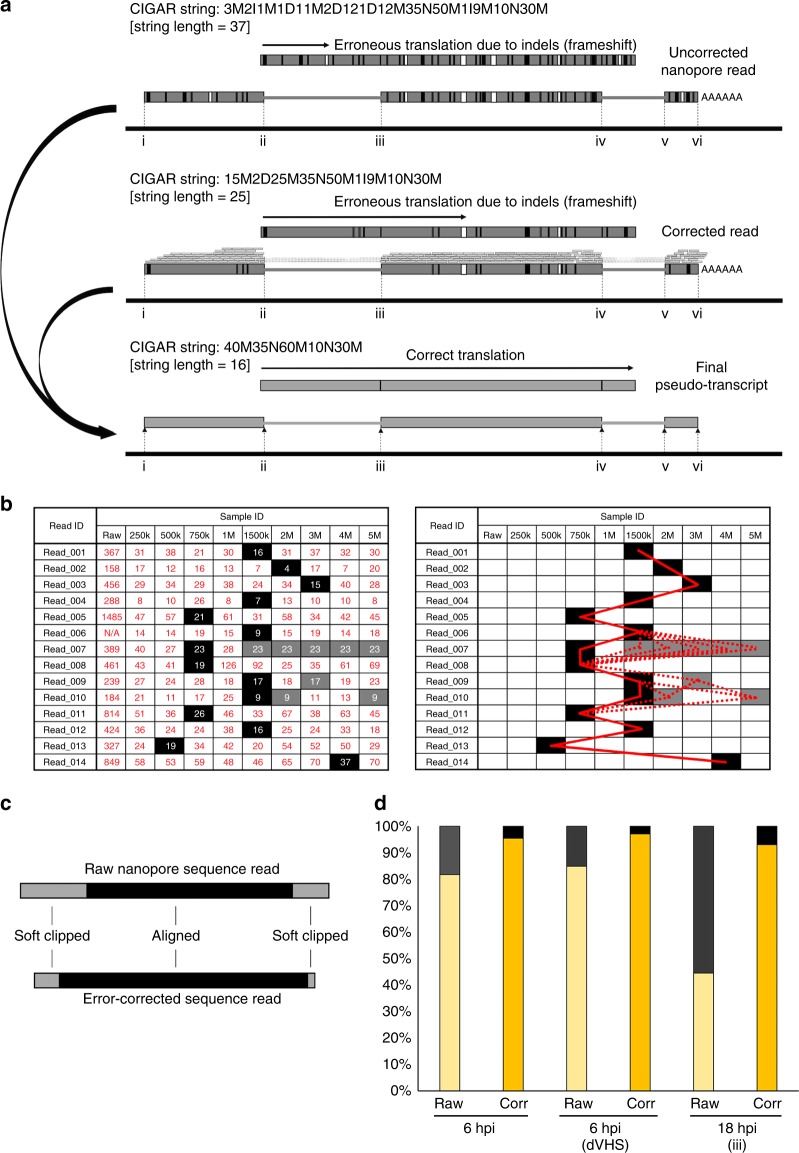
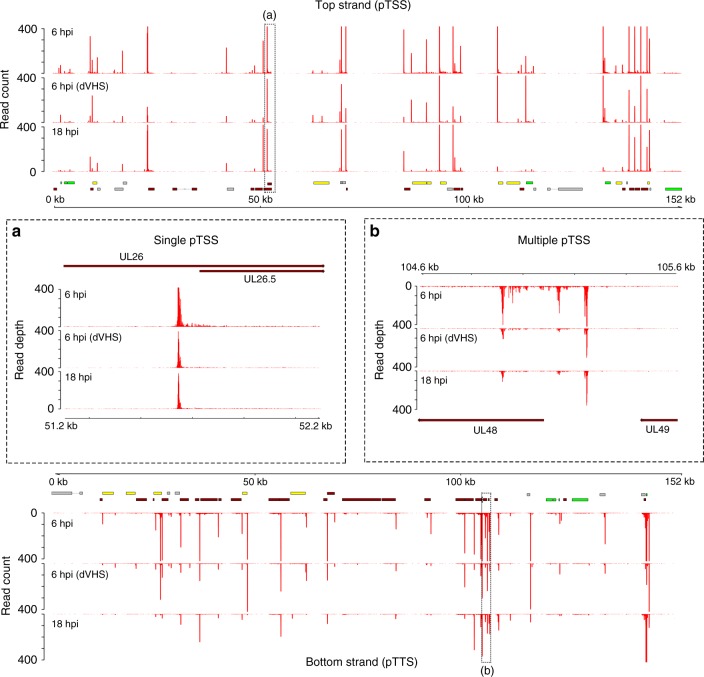
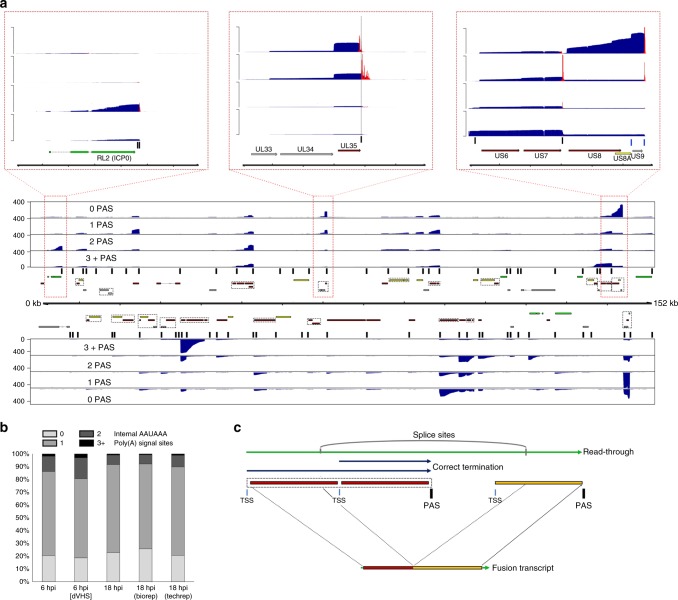
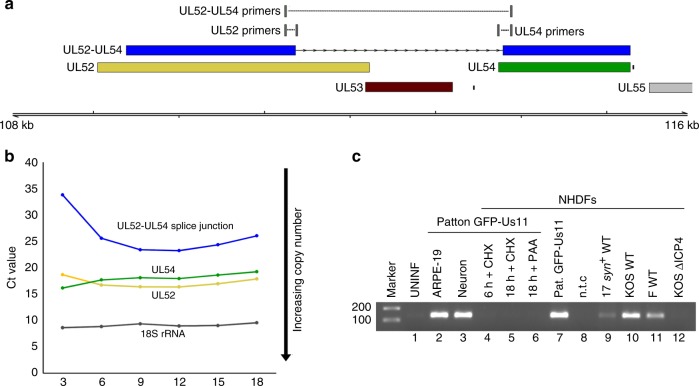
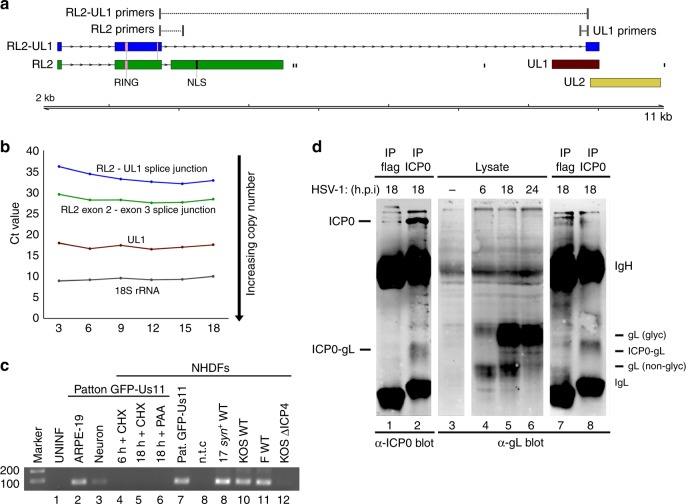
Characterizing complex viral transcriptomes by conventional RNA sequencing approaches is complicated by high gene density, overlapping reading frames, and complex splicing patterns. Direct RNA sequencing (direct RNA-seq) using nanopore arrays offers an exciting alternative whereby individual polyadenylated RNAs are sequenced directly, without the recoding and amplification biases inherent to other sequencing methodologies. Here we use direct RNA-seq to profile the herpes simplex virus type 1 (HSV-1) transcriptome during productive infection of primary cells. We show how direct RNA-seq data can be used to define transcription initiation and RNA cleavage sites associated with all polyadenylated viral RNAs and demonstrate that low level read-through transcription produces a novel class of chimeric HSV-1 transcripts, including a functional mRNA encoding a fusion of the viral E3 ubiquitin ligase ICP0 and viral membrane glycoprotein L. Thus, direct RNA-seq offers a powerful method to characterize the changing transcriptional landscape of viruses with complex genomes.


Conflict of interest statement

The authors declare no competing interests.

Figures

Fig. 1
Fig. 1
Direct RNA sequencing using nanopore arrays is highly reproducible. a Summary metrics for five separate direct RNA-seq runs using normal human dermal fibroblasts (NHDFs) infected with HSV-1 strain Patton GFP-Us11 or HSV-1 strain F vhs null (Δvhs) for either 6 or 18 h. NHDF 18hpi (i) and (ii) represent biological replicates, with an additional technical replicate, NHDF 18hpi (iii), performed on a separate minION device. Calibration strand reads originate from the spiked human enolase 2 (ENO2) mRNA. Pass and fail reads were classified as such by the albacore basecaller. Only reads passing QC (“pass”) were retained for downstream analyses and these were classified by mapping against the HSV-1 genome and H. sapiens transcriptome. Only a small proportion of reads could not be mapped. b The spiking of ENO2 mRNA allows assessment of RNA degradation during library preparation. Here, mRNA degradation is represented by the fraction of ENO2 covered by individual reads and indicates only minimal 5′ degradation during library preparation. c Overview of the nanopore RNA-sequencing methodology. A poly(T) adapter is ligated to poly(A) tails and used to prime first-strand synthesis of cDNA which stabilizes the RNA strand. The poly(T) adapter also allows ligation of the motor protein required to guide the RNA strand through a nanopore
Fig. 2
Fig. 2
Comparison of direct RNA nanopore sequencing to Illumina sequencing. a HSV-1 genome-wide sliding-window (100 nt) coverage plots of poly(A) RNA sequenced by nanopore (black) and Illumina (red) technologies. Nanopore reads represent a single polyadenylated RNA, directly sequenced, while Illumina reads are derived from highly fragmented poly(A)-selected RNAs. Illumina data (red dotted line) were normalized (red solid line) to produce the same overall coverage as the nanopore data. The HSV-1 genome is annotated with all canonical open-reading frames (ORFs) and colored according to kinetic class (green—immediate early, yellow—early, red—late, and gray—undefined). Multiple ORFs are grouped in polycistronic units and these are indicated by black hatched boxes. The y-axis represents absolute read-depth counts. Inset windows (blue hatched boxes) exemplify the 3′ bias inherent to direct RNA-seq (due to sequence reads being generated 3′ − > 5′) that is less prevalent in Illumina data. b Correlation analyses of HSV-1 genome coverage were generated using nanopore and Illumina sequence data. The sliding-window analysis was determined by calculating and plotting mean read-depth values per 100 nucleotide windows across canonically defined genic regions in both a strand-specific and strand-combined manner. c Dot plots denoting read- depth values (100-nt intervals) in genic and intergenic regions for both direct RNA-seq and normalized Illumina datasets. Read depths between genic and intergenic regions differ by a mean fold difference of 12.08 (nanopore) and 6.82 (Illumina). The y-axis is log-10 scaled. d, e Transcript abundances were counted for nanopore and Illumina datasets by aligning against two versions of the HSV-1 transcriptome. The simplified version (left) collapses polycistronic units into simple transcription units, while the standard version (right) comprises all individual coding units, whether mono- or polycistronic. The impact on comparative transcript abundance estimates is greater in the latter
Fig. 3
Fig. 3
Error correction and generation of pseudotranscripts to overcome sequencing errors inherent to the nanopore method. a Raw nanopore reads include numerous indel and substitution errors that hinder the identification of encoded ORFs and thereby impede annotation of the transcriptome. Illumina datasets generated from the same material allowed error correction using proovread (and see Figure S2). Subsequently, the transcript start/stop positions and internal splice positions were used to generate pseudotranscripts free of indel and substitution errors that permit unambiguous ORF prediction. Example changes in CIGAR string lengths for a given read are shown for each step of correction. b To optimize proovread error correction, we tested a range of subsampled Illumina datasets and evaluated corrected reads by the length of the CIGAR string (see Methods). Because optimal Illumina subsampling varies between reads, we subsequently applied a decision matrix utilizing the best-corrected version of a given read (filled boxes) as scored by the shortest CIGAR string length. Where multiple subsampling sets produce identical shortest CIGAR scores (shaded boxes), no difference was observed between the resulting sequences. The bold red line indicates the path chosen (i.e., from which error-corrected dataset a given read was drawn), while the dotted lines indicate alternative paths that produce the exact same result due to having identical CIGAR string lengths. c Schematic representation of the effect of error correction. The overall length of error-corrected nanopore reads is marginally less than raw sequence reads but the aligned portion of error-corrected reads is longer. d For each sequence read, the longest encoded ORF (>90 nt) was identified. Here, error correction notably increases the proportion of sequence reads containing translatable ORFs. In other words, the removal of indel errors improves our ability to identify novel and known ORFs
Fig. 4
Fig. 4
Viral polyadenylated RNAs initiate at single or multiple locations. To visualize transcription start sites, the extreme 5′ end of each nanopore read was plotted against the HSV-1 genome. Datasets correspond to NHDF infected with HSV-1 strain Patton for 6 hpi (upper track), strain F Δvhs for 6 hpi (middle track), and strain Patton for 18 hpi (lower track). Peaks corresponding to clustered 5′ ends, are referred to as proximal transcription start sites (pTSS) and likely differ by only a few nucleotides from the actual capped 5′ end. In 13 cases, the pTSS is positioned 30–48 bp downstream of a canonical TATA box. Upper panel: top strand. Lower panel: bottom strand. Inset boxes: a Transcription of the HSV-1 UL26.5 gene initiates at a single location throughout infection. b UL48 transcription initiates at multiple locations, one of which is internal to the canonical UL48 ORF, suggesting transcripts encoding a truncated or alternative protein. Canonical HSV-1 ORFs are colored according to kinetic class (IE—green, E—yellow, L—red, and undefined—gray), while polycistronic transcriptional units are indicated by hatched boxes
Fig. 5
Fig. 5
Detection of read-through transcription from the HSV-1 genome. a HSV-1 sequence reads were segregated according to the number of AAUAAA PAS motifs present and aligned against the HSV-1 genome to produce coverage plots showing the location of mapped reads. Here, complex (multiple overlapping ORFs) gene arrays are identified by cross-hatched boxes, while the locations of AAUAAA motifs are indicated by vertical black bars. The three inset boxes correspond to the red cross-hatched areas of the genome that exemplify (left) the presence of two AAUAAA motifs at the 3′ end of the RL2 transcript, (center) the position of pTTS sites relative to AAUAAA motifs (black vertical line), and (right) usage of the non-canonical AUUAAA motif (blue vertical line). pTTS estimates are shown as red overlays on the inset coverage plots. b HSV-1 transcription termination is generally initiated by recognition of a canonical (AAUAAA—dark gray) PAS sequence. Evidence of read-through transcription includes the presence of multiple AAUAAA motifs within a transcript and is observed in a small proportion 1–3% of HSV-1 mapping direct RNA-seq reads. c Transcription of HSV-1 genes initiates at transcription start sites (blue vertical line) and typically terminates shortly after traversing a canonical (AAUAAA) PAS sites (black vertical line). In rarer cases, termination does not occur and transcription extends further downstream as read-through until another PAS site is used. These extended transcripts may be subject to internal splicing which can give rise to fusion ORFs
Fig. 6
Fig. 6
Chimeric UL52–UL54 mRNA is expressed with late kinetics and by multiple HSV-1 strains. a The UL52–UL54 fusion transcript. b Assessment of the UL52–UL54 splice junction usage at different times after infection by real-time RT-qPCR. Increased RNA abundance is reflected as lower crossover threshold (Ct) values and normalized to 18S rRNA. Three technical replicates were utilized per condition/time point. Representative data are shown from one of three biological replicates. c Detection of the unique UL52–UL54 splice junction by RT-PCR using a primer scanning the splice junction. NHDFs were infected in parallel with either HSV-1 strain Patton (lanes 2–7) or with wild-type strain 17 syn+ (lane 9), KOS (lane 10), strain F (lane 11) viruses, or with n12, a KOS ICP4 null mutant (lane 12), and RNA was collected at either 6 h (lane 4) or 18 h (lanes 2–3, 5–7, and 8–12) post infection. Inhibitors of protein synthesis (cycloheximide, CHX) or the viral DNA polymerase (phosphonoacetic acid, PAA) were included as indicated (lanes 4–6). Amplification products were visualized with ethidium bromide
Fig. 7
Fig. 7
Chimeric RL2–UL1 mRNA is expressed with late kinetics and by multiple HSV-1 strains. a The RL2–UL1 fusion transcript encodes an ICP0-gL fusion protein that lacks two phosphorylation sites (P2, P3) and the nuclear localization signal (NLS) domain present in ICP0. b Assessment of canonical RL2 exon2–exon3 and novel RL2 exon 2—UL1 internal splice junction usage at different times after infection by real-time RT-qPCR. Increased RNA abundance is reflected as lower crossover threshold (Ct) values and normalized to 18S rRNA. Three technical replicates were utilized per condition/time point. Representative data are shown from one of three biological replicates. c Detection of the unique RL2 exon 2—UL1 splice by RT-PCR using a primer scanning the splice junction. NHDFs were infected in parallel with either HSV-1 strain Patton (lanes 2–7) or with wild-type strain 17 syn+ (lane 9), KOS (lane 10), strain F (lane 11) viruses, or with n12, a KOS ICP4 null mutant (lane 12), and RNA was collected at either 6 h (lane 4) or 18 h (lanes 2–3, 5–7, and 8–12) post infection. Inhibitors of protein synthesis (cycloheximide, CHX) or the viral DNA polymerase (phosphonoacetic acid, PAA) were included as indicated (lanes 4–6). Amplification products were visualized with ethidium bromide. d Detection of the predicted ICP0-gL fusion protein. Lysates were prepared from mock (lane 3) or HSV-1 strain Patton-infected NHDFs collected at 6, 18, or 24 h post infection (lanes 1–2, 4–8) and analyzed by immunoblotting with (lanes 1–2 and 7–8) or without (lanes 3–6) prior immunoprecipitation using anti-ICP0 (lane 2 and 8) or control anti-flag- (lanes 1 and 7) loaded protein A beads. After fractionation by SDS-PAGE, membranes were probed using primary antibodies recognizing either the N terminus of ICP0 (lanes 1–2) or the C terminus of glycoprotein L (lanes 3–8). The ICP0-gL fusion peptide has a predicted mass of 32 kDa. Additional reactive species corresponding to ICP0, glycosylated and non-glycosylated gL, and antibody heavy (IgH) or light chains (IgL) are indicated. The image shown is representative of three independent replicates

References

    1. Chen CP, et al. Kaposi’s sarcoma-associated Herpesvirus Hijacks RNA polymerase II to create a viral transcriptional factory. J. Virol. 2017;91:JVI.02491–16. - PMC - PubMed
    1. Stern-Ginossar N, Thompson SR, Mathews MB, Mohr I. Translational control in virus-infected cells. Cold Spring Harb. Perspect. Biol. 2018 doi: 10.1101/cshperspect.a033001. - DOI - PMC - PubMed
    1. Brandes N, Linial M. Gene overlapping and size constraints in the viral world. Biol. Direct. 2016;11:1–15. doi: 10.1186/s13062-016-0128-3. - DOI - PMC - PubMed
    1. O’Grady T, et al. Global transcript structure resolution of high gene density genomes through multi-platform data integration. Nucleic Acids Res. 2016;44:e145. doi: 10.1093/nar/gkw629. - DOI - PMC - PubMed
    1. Canny SP, et al. Pervasive transcription of a herpesvirus genome generates functionally important RNAs. mBio. 2014;5:e01033–13. doi: 10.1128/mBio.01033-13. - DOI - PMC - PubMed

Publication types