. 2019 Feb 14;9(1):2107.
doi: 10.1038/s41598-018-37786-y.

How context influences the interpretation of facial expressions: a source localization high-density EEG study on the "Kuleshov effect"

Affiliations

How context influences the interpretation of facial expressions: a source localization high-density EEG study on the "Kuleshov effect"

Marta Calbi et al. Sci Rep. .

Abstract

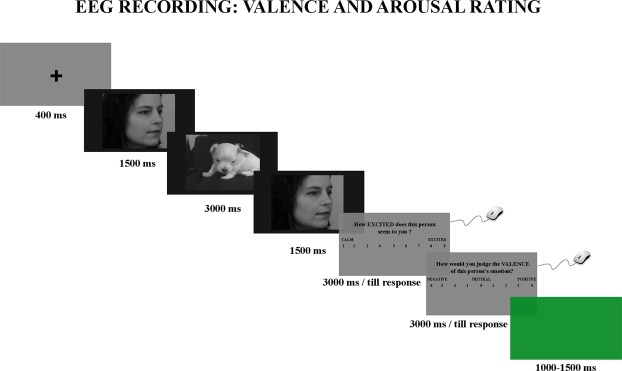
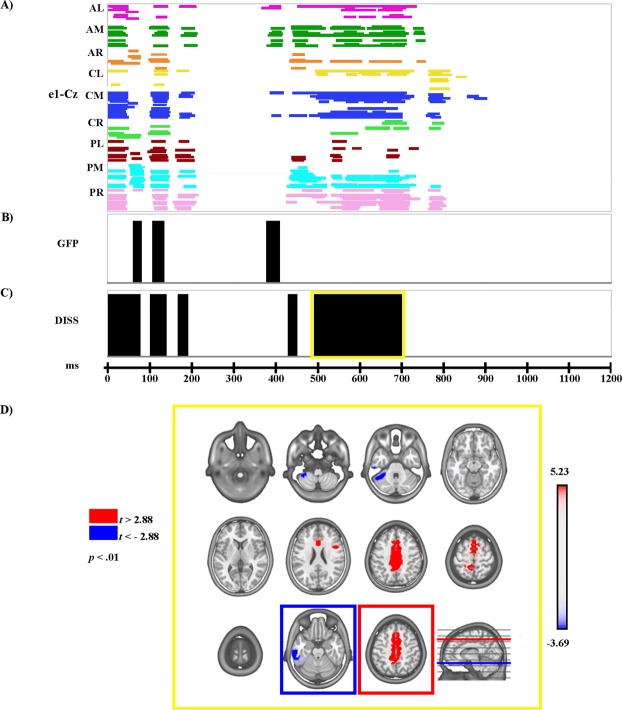
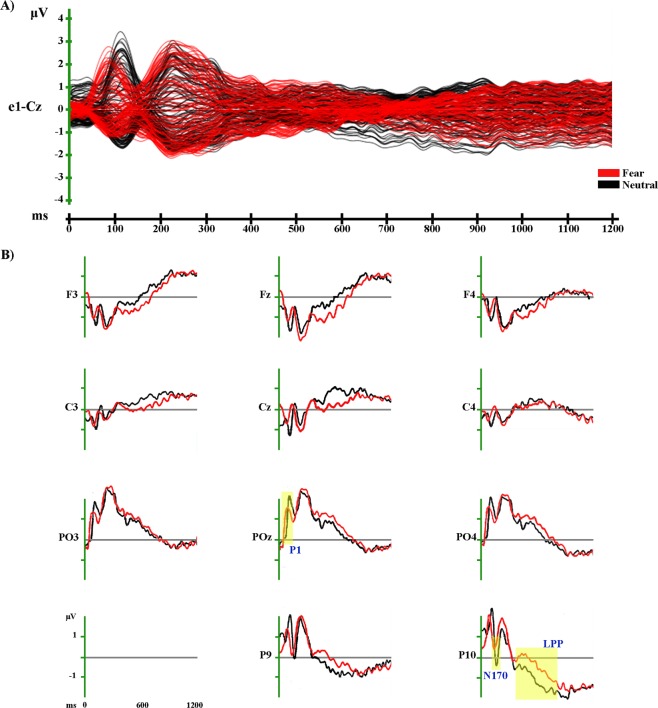
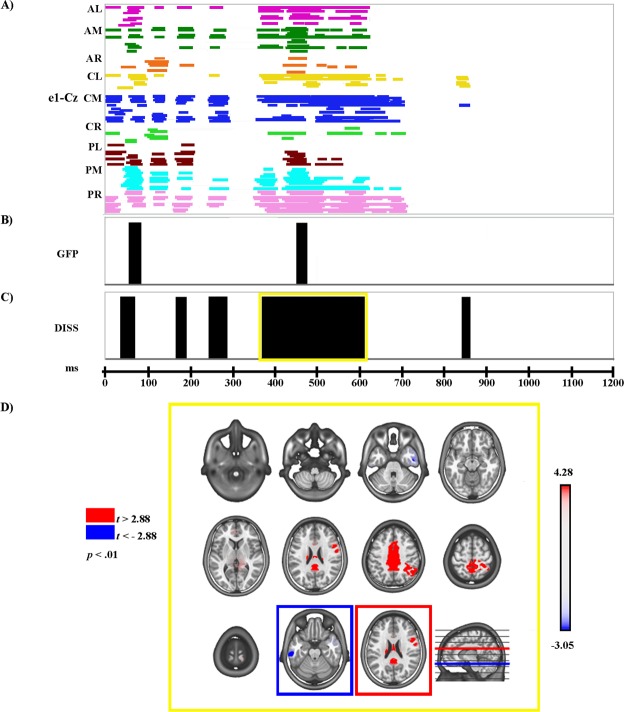
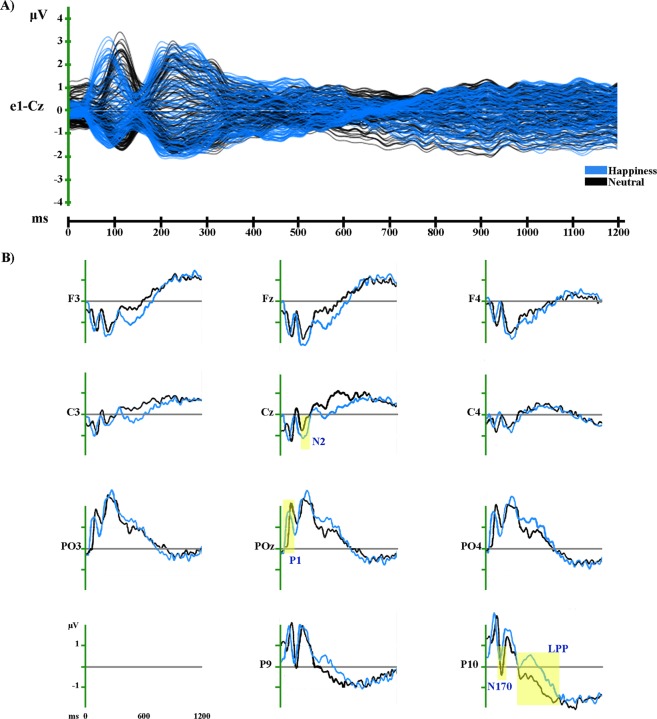
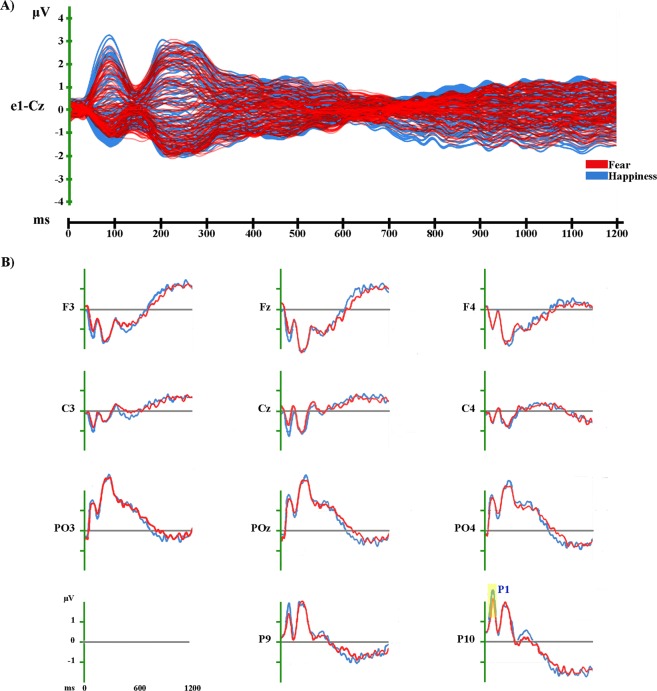
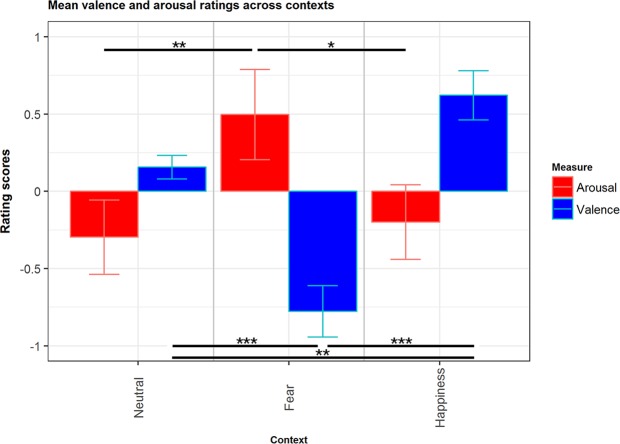
Few studies have explored the specificities of contextual modulations of the processing of facial expressions at a neuronal level. This study fills this gap by employing an original paradigm, based on a version of the filmic "Kuleshov effect". High-density EEG was recorded while participants watched film sequences consisting of three shots: the close-up of a target person's neutral face (Face_1), the scene that the target person was looking at (happy, fearful, or neutral), and another close-up of the same target person's neutral face (Face_2). The participants' task was to rate both valence and arousal, and subsequently to categorize the target person's emotional state. The results indicate that despite a significant behavioural 'context' effect, the electrophysiological indexes still indicate that the face is evaluated as neutral. Specifically, Face_2 elicited a high amplitude N170 when preceded by neutral contexts, and a high amplitude Late Positive Potential (LPP) when preceded by emotional contexts, thus showing sensitivity to the evaluative congruence (N170) and incongruence (LPP) between context and Face_2. The LPP activity was mainly underpinned by brain regions involved in facial expressions and emotion recognition processing. Our results shed new light on temporal and neural correlates of context-sensitivity in the interpretation of facial expressions.


Conflict of interest statement

The authors declare no competing interests.

Figures

Figure 1
Figure 1
Experimental paradigm. The neutral faces were taken from the Karolinska Directed Emotional Faces picture set – KDEF. The depicted face is AF06NEHR. The frame of the puppy was taken from the video “Cute Puppies!” of “Outstanding Videos” Youtube channel (https://www.youtube.com/watch?v=3RkKvf12Bw0).
Figure 2
Figure 2
Hydrocel Geodesic Sensor Net – 128 channel map. Grey indicates the outermost belt of electrodes of the sensor net that was excluded from analyses. Other colours indicate the nine different clusters of electrodes considered for global ERP waveform analysis.
Figure 3
Figure 3
Electrophysiological results and statistical comparison of LAURA source estimation between Fear and Neutral over significant TANOVA LPP time interval. (A) Statistical analysis of global ERP amplitude. Periods of significant differences of ERP amplitude (p < 0.01; duration >20 ms) at each electrode and time-point between conditions are displayed as coloured horizontal lines. Each horizontal line represents one scalp electrode. Different colours indicate different clusters of electrodes (as shown in Fig. 2); AL: anterior left; AM: anterior midline; AR: anterior right. CL: central left; CM: central midline; CR: central right. PL: posterior left; PM: posterior midline; PR: posterior right. (B) Global scalp electric field analysis: statistical analysis of global electric field strength. Black areas indicate time intervals of significant differences (p < 0.01; duration >20 ms) of Global Field Power (GFP) between conditions. (C) Global scalp electric field analysis: statistical analysis of global electric field topography (topographic analysis of variance, TANOVA). Black areas indicate time intervals of significant differences (p < 0.01; duration >20 ms) of global spatial dissimilarity index (DISS) between conditions. (D) Significant TANOVA time interval (494–702 ms after Face_2 onset). All significant voxels are coloured (t(18) >2.88/< −2.88, p < 0.01): positive t values (red) indicate higher current source densities in Fear than in Neutral; negative t values (blue) indicate higher current source densities in Neutral than in Fear. LAURA solutions are rendered on MNI152 template brain (left hemisphere on the left side).
Figure 4
Figure 4
Grand-averaged ERP waveforms of Fear and Neutral conditions. (A) Group-averaged (n = 19) event related potential (ERP) waveforms of the two experimental conditions (Fear and Neutral), superimposed across the 110 recording channels (e1-Cz). (B) Group-averaged (n = 19) Face_2-locked ERP waveforms recorded at left, midline and right scalp sites (frontal: F3, Fz, F4; central: C3, Cz, C4; parieto-occipital: PO3, POz, PO4) and at left and right occipito-temporal scalp sites (P9, P10), plotted as voltage in µv and as function of time in ms (Face_2: 0 ms). Black: Neutral; Red: Fear.
Figure 5
Figure 5
Electrophysiological results and statistical comparison of LAURA source estimation between Happinnes and Neutral over significant TANOVA LPP time interval. (A) Statistical analysis of global ERP amplitude. Periods of significant differences of ERP amplitude (p < 0.01; duration >20 ms) at each electrode and time-point between conditions are displayed as coloured horizontal lines. Each horizontal line represents one scalp electrode. Different colours indicate different clusters of electrodes (as shown in Fig. 2); AL: anterior left; AM: anterior midline; AR: anterior right. CL: central left; CM: central midline; CR: central right. PL: posterior left; PM: posterior midline; PR: posterior right. (B) Global scalp electric field analysis: statistical analysis of global electric field strength. Black areas indicate time intervals of significant differences (p < 0.01; duration >20 ms) of Global Field Power (GFP) between conditions. (C) Global scalp electric field analysis: statistical analysis of global electric field topography (topographic analysis of variance, TANOVA). Black areas indicate time intervals of significant differences (p < 0.01; duration > ms) of global spatial dissimilarity index (DISS) between conditions. (D) Significant TANOVA time interval (372–612 ms after Face_2 onset). All significant voxels are coloured (t(18) > 2.88/< −2.88, p < 0.01): positive t values (red) indicate higher current source densities in Happiness than in Neutral; negative t values (blue) indicate higher current source densities in Neutral than in Happiness. LAURA solutions are rendered on MNI152 template brain (left hemisphere on the left side).
Figure 6
Figure 6
Grand-averaged ERP waveforms of Happy and Neutral conditions. (A) Group-averaged (n = 19) event related potential (ERP) waveforms of the two experimental conditions (Happiness and Neutral), superimposed across the 110 recording channels (e1-Cz). (B) Group-averaged (n = 19) Face_2-locked ERP waveforms recorded at left, midline and right scalp sites (frontal: F3, Fz, F4; central: C3, Cz, C4; parieto-occipital: PO3, POz, PO4) and at left and right occipito-temporal scalp sites (P9, P10), plotted as voltage in µv and as function of time in ms (Face_2: 0 ms). Black: Neutral; light blue: Happiness.
Figure 7
Figure 7
Grand-averaged ERP waveforms of Fear and Happy conditions. (A) Group-averaged (n = 19) event related potential (ERP) waveforms of the two experimental conditions (Fear and Happiness), superimposed across the 110 recording channels (e1-Cz). (B) Group-averaged (n = 19) Face_2-locked ERP waveforms recorded at left, midline and right scalp sites (frontal: F3, Fz, F4; central: C3, Cz, C4; parieto-occipital: PO3, POz, PO4) and at left and right occipitotemporal scalp sites (P9, P10), plotted as voltage in µv and as function of time in ms (Face_2: 0 ms). Red: Fear; light blue: Happiness.
Figure 8
Figure 8
Bar plots of mean valence and arousal ratings across contexts. Error bars represent SE. *p ≤ 0.05; **p ≤ 0.01; ***p ≤ 0.001.

References

    1. Ekman P. Facial expressions and emotion. Am. Psychol. 1993;48:384–392. doi: 10.1037/0003-066X.48.4.384. - DOI - PubMed
    1. Izard CE. Innate and universal facial expressions: evidence from developmental and cross-cultural research. Psychol. Bull. 1994;115:288–99. doi: 10.1037/0033-2909.115.2.288. - DOI - PubMed
    1. Russell, J. A. Reading emotions from and into faces: resurrecting a dimensional contextual perspective in The psychology of facial expressions. (eds Russell, J. A. & Fernandez-Dols, J. M.) 295–320 New York (Cambridge University Press, 1997).
    1. Vuilleumier P, Pourtois G. Distributed and interactive brain mechanisms during emotion face perception: evidence from functional neuroimaging. Neuropsychologia. 2007;45:174–194. doi: 10.1016/j.neuropsychologia.2006.06.003. - DOI - PubMed
    1. Haxby JV, Hoffman EA, Gobbini MI. The distributed human neural system for face perception. Trends Cogn. Sci. 2000;4:223–233. doi: 10.1016/S1364-6613(00)01482-0. - DOI - PubMed

Publication types