. 2019 Feb 14;9(1):2024.
doi: 10.1038/s41598-019-38493-y.

Quantitative nontumorous and tumorous human brain tissue assessment using microstructural co- and cross-polarized optical coherence tomography

Affiliations

Quantitative nontumorous and tumorous human brain tissue assessment using microstructural co- and cross-polarized optical coherence tomography

Konstantin S Yashin et al. Sci Rep. .

Abstract

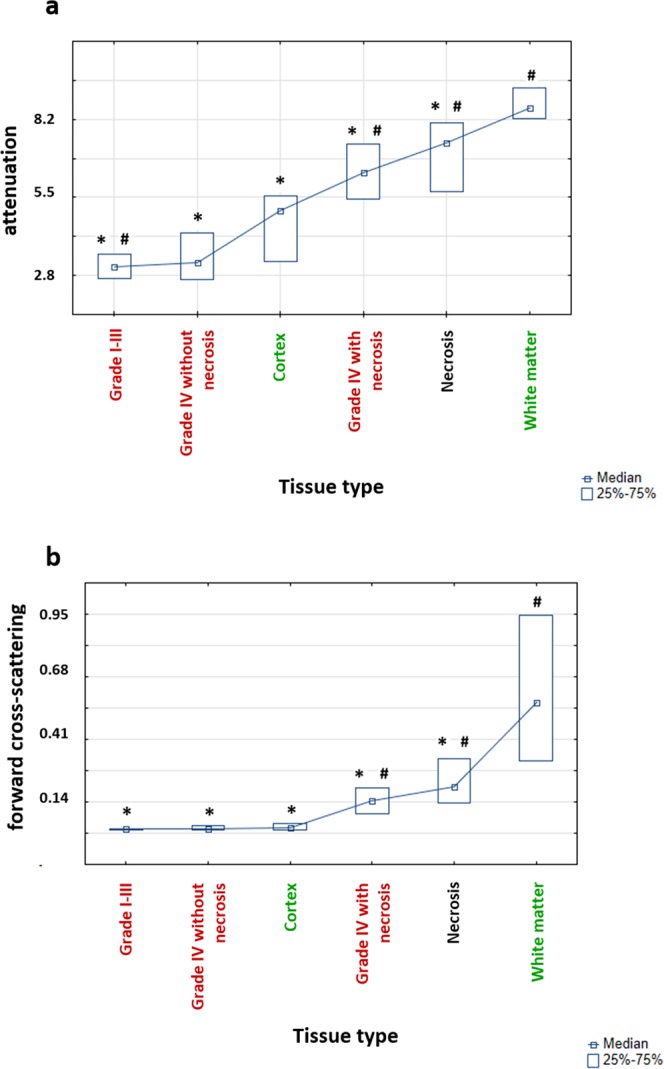
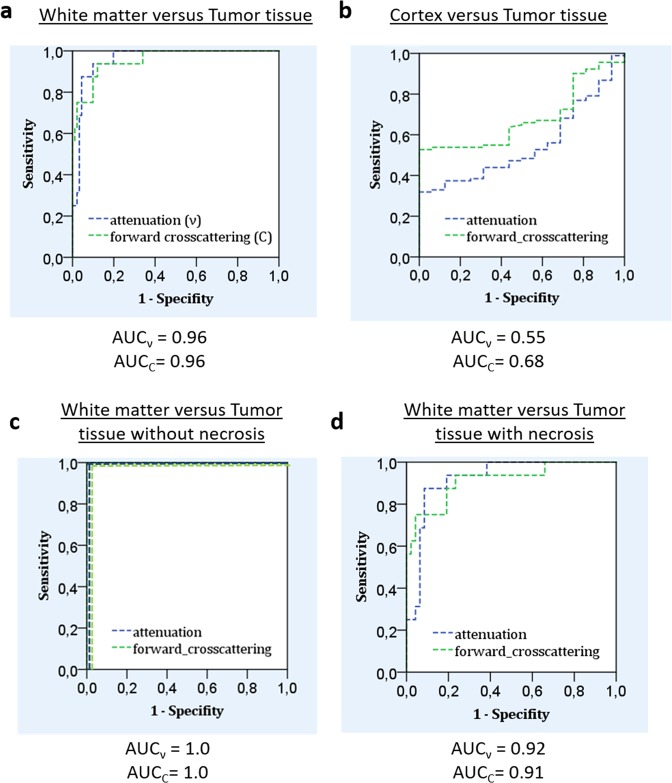
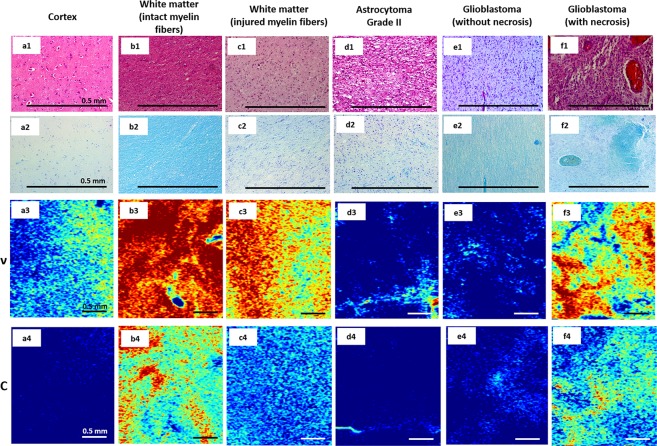
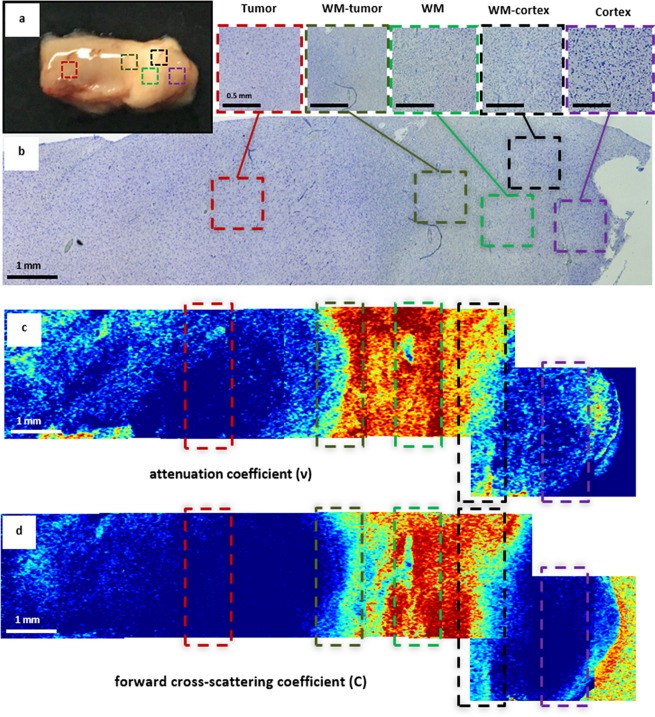
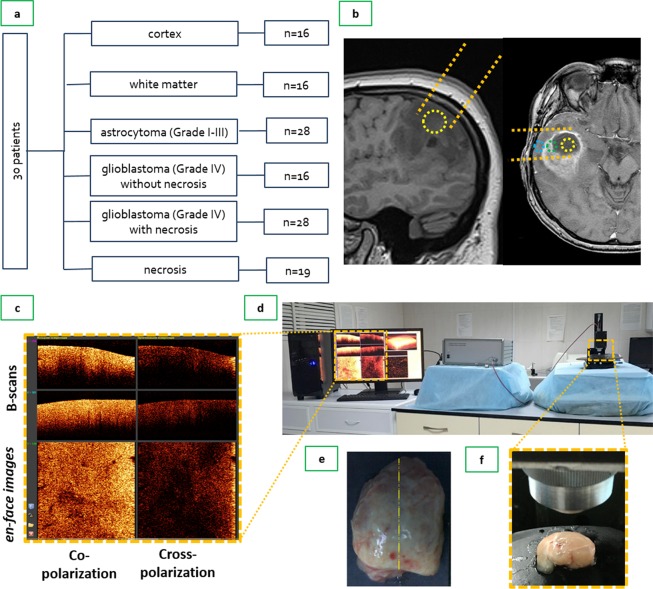
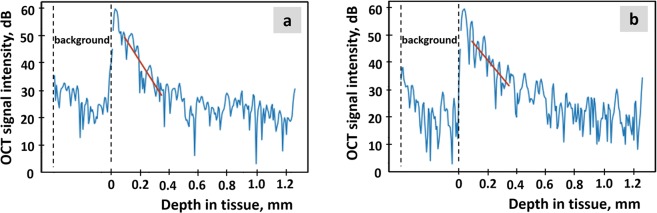
Optical coherence tomography (OCT) is a promising method for detecting cancer margins during tumor resection. This study focused on differentiating tumorous from nontumorous tissues in human brain tissues using cross-polarization OCT (CP OCT). The study was performed on fresh ex vivo human brain tissues from 30 patients with high- and low-grade gliomas. Different tissue types that neurosurgeons should clearly distinguish during surgery, such as the cortex, white matter, necrosis and tumorous tissue, were separately analyzed. Based on volumetric CP OCT data, tumorous and normal brain tissue were differentiated using two optical coefficients - attenuation and forward cross-scattering. Compared with white matter, tumorous tissue without necrotic areas had significantly lower optical attenuation and forward cross-scattering values. The presence of particular morphological patterns, such as necrosis and injured myelinated fibers, can lead to dramatic changes in coefficient values and create some difficulties in differentiating between tissues. Color-coded CP OCT maps based on optical coefficients provided a visual assessment of the tissue. This study demonstrated the high translational potential of CP OCT in differentiating tumorous tissue from white matter. The clinical use of CP OCT during surgery in patients with gliomas could increase the extent of tumor resection and improve overall and progression-free survival.


Conflict of interest statement

The authors declare no competing interests.

Figures

Figure 1
Figure 1
The distribution of attenuation (a) and forward cross-scattering (b) coefficients values between different tissue types. Data are presented as medians with 25th and 75th percentile values. *Significant differences between white matter and other groups; #significant differences between the cortex and other groups.
Figure 2
Figure 2
ROC analysis of optical coefficient data for white matter and tumors in general (a), cortex and tumor (b), white matter and tumor without a necrosis component (c), white matter and tumor with a necrosis component (d).
Figure 3
Figure 3
Color-coded maps and corresponding histology of tumorous and normal brain tissues. Based on attenuation (ν) (a3f3) and forward cross-scattering (С) (a4f4) coefficients, en face color-coded maps of the cortex (a1a4), white matter with intact (b1b4) and injured (c1c4) myelin fibers, astrocytoma grade II (d1d4), glioblastoma grade IV with necrosis (e1e4) and without necrosis (f1f4) corresponding to histology in HE (a1f1) and Luxol blue (a2f2) staining.
Figure 4
Figure 4
Color-coded maps based on attenuation coefficients (c) and forward cross-scattering coefficients on a logarithmic scale (d) with corresponding histology (b) of a brain specimen (a). The areas of interest are marked on each image by different colors: white matter (green dotted line), astrocytoma Grade II (red dotted line), cortex (violet dotted line), margins between white matter and tumors (dark green dotted line); cortex and tumors (black dotted line), and corresponding histology (b) where the areas of interest are presented under high magnification and marked with the corresponding colors. Histological images (b), Luxol blue staining. WM — white matter.
Figure 5
Figure 5
Design of the CP OCT study: (а) the study was performed on material from operative biopsies as follows: 30 patients with gliomas of different grades of malignancy; in total, 123 ex vivo specimens were analyzed; (b) MRI image of astrocytoma grade II (left) and glioblastoma grade IV (right) with outlining trajectory of surgical approach (orange dotted lines) and the areas of tissue sampling: area within the yellow dotted line — center of the tumor; area within green dotted line — peritumoral area; area within blue dotted line — edge of the resection (nontumorous tissue at the place of access to the tumor); (c) enlarged part of monitor with B-scans and en face OCT images in co- and cross-polarization; (d) working area for CP OCT scanning with the CP OCT device and on-mount optical probe; (e) resected specimen with schematic markings of the scanning area along the central line (yellow dotted line); (f) position of contactless forward-looking optic fiber CP OCT probe above the sample.
Figure 6
Figure 6
A-scans in co- (a) and cross-polarizations (b) of a white matter sample on a logarithmic scale (blue lines) and corresponding linear fits (red lines). The attenuation in co-polarization is 4.9 mm−1, and the attenuation in cross-polarization is 3.0 mm−1. The difference in attenuation coefficients in both polarizations is believed to be caused by forward cross-scattering and is used as a second optical characteristic of the tissue.

References

    1. Kohler BA, et al. Annual report to the nation on the status of cancer, 1975-2007, featuring tumors of the brain and other nervous system. Journal of the National Cancer Institute. 2011;103:714–736. doi: 10.1093/jnci/djr077. - DOI - PMC - PubMed
    1. Ostrom QT, et al. CBTRUS statistical report: Primary brain and central nervous system tumors diagnosed in the United States in 2006-2010. Neuro-oncology. 2013;15(Suppl 2):ii1–56. doi: 10.1093/neuonc/not151. - DOI - PMC - PubMed
    1. Almeida, J. P., Chaichana, K. L., Rincon-Torroella, J. & Quinones-Hinojosa, A. The Value of Extent of Resection of Glioblastomas: Clinical Evidence and Current Approach. Current Neurology and Neuroscience Reports15, 10.1007/s11910-014-0517-x (2014). - PubMed
    1. Sanai N, Berger MS. Glioma Extent of Resection and Its Impact on Patient Outcome. Neurosurgery. 2008;62:753–766. doi: 10.1227/01.neu.0000318159.21731.cf. - DOI - PubMed
    1. Sanai N, Polley M-Y, McDermott MW, Parsa AT, Berger MS. An extent of resection threshold for newly diagnosed glioblastomas. Journal of Neurosurgery. 2011;115:3–8. doi: 10.3171/2011.2.jns10998. - DOI - PubMed

Publication types