. 2019 Feb 14;9(1):2074.
doi: 10.1038/s41598-019-38546-2.

Autofluorescence is a Reliable in vitro Marker of Cellular Senescence in Human Mesenchymal Stromal Cells

Affiliations

Autofluorescence is a Reliable in vitro Marker of Cellular Senescence in Human Mesenchymal Stromal Cells

Alessandro Bertolo et al. Sci Rep. .

Abstract

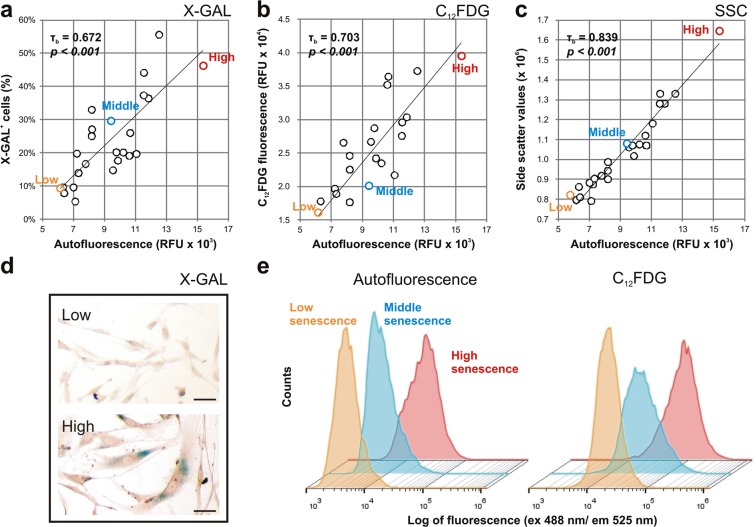
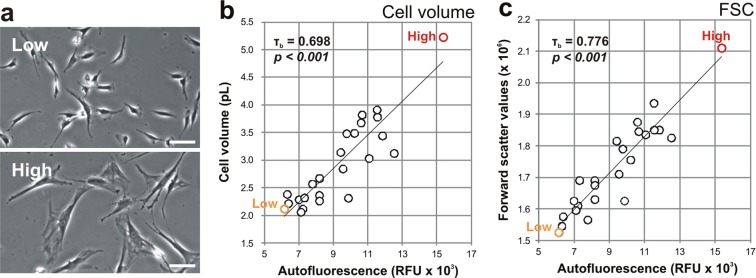
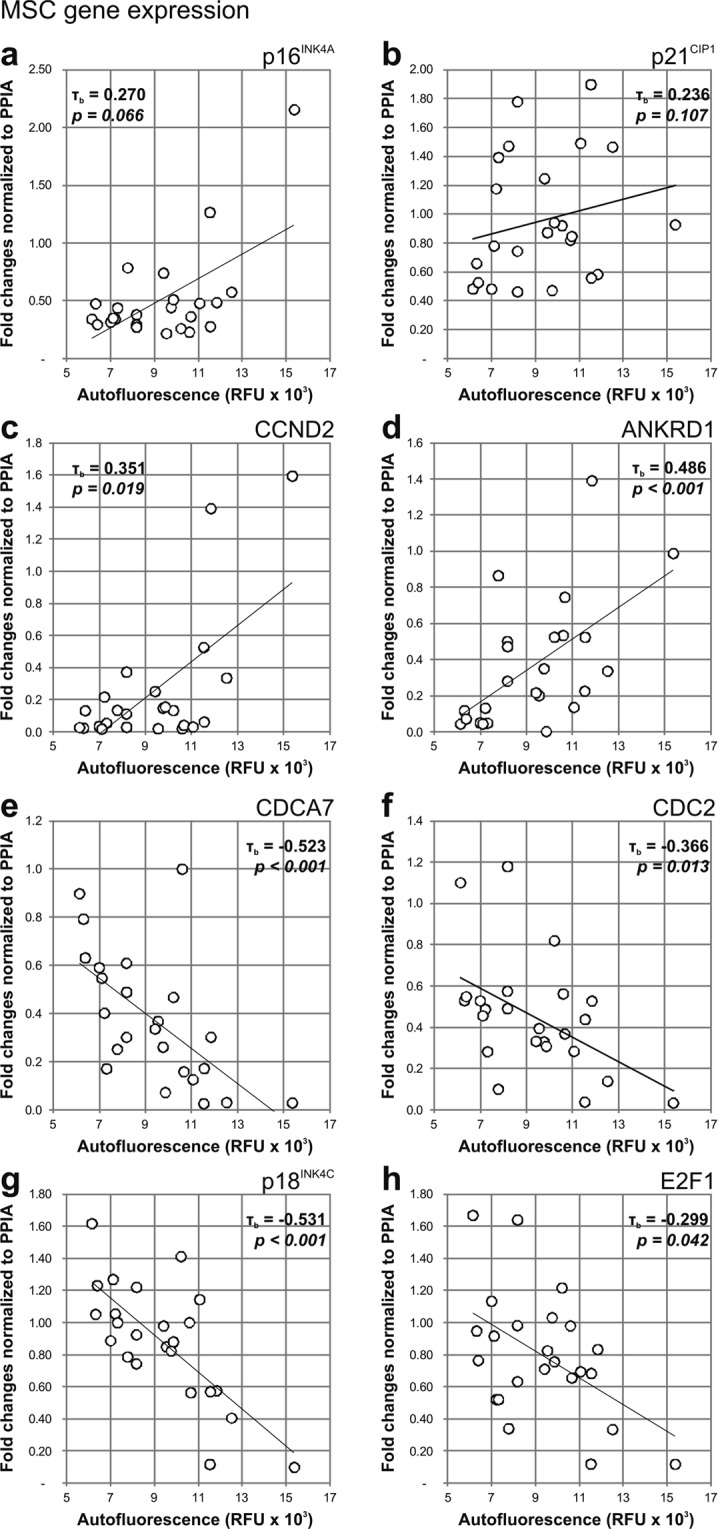
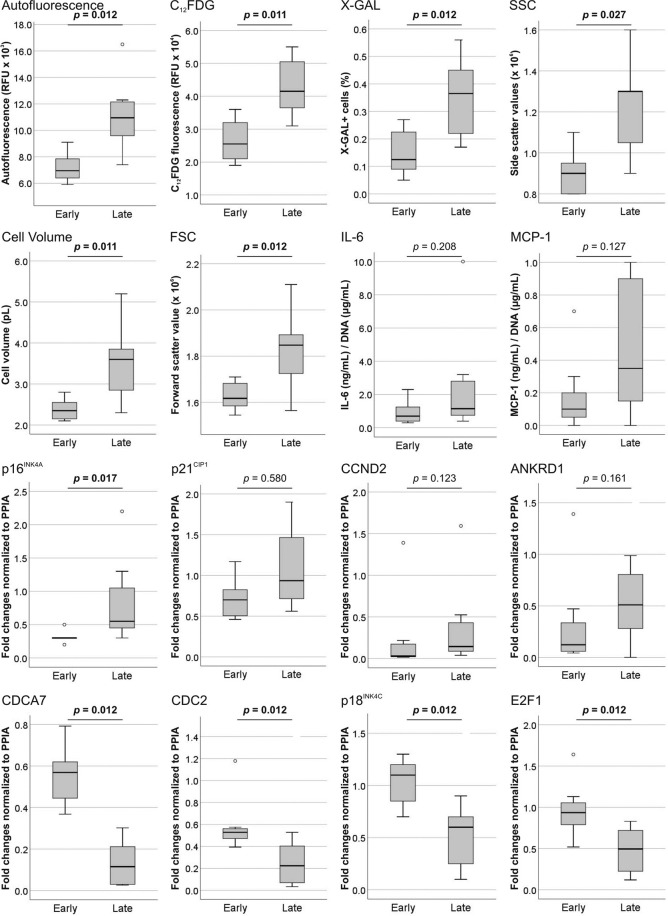
Mesenchymal stromal cells (MSC) are used in cell therapies, however cellular senescence increases heterogeneity of cell populations and leads to uncertainty in therapies' outcomes. The determination of cellular senescence is time consuming and logistically intensive. Here, we propose the use of endogenous autofluorescence as real-time quantification of cellular senescence in human MSC, based on label-free flow cytometry analysis. We correlated cell autofluorescence to senescence using senescence-associated beta-galactosidase assay (SA-β-Gal) with chromogenic (X-GAL) and fluorescent (C12FDG) substrates, gene expression of senescence markers (such as p16INK4A, p18INK4C, CCND2 and CDCA7) and telomere length. Autofluorescence was further correlated to MSC differentiation assays (adipogenesis, chondrogenesis and osteogenesis), MSC stemness markers (CD90/CD106) and cytokine secretion (IL-6 and MCP-1). Increased cell autofluorescence significantly correlated with increased SA-β-Gal signal (both X-GAL and C12FDG substrates), cell volume and cell granularity, IL-6/MCP-1 secretion and with increased p16INK4A and CCND2 gene expression. Increased cell autofluorescence was negatively associated with the expression of the CD90/CD106 markers, osteogenic and chondrogenic differentiation potentials and p18INK4C and CDCA7 gene expression. Cell autofluorescence correlated neither with telomere length nor with adipogenic differentiation potential. We conclude that autofluorescence can be used as fast and non-invasive senescence assay for comparing MSC populations under controlled culture conditions.


Conflict of interest statement

The authors declare no competing interests.

Figures

Figure 1
Figure 1
Correlation of MSC autofluorescence with senescence-associated markers. The autofluorescence of MSC (n = 24) correlated positively to SA-β-Gal assay, measured by (a) chromogenic- (X-GAL) and (b) fluorogenic– (C12FDG) substrates, and also correlated to (c) side scatter values (SSC). Autofluorescence, C12FDG and SSC values are represented as the geometric mean of the population, while X-GAL values as percent of positive cells in the MSC population. Representative (d) X-GAL stainings and (e) flow cytometry analysis, with and without C12FDG, are shown for samples of low, middle and high senescent populations. Scale bar = 50 µm.
Figure 2
Figure 2
Correlation of MSC autofluorescence with cell size. Morphological differences of low and high senescent MSC cultures are shown. (a) Scale bar is 50 µm. The autofluorescence of MSC (n = 24) was positively correlating with (b) cell volume and (c) forward scatter values (FSC). Autofluorescence and FSC values are represented as the geometric mean of the population, while cell volume as the mean.
Figure 3
Figure 3
Correlation of MSC autofluorescence with the gene expression of senescence markers. The autofluorescence of MSC (n = 24) was positively correlating to the gene expression levels of (a) p16INK4A, (b) CCND2, (c) ANKRD1, but not of (d) p21CIP1. Conversely, autofluorescence of MSC was negatively correlating to (e) CDCA7, (f) CDC2, (g) p18INK4C and (h) E2F1. Gene expression was normalized to PPIA, and each sample represents the mean expression. Autofluorescence values are represented as the geometric mean of the population.
Figure 4
Figure 4
Correlation of MSC autofluorescence with cellular senescence markers. The autofluorescence of MSC (n = 24) was positively correlating to the mean cell secretion in culture media of (a) IL-and (b) MCP-1. No correlation between cell autofluorescence and (c) donors’ age (only early passage MSC, from P1 to P4, n = 16), and (d) telomere length was observed. Autofluorescence values are represented as the geometric mean of the population.
Figure 5
Figure 5
Correlation of MSC autofluorescence and cell differentiation potentials. The autofluorescence of MSC (n = 24) was weakly correlating to the proportion of CD90+/CD106+ cells within the population. (a) The adipogenic potential of MSC had no correlation with cell autofluorescence (b), while chondrogenic (c) and osteogenic (d) potentials were negatively correlated to cell autofluorescence. Autofluorescence values are represented as the geometric mean of the population. Images of representative low and high senescent populations are shown beside the graphs. Differentiated cultures were stained for fat vacuole formation in red (Oil red O), accumulation of proteoglycan in blue (alcian blue staining) and calcium in black (von Kossa staining) respectively. Scale bar = 100 µm.
Figure 6
Figure 6
Changes in MSC senescence markers occurring with prolonged in vitro culture. The expression of senescence markers was compared in MSC (n = 8) at early (P1 to P4) and late (P6 to P15) passages. The analysis was conducted by comparing cellular autofluorescence, fluorescent (C12FDG) and chromogenic (X-GAL) SA-β-Gal activity, cellular granularity (SSC), cell size - as a measure of cell volume and forward scatter values (FSC) -, telomere length, the proportion CD90/CD106 positive cells (stemness markers), gene expression (CDCA7, CDC2, p18INK4C, E2F1, p16INK4A) and the differentiation potential of MSC (adipogenic, chondrogenic and osteogenic potentials). Non-parametric test (Mann-Whitney U-test) was used to determine the significance levels.
Figure 7
Figure 7
Western blot analysis of lipofuscin-related proteins. The protein expression of GGH, FAM96B and HDGFL1 was compared in low (early passages) and high (late passages) autofluorescent MSC. (a) Data was quantified and normalized to β-actin expression. (b) Results are represented as fold changes compared to the respective low autofluorescence MSC (red dotted line). (n = 3; values represent the mean ± SEM).
Figure 8
Figure 8
Correlation of MSC autofluorescence with SA-β-Gal activity under different culture conditions. MSC were grown either in high glucose DMEM/Ham’s F12 (4.5 g/L glucose) and normoxia (~21% O2), or in growing medium DMEM/Ham’s F12 (3.1 g/L glucose) and hypoxia (5% O2). For each donor (n = 6), cells in the respective cultures were sampled after 3, 5 and 7 days and results were compared to growing medium in normoxia (control).
Figure 9
Figure 9
Correlation of cellular autofluorescence and SA-β-Gal activity in other cell types. The correlation between autofluorescence and SA-β-Gal activity (with fluorescent substrate C12FDG) was tested in (a–c) lymphocytes (n = 12) and (d–f) adipose-derived MSC (ADSC; n = 12). Gated lymphocytes (a) and ADSC (e) were selected base on their viability (b,e), and the correlation between cellular autofluorescence and (c,f) SA-β-Gal activity was established. Autofluorescence and C12FDG values are represented as the geometric mean of the population.

References

    1. Schallmoser K, et al. Rapid large-scale expansion of functional mesenchymal stem cells from unmanipulated bone marrow without animal serum. Tissue Eng Part C Methods. 2008;14:185–196. doi: 10.1089/ten.tec.2008.0060. - DOI - PubMed
    1. Colter DC, Class R, DiGirolamo CM, Prockop DJ. Rapid expansion of recycling stem cells in cultures of plastic-adherent cells from human bone marrow. Proc Natl Acad Sci USA. 2000;97:3213–3218. doi: 10.1073/pnas.97.7.3213. - DOI - PMC - PubMed
    1. Pittenger MF, et al. Multilineage potential of adult human mesenchymal stem cells. Science. 1999;284:143–147. doi: 10.1126/science.284.5411.143. - DOI - PubMed
    1. Nauta AJ, Fibbe WE. Immunomodulatory properties of mesenchymal stromal cells. Blood. 2007;110:3499–3506. doi: 10.1182/blood-2007-02-069716. - DOI - PubMed
    1. Kyurkchiev D, et al. Secretion of immunoregulatory cytokines by mesenchymal stem cells. World J Stem Cells. 2014;6:552–570. doi: 10.4252/wjsc.v6.i5.552. - DOI - PMC - PubMed

Publication types

MeSH terms