. 2019 Feb 14;9(1):2054.
doi: 10.1038/s41598-019-38625-4.

Intravital imaging of glioma border morphology reveals distinctive cellular dynamics and contribution to tumor cell invasion

Affiliations

Intravital imaging of glioma border morphology reveals distinctive cellular dynamics and contribution to tumor cell invasion

Maria Alieva et al. Sci Rep. .

Abstract

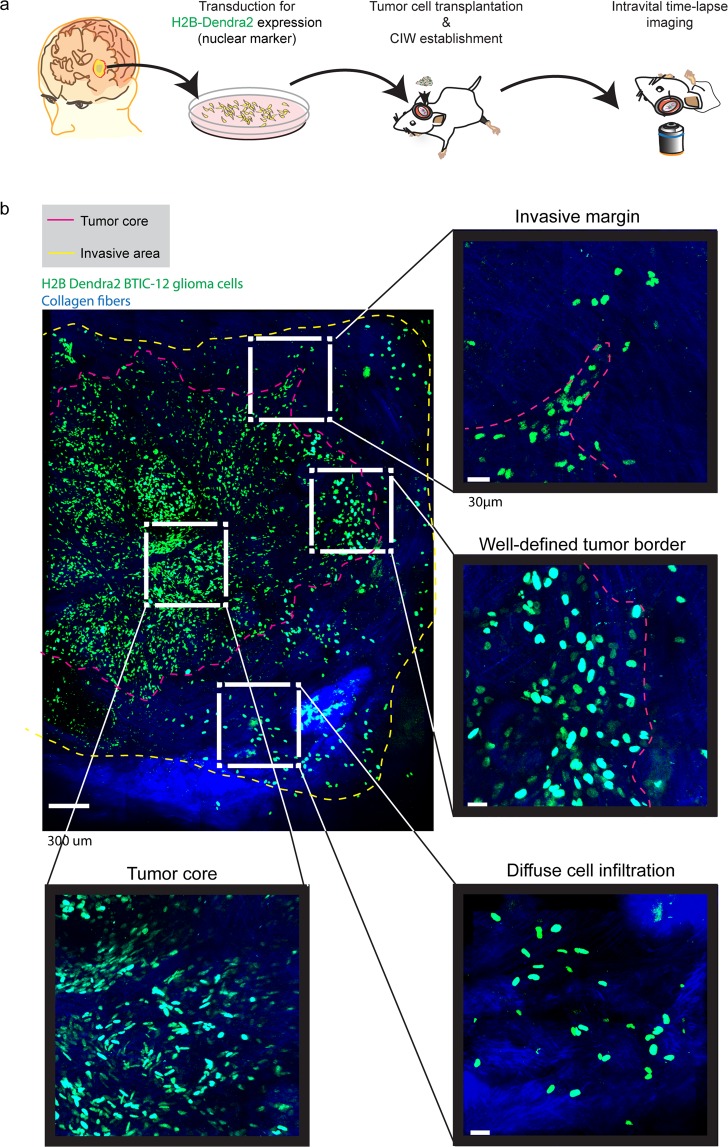
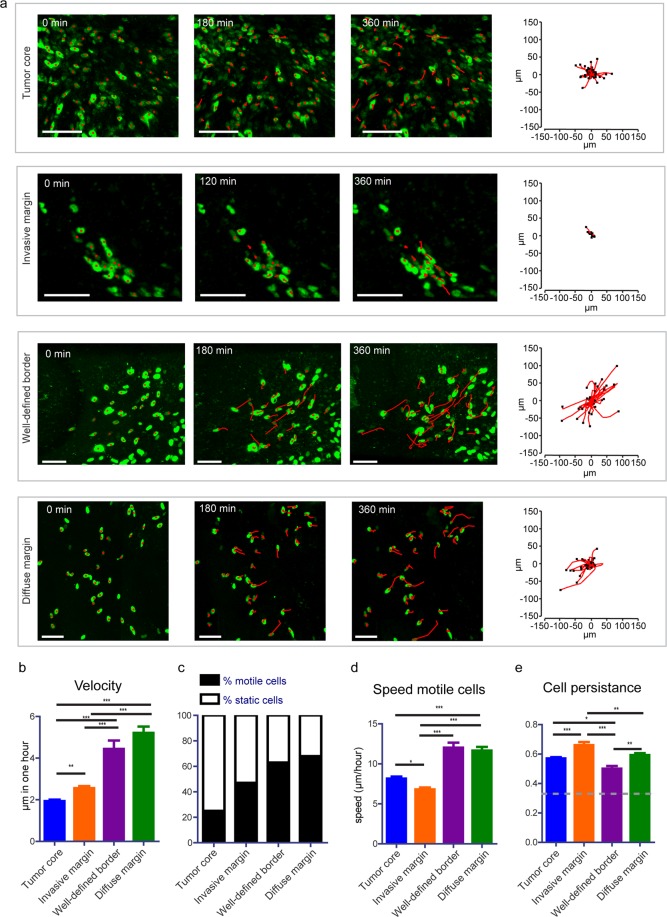
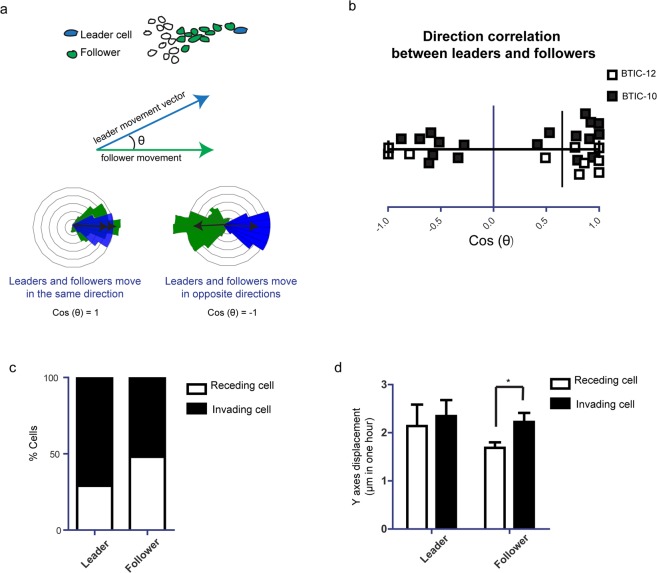
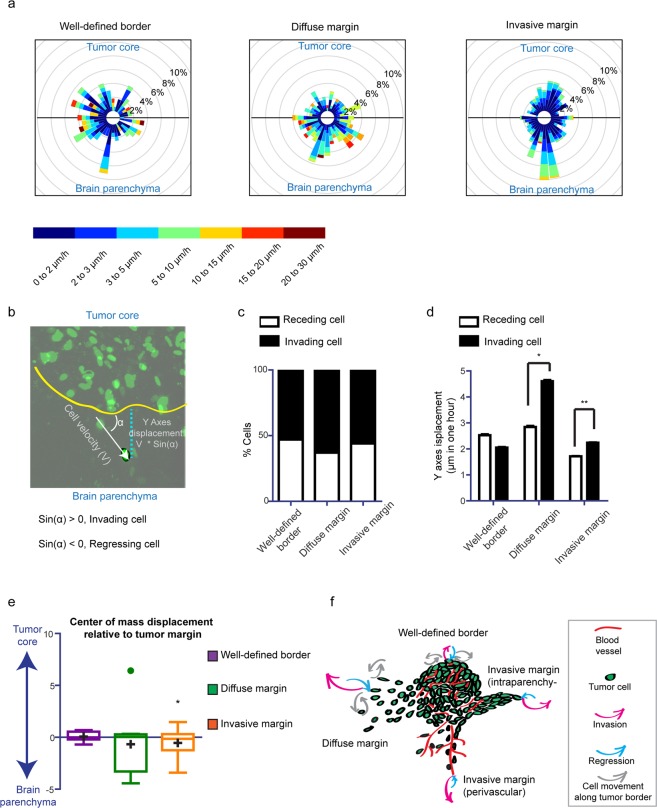
The pathogenesis of glioblastoma (GBM) is characterized by highly invasive behavior allowing dissemination and progression. A conclusive image of the invasive process is not available. The aim of this work was to study invasion dynamics in GBM using an innovative in vivo imaging approach. Primary brain tumor initiating cell lines from IDH-wild type GBM stably expressing H2B-Dendra2 were implanted orthotopically in the brains of SCID mice. Using high-resolution time-lapse intravital imaging, tumor cell migration in the tumor core, border and invasive front was recorded. Tumor cell dynamics at different border configurations were analyzed and multivariate linear modelling of tumor cell spreading was performed. We found tumor border configurations, recapitulating human tumor border morphologies. Not only tumor borders but also the tumor core was composed of highly dynamic cells, with no clear correlation to the ability to spread into the brain. Two types of border configurations contributed to tumor cell spreading through distinct invasion patterns: an invasive margin that executes slow but directed invasion, and a diffuse infiltration margin with fast but less directed movement. By providing a more detailed view on glioma invasion patterns, our study may improve accuracy of prognosis and serve as a basis for personalized therapeutic approaches.


Conflict of interest statement

The authors declare no competing interests.

Figures

Figure 1
Figure 1
Tumor border configuration in the interphase between normal brain and tumor core. (a) Schematic overview of the experimental setup. Patient derived BTIC lines expressing H2B Dendra2 where implanted in the brain of NSG mice. Time-lapse intravital imaging was performed through a CIW to study the invasive behavior of single tumor cells. (b) Representative 3D reconstructed tile-scan showing distinct tumor border configurations. Shown are H2B expressing BTICs in green, collagen fibers in blue. The dotted pink line delineates the tumor core, while the dotted yellow line delineates the tumor cell invasive area. Scale bar = 300 μm.
Figure 2
Figure 2
Migratory behavior of tumor cells at different border configurations. (a) Representative still images from a time-lapse movie showing migrating tumor cells from different border configurations. Red lines highlight individual tumor cell tracks. Scale bar = 100 μm. Corresponding plots show tracks with a common origin. (b) Quantification of cell velocity for the indicated border and tumor core configurations. The data is shown as mean ± S.E.M. (c) Percentage of motile (cell velocity > 2 μm/hour) and static cells for each condition. (d) Speed of motile cells at the indicated border and tumor core configurations. Data is shown as mean ± S.E.M., n = 7 mice (BTIC-10 and BTIC-12 lines). (e) Persistence of motile cells at the indicated border and tumor core configurations. The data is shown as mean ± S.E.M, n = 7 mice (BTIC-10 and BTIC-12 lines). *p < 0.05, **p < 0.01, ***p < 0.0001, one-way ANOVA with Tukey’s post hoc test.
Figure 3
Figure 3
Role of spatial cell arrangements in invasive margin migratory behavior. (a) Schematic representation how the correlation of direction between leader and follower cells of the invasive margin was quantified. (b) Quantification of direction correlation between leader and follower cells. n = 7. Black squares show BTIC-10 line. White squares show BTIC-12 line. nsp > 0.05, one sample Student’s t, hypothetical value = 0. (c) Percentage of invading and regressing cells for each condition, n = 7 (BTIC-10 and BTIC-12). (d) Quantification of Y-axes displacement for the invading/regressing cells of each condition, n = 7 (BTIC-10 and BTIC-12). *p < 0.05, Student’s t test. For leader and follower cells invading cells versus receding cells were tested.
Figure 4
Figure 4
Direction of cell movement at different tumor border configurations. (a) Wind rose plot representing the percentage of cells migrating in the direction of a leaflet for each tumor border configuration. Color scale indicates migration speed, n = 7 (BTIC-10 and BTIC-12). (b) Schematic representation of Y-axes cell displacement quantification. (c) Percentage of invading and regressing cells for each condition, n = 7 (BTIC-10 and BTIC-12). (d) Quantification of the Y-axes velocity for invading and regressing cells of each condition, respectively, n = 7 (BTIC-10 and BTIC-12), *p < 0.05, Student’s t test. For each border configuration invading cells versus regressing cells were tested. (e) Tukey-style whiskers plot of the center of mass displacement of individual positions of each condition. Boxes indicate the interquartile range, crosses indicate the mean, and dots indicate outliers. n = 7 (BTIC-10 and BTIC-12), *p < 0.05, one sample Student’s t test, hypothetical value = 0. When the center of mass does not change in respect to its initial position it is considered to be 0. The one sample Student´s t test determines if the mean of the center of mass displacement (COMd) of the positions belonging to the distinct border types is different from 0. COMd > 0: overall the cells in this type of position move towards the tumor core. COMd < 0: overall the cells in this type of position move away from the tumor core. (f) Schematic illustration of the model showing cell dynamics at different tumor border configurations.

References

    1. Omuro A, DeAngelis LM. Glioblastoma and Other Malignant Gliomas: A Clinical Review. JAMA. 2013;310:1842–1850. doi: 10.1001/jama.2013.280319. - DOI - PubMed
    1. Stupp R, et al. Effects of radiotherapy with concomitant and adjuvant temozolomide versus radiotherapy alone on survival in glioblastoma in a randomised phase III study: 5-year analysis of the EORTC-NCIC trial. Lancet Oncol. 2009;10:459–466. doi: 10.1016/S1470-2045(09)70025-7. - DOI - PubMed
    1. Stupp R, et al. Maintenance Therapy With Tumor-Treating Fields Plus Temozolomide vs Temozolomide Alone for Glioblastoma. Jama. 2015;314:2535. doi: 10.1001/jama.2015.16669. - DOI - PubMed
    1. Stupp R, et al. Effect of tumor-treating fields plus maintenance temozolomide vs maintenance temozolomide alone on survival in patients with glioblastoma a randomized clinical trial. JAMA - J. Am. Med. Assoc. 2017;318:2306–2316. doi: 10.1001/jama.2017.18718. - DOI - PMC - PubMed
    1. Verhaak RGW, et al. Integrated genomic analysis identifies clinically relevant subtypes of glioblastoma characterized by abnormalities in PDGFRA, IDH1, EGFR, and NF1. Cancer Cell. 2010;17:98–110. doi: 10.1016/j.ccr.2009.12.020. - DOI - PMC - PubMed

Publication types

MeSH terms