. 2019 Feb 14;9(1):2133.
doi: 10.1038/s41598-019-38603-w.

Ex vivo organotypic culture system of precision-cut slices of human pancreatic ductal adenocarcinoma

Affiliations

Ex vivo organotypic culture system of precision-cut slices of human pancreatic ductal adenocarcinoma

Sougat Misra et al. Sci Rep. .

Abstract

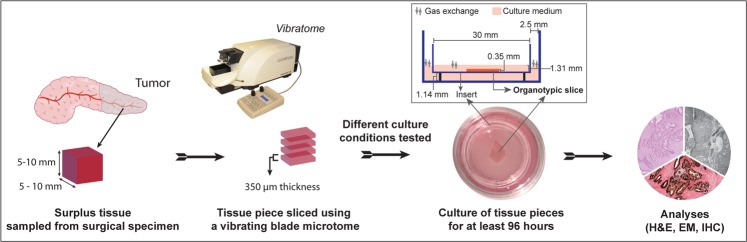
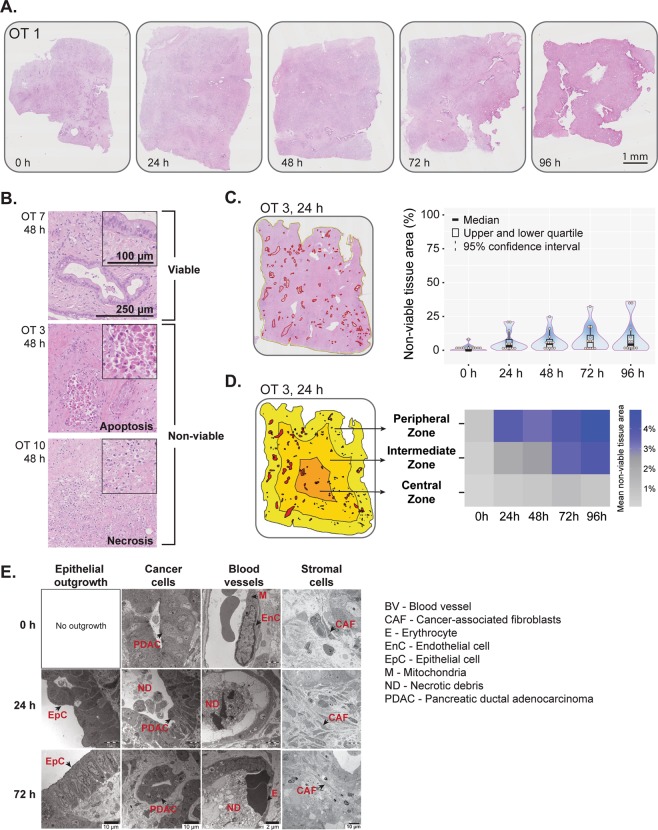
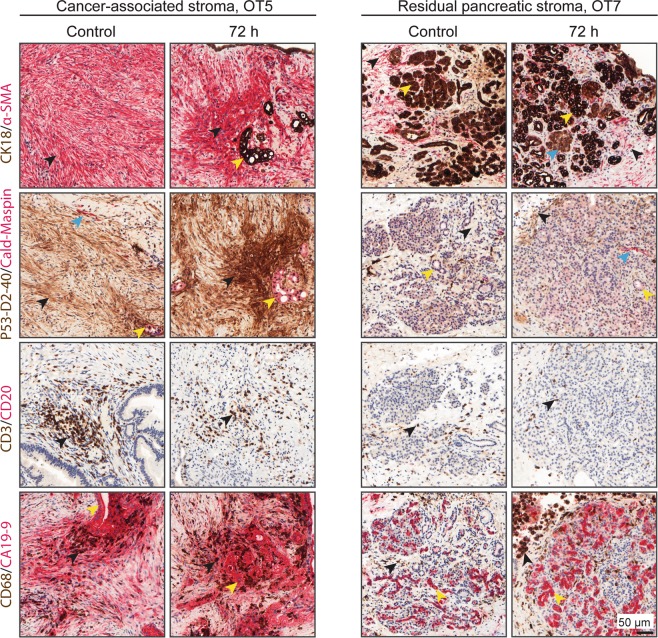
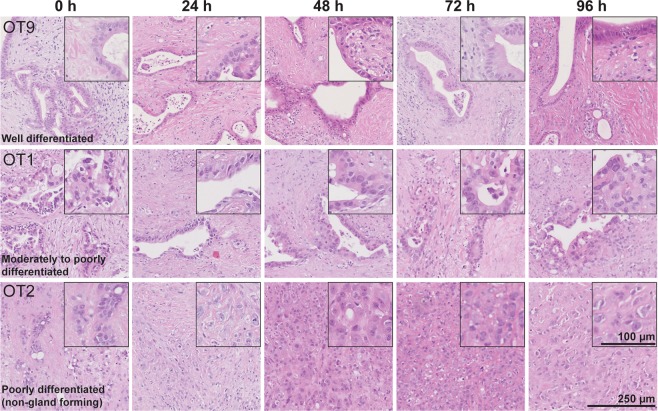
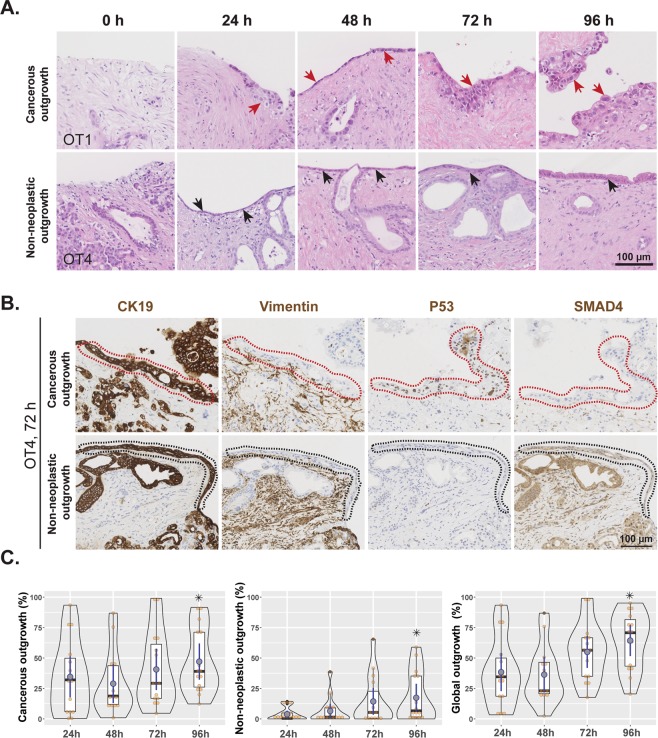
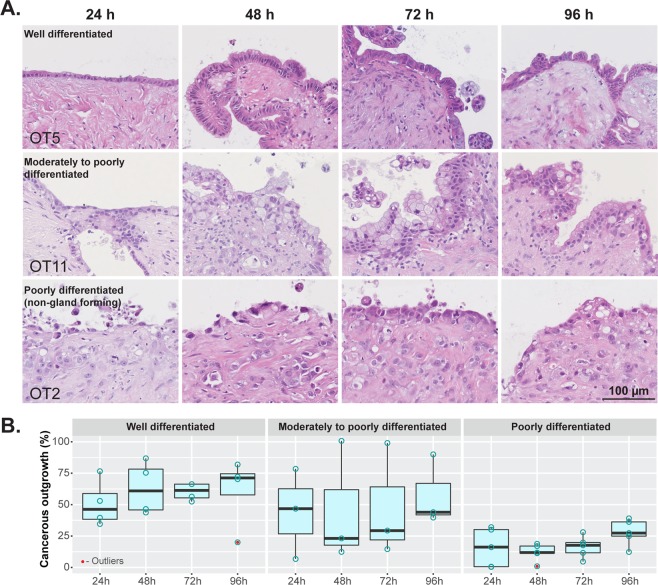
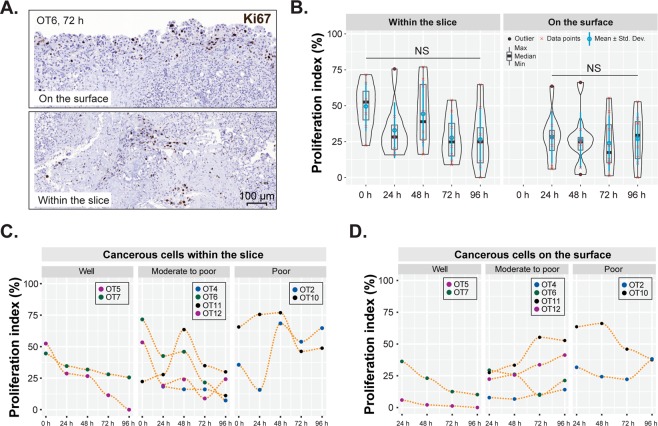
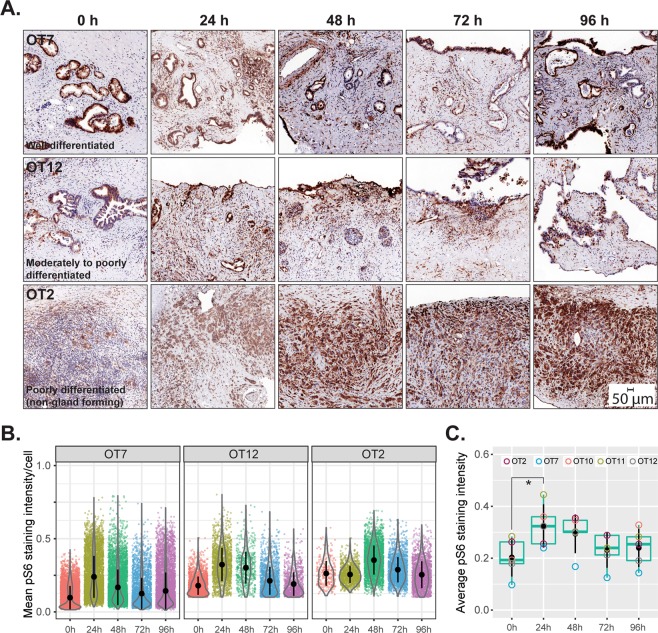
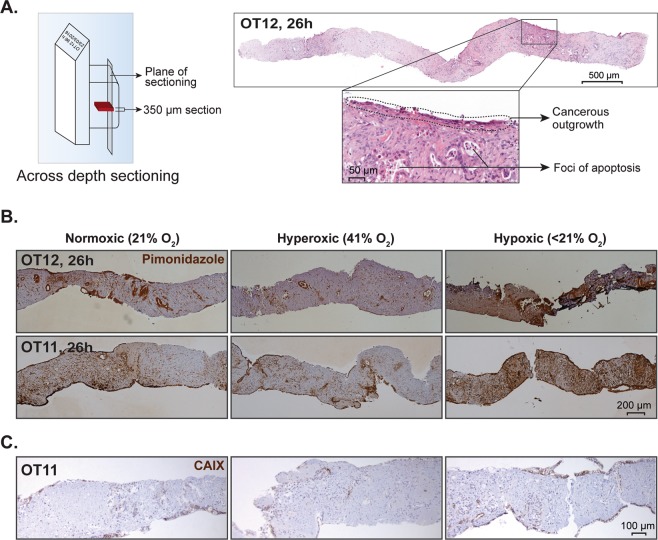
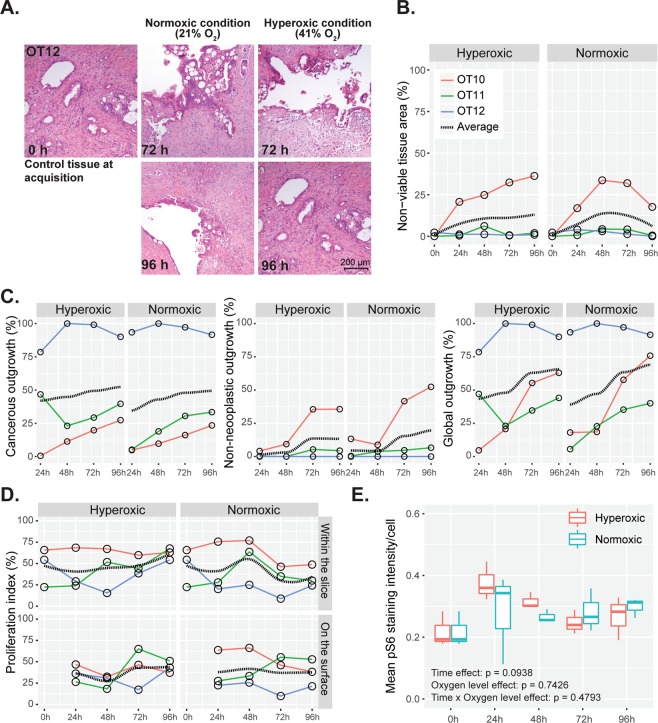
Pancreatic ductal adenocarcinoma (PDAC) has a poor prognosis, which is mainly due to late diagnosis and profound resistance to treatment. The latter is to a large extent attributed to the tumor stroma that is exceedingly prominent in PDAC and engages in complex interactions with the cancer cells. Hence, relevant preclinical models of PDAC should also include the tumor stroma. We herein describe the establishment and functional validation of an ex vivo organotypic culture of human PDAC that is based on precision-cut tissue slices from surgical specimens and reproducibly recapitulates the complex cellular and acellular composition of PDAC, including its microenvironment. The cancer cells, tumor microenvironment and interspersed remnants of nonneoplastic pancreas contained in these 350 µm thick slices maintained their structural integrity, phenotypic characteristics and functional activity when in culture for at least 4 days. In particular, tumor cell proliferation persisted and the grade of differentiation and morphological phenotype remained unaltered. Cultured tissue slices were metabolically active and responsive to rapamycin, an mTOR inhibitor. This culture system is to date the closest surrogate to the parent carcinoma and harbors great potential as a drug sensitivity testing system for the personalized treatment of PDAC.


Conflict of interest statement

The authors declare no competing interests.

Figures

Figure 1
Figure 1
Diagram depicting the workflow of preparation, culturing and analysis of precision-cut tissue slices. Inset: A technical drawing (not to scale) showing the dimensions of different components of organotypic slice culture. In the adapted method, the membrane of the insert raised the deep aspect of the tissue slices approximately 1.14 mm from the bottom of the culture well. The tissue slices were submerged in medium (height ~1.31 mm), leaving ~1.0 mm of space for medium to cover the slices, thereby keeping the diffusion distance at a minimum. The space between the insert and the culture dish provided a surface area of ~255 mm2, allowing direct gas exchange between the ambient milieu and the culture medium.
Figure 2
Figure 2
Tissue viability and structural integrity. (A) Representative overview images of H&E-stained whole tissue slices. See Figure S1 for high magnification images. (B) Representative H&E-stained tissue slices showing viable tissue and foci of apoptosis and necrosis. (C) Left panel, Digital annotation of non-viable tissue areas within the slice. Red annotated areas indicate non-viable tissue. Right panel, Quantification of non-viable tissue areas during culture time (n = 12; Friedman test followed by Dunn’s multiple comparison; p > 0.05). In the violin plot, the central band, box and whiskers represent median value, interquartile range, and maximum and minimum values, respectively. (D) Schematic diagram showing the annotation of a whole slice into 3 separate zones - peripheral, intermediate and central, each with a width of one-third of the tissue slice diameter. The heatmap shows spatial distribution of mean non-viable tissue areas (%) in the 3 zones with respect to culture time. The scale indicates mean values. (E) Representative transmission electron photomicrographs (n = 3) of control (0 h) and cultured slices (24 h and 72 h) depicting morphological alterations of epithelial outgrowth, cancer cells, blood vessels and stromal components during culture.
Figure 3
Figure 3
Immunohistochemical profiles of stromal cells. Both cancer-associated and residual pancreatic stroma retained the expression of their characteristic immunohistochemical markers over the course of the culture period. Cancer-associated stroma: Cancer-associated fibroblasts are stained with α-smooth muscle actin (α-SMA) and D2-40 (black arrows). Sparse smooth muscle cells are positive for caldesmon (blue arrows). Clusters of PDAC cells are positive for CK18, maspin, P53, and CA19-9 (yellow arrows). Note that there is also CA19-9 immunoreactivity in the stroma surrounding PDAC cells. CD3-positive T-cells and CD68-positive macrophages are also present in the stroma (black arrows). Residual pancreatic stroma: Myofibroblasts in residual, partially atrophic pancreatic lobuli are positive for α-SMA (black arrows). Acinar, ductal (yellow arrows), and endocrine (blue arrow) epithelial cells are stained with CK18. Lobular stroma is negative or minimally positive for D2-40 (black arrows). In contrast to PDAC cells, non-neoplastic ducts are negative for both maspin and P53 (yellow arrows). Sparse CD3-positive T-cells and variable numbers of CD68-positive macrophages are also present (black arrows). Small, non-neoplastic ductal structures are positive for CA19-9 (yellow arrows).
Figure 4
Figure 4
Tumor morphology and grade of differentiation. PDACs retained their histological and cytological features and grade of differentiation during the entire culture period (H&E staining).
Figure 5
Figure 5
Cellular outgrowth onto the tissue surface. (A) Representative H&E-stained images showing cancerous (red arrows) and non-neoplastic (black arrows) cell outgrowth at different time points (0 h to 96 h). (B) A representative example of tissue slices with areas of cancerous and non-neoplastic cell outgrowth. Immunohistochemical staining showed that both types of outgrowth were positive for CK19 and negative for vimentin, indicating that outgrowth is of ductal-epithelial origin. Cancerous cell outgrowth (red dotted areas) was positive for P53 and negative for SMAD4, in contrast to the non-neoplastic one (black dotted areas), which was negative for P53 and positive for SMAD4. (C) Comparative analysis of cancerous, non-neoplastic, and global outgrowths at the indicated time points (duplicate slices from each culture, n = 8; Friedman test followed by Dunn’s multiple comparison, p ≤ 0.05; *indicates significant difference compared to 24 h time point). Time point 0 h was omitted from analysis due to the absence of any outgrowth.
Figure 6
Figure 6
Cellular outgrowth and grade of tumor differentiation. (A) Well and moderately to poorly differentiated PDACs formed a continuous cell layer with foci of stratification, limited cytological atypia and varying degrees of loss of polarity. Non-gland forming poorly differentiated PDACs showed a patchy and discohesive cell outgrowth with marked cytological atypia (H&E staining). (B) Differentiation grade-wise quantification of outgrowth of cancerous cells at different time points (n = 3–5; Friedman test followed by Dunn’s multiple comparison, p > 0.05).
Figure 7
Figure 7
Quantification of cancer cell proliferation. (A) Representative examples of Ki67 positivity on the surface (cell outgrowth) and within the tissue slices. (B) Comparison of the proliferation index of cancerous cells within and on the surface of slices at different time points. (n = 8; Friedman test followed by Dunn’s multiple comparison, p > 0.05. (C,D) Proliferation index of PDACs with different grades of differentiation, growing inside the slice and on the slice surface. Poorly differentiated cases refer to non-gland forming tumors.
Figure 8
Figure 8
Metabolic activity. (A) Phosphorylated (Ser235/236) S6 ribosomal protein was used as a marker for the activity of mTOR, a master regulator of cellular metabolism. Positivity for S6 phosphorylation in all tissue slices at all time points indicates continued metabolic activity. (B) Quantitation of pS6 staining intensity in cancerous cells at different time points from the cases depicted in (A). (C) Comparative assessment of metabolic activity (average pS6 staining intensity, n = 5) of cancerous cells in cultured slices over the entire duration of culture (Friedman test followed by Dunn’s multiple comparison; p ≤ 0.05). * indicates significant difference between the given time points.
Figure 9
Figure 9
Schematic diagrams for analysis of tissue oxygenation. (A) Left panel, Vertical, i.e. across depth, tissue sectioning strategy. Right panel, A representative H&E-stained section of a vertically cut tissue slice. Inset demonstrates a higher magnification image with outgrowing cells and small foci of apoptosis. (B) Pimonidazole and (C) CAIX immunostaining of tissue slices cultured in normoxic (21% O2), hyperoxic (41% O2), and hypoxic (<21% O2) conditions.
Figure 10
Figure 10
Tissue viability, cellular outgrowth, proliferation and metabolic activity at different oxygen levels. (A) Comparison of tumor histomorphology under normoxic (21% O2) and hyperoxic (41% O2) conditions at different time points (H&E staining). (B) Tissue viability in paired slices obtained from the same donor samples (n = 3) when cultured under normoxic and hyperoxic conditions. The dotted black line shows the conditional mean smooth curve to demonstrate the pattern of observation under the test conditions. Legend keys are the same for (C,D). (C) Cancerous, non-neoplastic and global cell outgrowths in donor-paired tissue slices (n = 3). (D) Proliferation index of cancerous cells within and on the surface of slices at different time points when donor-matched tissue slices were cultured under normoxic and hyperoxic conditions. (E) Metabolic activity of cancerous cells when cultured under different ambient oxygen levels. (Repeated measure two-way ANOVA followed by Dunn’s multiple comparison; p > 0.05, n = 3).

References

    1. Hariharan D, Saied A, Kocher HM. Analysis of mortality rates for pancreatic cancer across the world. HPB (Oxford) 2008;10:58–62. doi: 10.1080/13651820701883148. - DOI - PMC - PubMed
    1. Rahib L, et al. Projecting cancer incidence and deaths to 2030: the unexpected burden of thyroid, liver, and pancreas cancers in the United States. Cancer Res. 2014;74:2913–2921. doi: 10.1158/0008-5472.CAN-14-0155. - DOI - PubMed
    1. Löhr, J.-M. Pancreatic cancer should be treated as a medical emergency. BMJ: British Medical Journal349 (2014). - PubMed
    1. Wilding JL, Bodmer WF. Cancer cell lines for drug discovery and development. Cancer Res. 2014;74:2377–2384. doi: 10.1158/0008-5472.CAN-13-2971. - DOI - PubMed
    1. Mak IW, Evaniew N, Ghert M. Lost in translation: animal models and clinical trials in cancer treatment. Am J Transl Res. 2014;6:114–118. - PMC - PubMed

Publication types

LinkOut - more resources