. 2019 Jan 31:10:99.
doi: 10.3389/fimmu.2019.00099. eCollection 2019.

CD11c+ Cells Are Gatekeepers for Lymphocyte Trafficking to Infiltrated Islets During Type 1 Diabetes

Affiliations

CD11c+ Cells Are Gatekeepers for Lymphocyte Trafficking to Infiltrated Islets During Type 1 Diabetes

Adam M Sandor et al. Front Immunol. .

Abstract

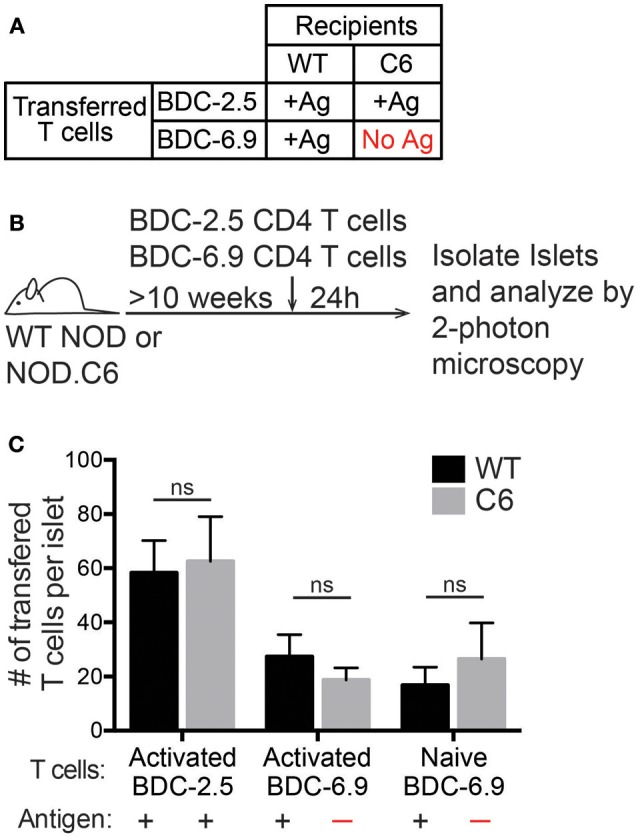
Type 1 diabetes (T1D) is a T cell mediated autoimmune disease that affects more than 19 million people with incidence increasing rapidly worldwide. For T cells to effectively drive T1D, they must first traffic to the islets and extravasate through the islet vasculature. Understanding the cues that lead to T cell entry into inflamed islets is important because diagnosed T1D patients already have established immune infiltration of their islets. Here we show that CD11c+ cells are a key mediator of T cell trafficking to infiltrated islets in non-obese diabetic (NOD) mice. Using intravital 2-photon islet imaging we show that T cell extravasation into the islets is an extended process, with T cells arresting in the islet vasculature in close proximity to perivascular CD11c+ cells. Antigen is not required for T cell trafficking to infiltrated islets, but T cell chemokine receptor signaling is necessary. Using RNAseq, we show that islet CD11c+ cells express over 20 different chemokines that bind chemokine receptors expressed on islet T cells. One highly expressed chemokine-receptor pair is CXCL16-CXCR6. However, NOD. CXCR6-/- mice progressed normally to T1D and CXCR6 deficient T cells trafficked normally to the islets. Even with CXCR3 and CXCR6 dual deficiency, T cells trafficked to infiltrated islets. These data reinforce that chemokine receptor signaling is highly redundant for T cell trafficking to inflamed islets. Importantly, depletion of CD11c+ cells strongly inhibited T cell trafficking to infiltrated islets of NOD mice. We suggest that targeted depletion of CD11c+ cells associated with the islet vasculature may yield a therapeutic target to inhibit T cell trafficking to inflamed islets to prevent progression of T1D.

Keywords: CD11c+ cells; T cell; chemokine; extravasation; lymphocyte trafficking; mononuclear phagocyte cells; type 1 diabetes.


Figures

Figure 1
Figure 1
T cell extravasation into the islets is an extended process. Islet antigen-specific BDC-2.5 T cells were antigen-activated, fluorescently labeled, and transferred 24 h (to determine islet infiltration state, not shown) and immediately prior to imaging (to determine arrest and extravasation, green). Islets were imaged intravitally by 2-photon microscopy. (A) Schematic of experimental setup. (B) Representative islet image (dashed line) with T cells (green) and vascular volume (red). Scale bar = 50 μm. Right: T cell marked with arrow and track of motion is undergoing extravasation into the islet. Yellow arrow indicates completed extravasation. Time stamp = min:sec; Scale bar = 10 μm. (C) Each line represents the distance of the leading edge of one T cell from the surface of the blood vessel. Blue lines represent cells that completed extravasation; red lines represent arrested cells that did not complete extravasation. (D) Frequency of cells that remain arrested, release from arrest, or complete extravasation in mild and advanced infiltrated islets. (E,F) Dots indicate cells that arrested in the vasculature during the imaging period. Bar represents the median. (E) Time for T cell release from arrest in the islet vasculature. (F) Time to complete extravasation. (D–F) n = 6 islets from 5 mice in 5 experiments. (D) Error bars = SEM. *P < 0.05 calculated by Students T-test.
Figure 2
Figure 2
T cells arrest in close proximity to CD11c+ cells in the islet vasculature. Islet antigen-specific BDC-2.5 T cells (blue) were antigen-activated, fluorescently labeled, and transferred into NOD.CD11c-mCherry (green) mice. Islets were imaged intravitally by 2-photon microscopy. Vascular volume was labeled with fluorescent dextran (red). (A) Representative islet outlined by dashed line. Arrow indicates an intravascular T cell. (B,C) 3-Dimensional renderings created from the fluorescence in the boxed region in (A). (B) Optical slice through the vascular lumen shows the T cell extending through the blood vessel wall. (C) Time lapse of T cell shown in (B). Arrow indicates area of contact with perivascular CD11c+ cell (green). (D) Quantification of the percentage of vasculature area in contact with CD11c+ cells (CD11c-vascular contact zone) vs. the percentage intravascular T cells within CD11c-vascular contact zone. Red line indicates the predicted value for percentage of intravascular T cell within CD11c-vascular contact zones if T cell location within the vasculature was random. Error bars = SEM. *P < 0.05 calculated by Students T-test. (E) Analysis of the distance from intravascular T cells to the nearest CD11c+ cell. Bar = median. (D,E) n = 5 islets from 3 mice in 3 experiments.
Figure 3
Figure 3
Antigen is not required for T cell entry into previously infiltrated islets. Islets in WT NOD mice contain the antigens for both BDC-2.5 and BDC-6.9 CD4 T cells. NOD.C6 mice lack the antigen for BDC-6.9 T cells but have the antigen for BDC-2.5 T cells and develop diabetes similar to WT NOD. BDC-2.5 or BDC-6.9 CD4 T cells were activated using αCD3 and αCD28, or naïve BDC-6.9 CD4 T cells were harvested from NOD.C6.BDC-6.9 mice. T cells were differentially fluorescent dye-labeled and co-transferred into NOD WT or C6 mice. Twenty-four hours after T cell transfer, islets were isolated and imaged using 2-photon microscopy to determine the number of transferred T cells that infiltrated the islets. (A) Table of transfer conditions. (B) Schematic of experimental setup. (C) Quantification of the number of islet BDC-2.5 T cells and islet BDC-6.9 T cells with or without antigen present. WT islets n = 25 from 4 experiments. C6 islets n = 18 from 5 experiments. All islets were previously infiltrated. Error bars = SEM. Statistical analysis by Students T-test.
Figure 4
Figure 4
Chemokine receptor signaling is necessary for T cell trafficking to infiltrated islets. Antigen activated BDC2.5 (CD4) and 8.3 (CD8) T cells were treated with 200 ng of pertussis toxin (Ptx) or PBS for 2 h at 37°C and differentially dye-labeled. T cells were co-transferred into 10–16 weeks old female NOD mice. After 24 h ILN, PLN, blood, and pancreatic islets were isolated. The numbers of transferred T cells were determined by flow cytometry. (A) Schematic of experimental setup. (B) Representative flow plots of CD45+ cells comparing trafficking of WT and Ptx treated T cells to islets. Red numbers represent the number of cells in the gate. (C) Ratio of transferred Ptx treated to control T cells in each tissue analyzed. Statistics: One sample T-test with hypothetical value = 1. Error bars = SEM. (D,E) Quantification of the total number of transferred T cells that trafficked to (D) the islets and (E) the non-draining ILN. Statistics: Paired T-test. (C-E) n = 7 mice in 3 experiments for BDC2.5 CD4 T cells; n = 5 mice in 2 experiments for 8.3 CD8 T cells. *P < 0.05;**P < 0.01;***P < 0.001.
Figure 5
Figure 5
Islet CD11c+ cells express chemokines that pair with chemokine receptors on islet T cells. RNAseq was performed on CD11c+ cells (CD45+DAPICD19CD11c+MHC-II+) and T cells (CD45+DAPICD19CD90.2+) that were sorted from the islets of 12–20 wk NOD mice. Analysis of chemokine ligand and chemokine receptor expression in the islets was performed in R. (A,B) Heat map of normalized gene expression from islet CD11c+ cells and islet T cells. (A) Chemokine ligands. (B) Chemokine receptors. (C) Average expression of the top 10 expressed chemokine ligands by islet CD11c+ cells (black) and their receptor expression on islet T cells (red). Error bars = SEM. (D) Representative flow cytometry plot of CXCL16 expression on CD45+ cells in the islets. (E) Representative flow cytometry plots of CXCR6 expression by T cells in the islets.
Figure 6
Figure 6
CXCR6−/− T cells do not have impaired trafficking to NOD islets. NOD WT and CXCR6−/− T cells were activated by αCD3 and αCD28, differentially dye-labeled, and co-transferred into 10–16 week old female NOD mice. After 24 h ILN, PLN, Blood, and pancreatic islets were isolated. Transferred T cells were quantified by flow cytometry. (A) Schematic of experimental setup. (B) Representative flow cytometry plots of CD45+ cells comparing trafficking of WT and CXCR6−/− T cells to the islets. Red numbers represent the number of cells in the gate. (C) Ratio of transferred CXCR6−/− to WT T cells in each tissue analyzed. Statistics: One sample T-test with hypothetical value = 1. (D,E) Number of transferred T cells that trafficked to (D) the islets normalized to the number of islets harvested and (E) to the non-draining ILN. Error bars = SEM. Statistics: Paired T-test. (C-E) n = 7 mice from 3 experiments.
Figure 7
Figure 7
Islet CD11c+ cell depletion is effective and does not affect lymphocyte adhesion to the vasculature. Female NOD CD11c-DTR bone marrow was transferred into irradiated female NOD hosts to make bone marrow chimeras. 10–16 weeks post-reconstitution chimeras were treated twice 24 h apart with 200 ng of diphtheria toxin (DT) or PBS. Twenty-four hours after the second treatment, islets were isolated and digested. (A) Schematic for islet CD11c depletion. (B,C) Islet CD11c+ cell numbers were quantified by flow cytometry. (B) Representative flow cytometry plot of islet CD45+ cells. (C) Number of islet CD11c+ cells. Intact n = 12 mice, CD11c depleted n = 16 mice from 7 experiments; Error bars = SEM. Statistics: Students T-test, ***P < 0.001. (D–G) Flow cytometric analysis of adhesion molecule expression on endothelial cells (CD31+ CD45- cells) with or without CD11c depletion. (D) Representative histograms. (E) Adhesion molecule MFI normalized to the average MFI of intact islets. Red line signifies no change compared to control. n = 5 mice from 3 experiments. Statistics: One sample T-test with hypothetical value = 1. (F) Lymphocyte adhesion to the islet vasculature was analyzed by 2-photon whole islet imaging. Fluorescent dye-labeled, peptide-activated BDC-2.5 (CD4) and 8.3 (CD8) T cells were co-transferred 2 h prior to harvest. Islets were antibody stained for CD31 and T cell infiltration. n = 4 mice from 3 experiments. Statistics: Students T-test.
Figure 8
Figure 8
Lymphocyte entry into the islets is impaired by CD11c+ cell depletion. NOD.CD11c-DTR bone marrow chimera generation and CD11c depletion were done as described in Figure 7A. Negatively selected ex vivo or peptide-activated BDC-2.5 CD4+ and 8.3 CD8+ islet antigen-specific T cells and ex vivo B cells were fluorescent dye-labeled and co-transferred at the time of the second DT treatment. Twenty-four hours after cell transfer, ILNs and islets were isolated and digested. Transferred cells within the tissues were quantified by flow cytometry. (A) Schematic of experimental setup. (B,C) The number of (A) activated and (B) ex vivo transferred cells in the islets normalized to the total number of islets isolated. For ex vivo: n = 10–16 mice from 4–8 experiments. For activated: n = 6–8 mice from 3 experiments. (D,E) Number of (C) activated and (D) ex vivo transferred cells in the PLN. (F,G) Number of (C) activated and (D) ex vivo transferred cells in the ILN. (D–G) For ex vivo: n = 4–6 mice from 2 experiments. For activated: n = 6 mice from 3 experiments. Error bars = SEM. Statistics: Students T-test; *P < 0.05; ***P < 0.001.

References

    1. Ley K, Laudanna C, Cybulsky MI, Nourshargh S. Getting to the site of inflammation: the leukocyte adhesion cascade updated. Nat Rev Immunol. (2007) 7:678–89. 10.1038/nri2156 - DOI - PubMed
    1. Thelen M, Stein JV. How chemokines invite leukocytes to dance. Nat Immunol. (2008) 9:953–9. 10.1038/ni.f.207 - DOI - PubMed
    1. Magnuson AM, Thurber GM, Kohler RH, Weissleder R, Mathis D, Benoist C. Population dynamics of islet-infiltrating cells in autoimmune diabetes. Proc Natl Acad Sci USA. (2015) 112:1511–6. 10.1073/pnas.1423769112 - DOI - PMC - PubMed
    1. Melli K, Friedman RS, Martin AE, Finger EB, Miao G, Szot GL, et al. . Amplification of autoimmune response through induction of dendritic cell maturation in inflamed tissues. J Immunol. (2009) 182:2590–600. 10.4049/jimmunol.0803543 - DOI - PMC - PubMed
    1. Calderon B, Unanue ER. Antigen presentation events in autoimmune diabetes. Curr Opin Immunol. (2012) 24:119–28. 10.1016/j.coi.2011.11.005 - DOI - PMC - PubMed

Publication types