. 2019 Jan 31:10:7.
doi: 10.3389/fgene.2019.00007. eCollection 2019.

A New Panel-Based Next-Generation Sequencing Method for ADME Genes Reveals Novel Associations of Common and Rare Variants With Expression in a Human Liver Cohort

Affiliations

A New Panel-Based Next-Generation Sequencing Method for ADME Genes Reveals Novel Associations of Common and Rare Variants With Expression in a Human Liver Cohort

Kathrin Klein et al. Front Genet. .

Abstract

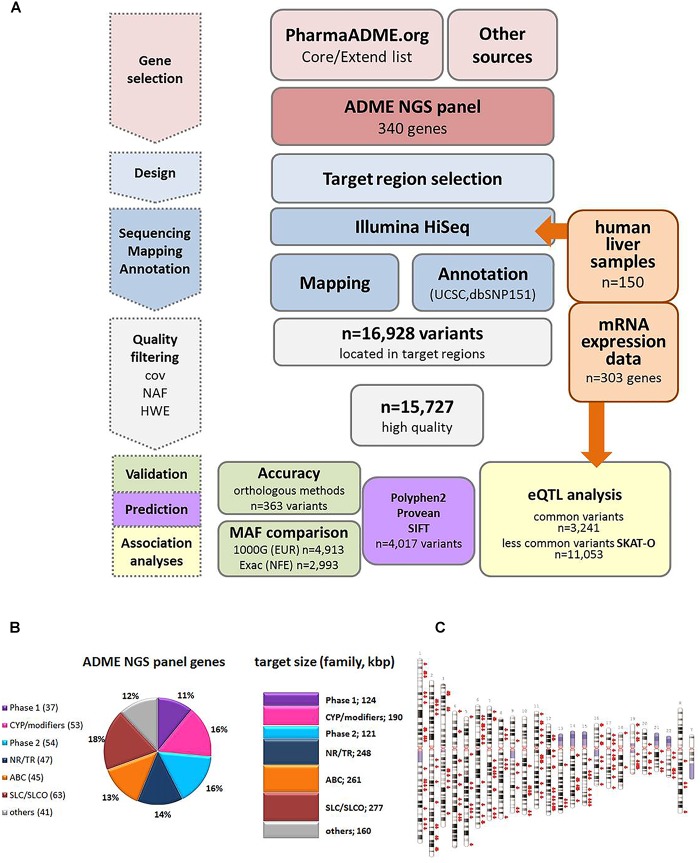
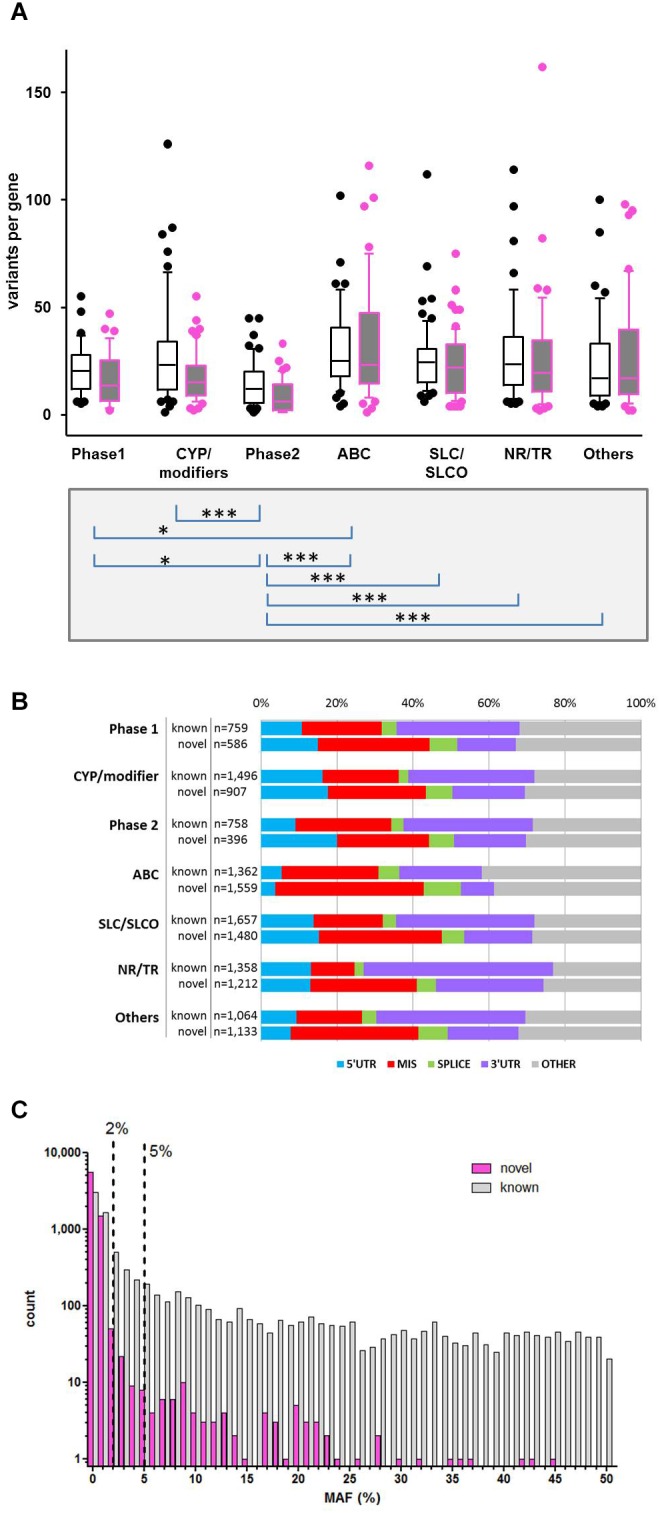
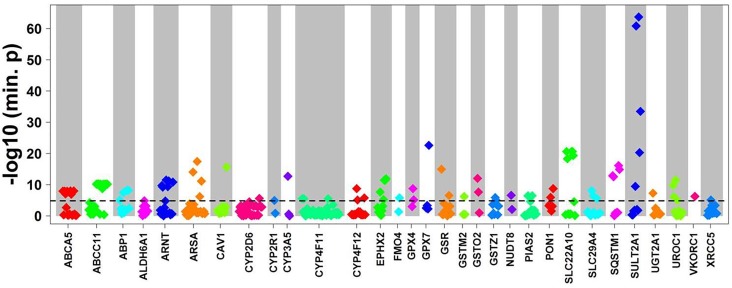
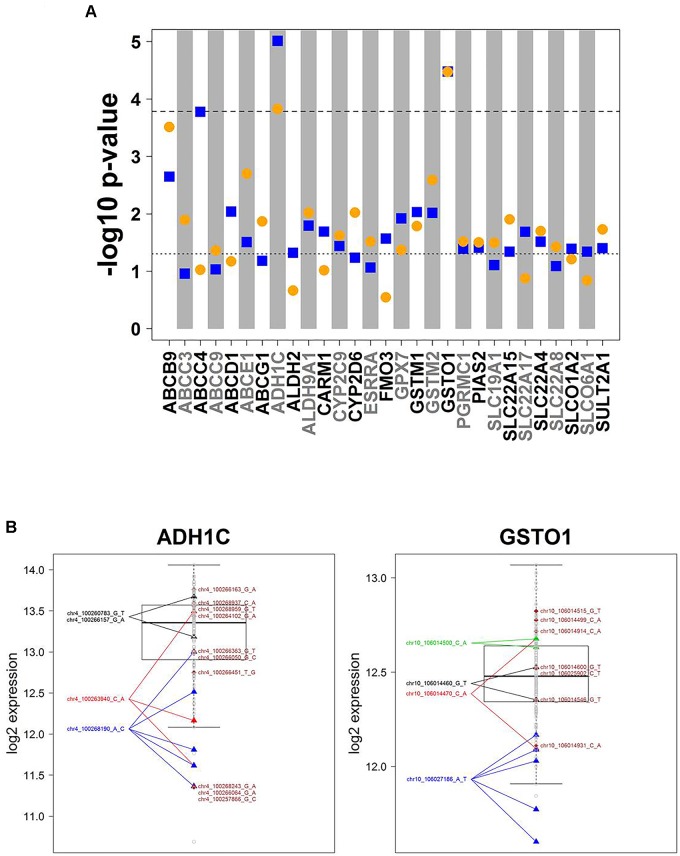
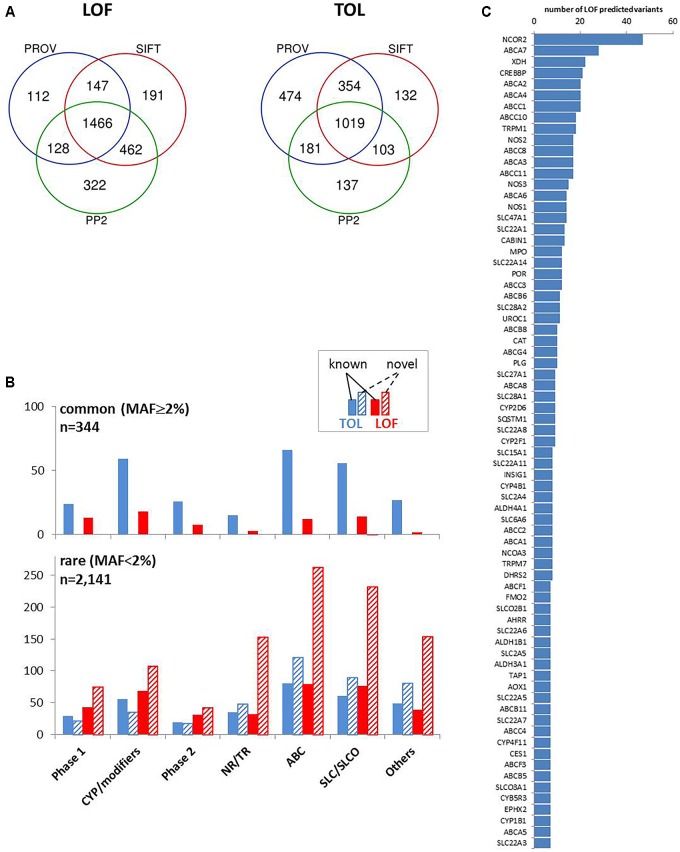
We developed a panel-based NGS pipeline for comprehensive analysis of 340 genes involved in absorption, distribution, metabolism and excretion (ADME) of drugs, other xenobiotics, and endogenous substances. The 340 genes comprised phase I and II enzymes, drug transporters and regulator/modifier genes within their entire coding regions, adjacent intron regions and 5' and 3'UTR regions, resulting in a total panel size of 1,382 kbp. We applied the ADME NGS panel to sequence genomic DNA from 150 Caucasian liver donors with available comprehensive gene expression data. This revealed an average read-depth of 343 (range 27-811), while 99% of the 340 genes were covered on average at least 100-fold. Direct comparison of variant annotation with 363 available genotypes determined independently by other methods revealed an overall accuracy of >99%. Of 15,727 SNV and small INDEL variants, 12,022 had a minor allele frequency (MAF) below 2%, including 8,937 singletons. In total we found 7,273 novel variants. Functional predictions were computed for coding variants (n = 4,017) by three algorithms (Polyphen 2, Provean, and SIFT), resulting in 1,466 variants (36.5%) concordantly predicted to be damaging, while 1,019 variants (25.4%) were predicted to be tolerable. In agreement with other studies we found that less common variants were enriched for deleterious variants. Cis-eQTL analysis of variants with (MAF ≥ 2%) revealed significant associations for 90 variants in 31 genes after Bonferroni correction, most of which were located in non-coding regions. For less common variants (MAF < 2%), we applied the SKAT-O test and identified significant associations to gene expression for ADH1C and GSTO1. Moreover, our data allow comparison of functional predictions with additional phenotypic data to prioritize variants for further analysis.

Keywords: ADME; eQTL analysis; next generation sequencing; pharmacogenomics; rare variants.


Figures

FIGURE 1
FIGURE 1
Study overview. (A) Schematic overview of the workflow for the ADME NGS panel sequencing. cov, coverage; NAF, novel allele frequency; HWE, Hardy–Weinberg equilibrium; MAF, minor allele frequency; eQTL, expression quantitative trait loci. (B) Composition of ADME NGS target genes displayed in % of total number (n = 340). Number of target genes within a family is given in brackets. Sum of target size is given in kbp. Major functional classes were defined as Phase 1, phase 1 enzymes; CYP/modifiers, cytochrome P450 and modifying enzymes; Phase 2, phase 2 enzymes; ABC, ABC transporters; SLC/SLCO, SLC/SLCO transporters and ion channels; NR/TR, nuclear receptors and transcriptional regulators; Others, other genes. For further details see Supplementary Table S1. (C) Ideogram of the genes included in ADME NGS panel. Target genes (n = 340) are denoted by red arrows besides chromosomes (GRCh37).
FIGURE 2
FIGURE 2
Variability of gene families. (A) Distribution of known and novel variants in ADME gene families. The numbers of observed known and novel variants (including SNVs and INDELs) per gene are shown for the seven major functional classes of ADME genes defined in Figure 1. Open boxes, known variants; filled boxes, novel variants; boxes show median with 75th and 25th percentiles and whiskers represent 10th and 90th percentiles. Lower part: statistical significance calculated by Kruskal–Wallis with Dunn’s multiple comparison test of total number of variants per genes between family groups: P ≤ 0.05, ∗∗∗P ≤ 0.001. (B) Functional categorization of variants. Total number and proportion of variants observed in each functional class is shown separately for known and novel variants. Functional classes are defined as follows: 5′UTR, upstream and 5′ untranslated region; MIS, initiator codon, missense and stop codon variants; SPLICE, variants in consensus splice site acceptor and donor regions; 3′UTR, downstream and 3′ untranslated region; OTHER, other functional classes (intronic, frameshift, synonymous, other coding and non-coding variants). (C) Comparison of minor allele frequencies (MAF) between novel and known observations. Total number of known observations with dbSNP identifier (open white bars; n = 8,454), novel observations (filled purple bars; n = 7,273); dotted line marks MAF = 2 and 5%.
FIGURE 3
FIGURE 3
Cis-eQTL analysis of common variants. Top cis-associations of common variants to mRNA expression. Manhattan plot presenting top results from multivariate cis association analysis between mRNA expression and common variants (MAF ≥ 2%) investigated for the corresponding gene. Displayed are minimal p-values (min. p) from four genetic models (codominant, dominant, recessive, and additive). In total, n = 3,241 common variants in n = 295 genes were analyzed. Only genes with at least one significant cis-association after Bonferroni correction (p < 0.05/3,241 = 1.54E-05; dotted line) are shown with all minimal p-values. The significant p-values are presented in Table 2.
FIGURE 4
FIGURE 4
Cis-associations of rare variants and mRNA expression (SKAT-O analysis). (A) Manhattan plot displaying SKAT-O test p-values from uni- and multivariate cis-association analysis between mRNA expression and the set of all rare variants (MAF < 2%) investigated for the corresponding gene. In total, n = 11,053 rare variants in 303 genes were analyzed. Only genes with a minimal association p-value < 0.05 are shown. Horizontal dotted lines indicate significance level at 0.05 (lower) and Bonferroni corrected significance level at 0.05/303 = 1.65E-04 (upper). Blue squares: univariate analysis, orange circles: multivariate analysis. (B) Boxplots of ADH1C and GSTO1 gene expression, the two genes with SKAT-O test p-values < 1.65E-05 in both uni- and multivariate analysis. All variants are heterozygous. Patients with rare variants (MAF < 2%) in ADH1C or GSTO1 are marked by triangles if several patients are carrying a rare mutation or diamonds if a rare mutation is only present in one patient. Gray dots represent patients without rare variants for the gene displayed. Colors differentiate variants.
FIGURE 5
FIGURE 5
Prediction of coding variant effects. (A) Comparison of loss-of-function (LOF) and tolerable (TOL) predictions obtained by three different prediction tools. Venn diagrams are shown for “LOF” and “TOL” predictions for n = 4,017 coding variants from Provean (“deleterious”), SIFT (“damaging”), Polyphen2 (PP2; “probably/possibly damaging”). (B) Occurrence of TOL and LOF variants in gene family groups. The distribution of the number of concordant TOL (n = 1,019; blue colored) and LOF (n = 1,466; red colored) predictions is shown for the indicated gene groups for known (filled bars) and novel (hatched bars) variants. Upper chart: variants with MAF ≥ 2%; lower chart: variants with MAF < 2%. (C) Top LOF-variant carrier genes. Shown are genes with at least seven predicted LOF-variants.
FIGURE 6
FIGURE 6
Genotype-phenotype relation of ABCC11 missense variants to MRP8 protein expression. Relative MRP8 protein abundance in the same human liver samples used for NGS was determined by Western blot analysis (Magdy et al., 2013). Symbols: open black circles, all variants; red filled circles, carriers of LOF-predicted variants; green open circles, carriers of only TOL-predicted variants; green box and whisker: carriers of TOL-predicted variants not carrying LOF-variants (n = 30); red box and whisker: carriers of at least one LOF (n = 73). Novel variants are indicated by a star.

References

    1. Abecasis G. R., Auton A., Brooks L. D., DePristo M. A., Durbin R. M.1000 Genomes Project Consortium et al. (2012). An integrated map of genetic variation from 1,092 human genomes. Nature 491 56–65. 10.1038/nature11632 - DOI - PMC - PubMed
    1. Auton A., Brooks L. D., Durbin R. M., Garrison E. P., Kang H. M.1000 Genomes Project Consortium et al. (2015). A global reference for human genetic variation. Nature 526 68–74. 10.1038/nature15393 - DOI - PMC - PubMed
    1. Adzhubei I., Jordan D. M., Sunyaev S. R. (2013). Predicting functional effect of human missense mutations using PolyPhen-2. Curr. Protoc. Hum. Genet. Chapter 7:Unit7.20. 10.1002/0471142905.hg0720s76 - DOI - PMC - PubMed
    1. Agúndez J. A. G., Ayuso P., Cornejo-García J. A., Blanca M., Torres M. J., Doña I., et al. (2012). The diamine oxidase gene is associated with hypersensitivity response to non-steroidal anti-inflammatory drugs. PLoS One 7:e47571. 10.1371/journal.pone.0047571 - DOI - PMC - PubMed
    1. Alfirevic A., Pirmohamed M. (2017). Genomics of adverse drug reactions. Trends Pharmacol. Sci. 38 100–109. 10.1016/j.tips.2016.11.003 - DOI - PubMed