. 2019 Jan 15:2019:8169172.
doi: 10.1155/2019/8169172. eCollection 2019.

Osteoarthritic Synovial Fluid Modulates Cell Phenotype and Metabolic Behavior In Vitro

Affiliations

Osteoarthritic Synovial Fluid Modulates Cell Phenotype and Metabolic Behavior In Vitro

Eduardo Branco de Sousa et al. Stem Cells Int. .

Abstract

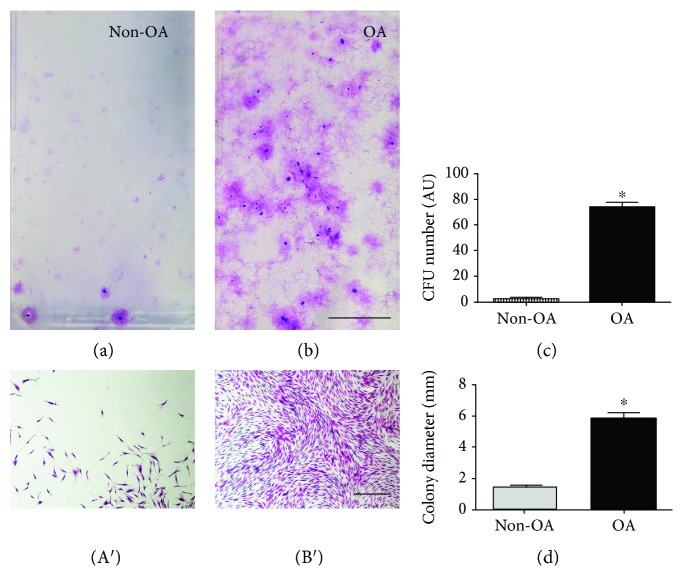
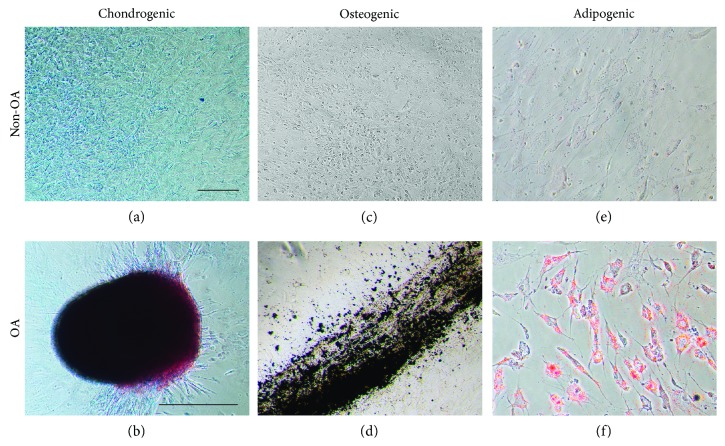
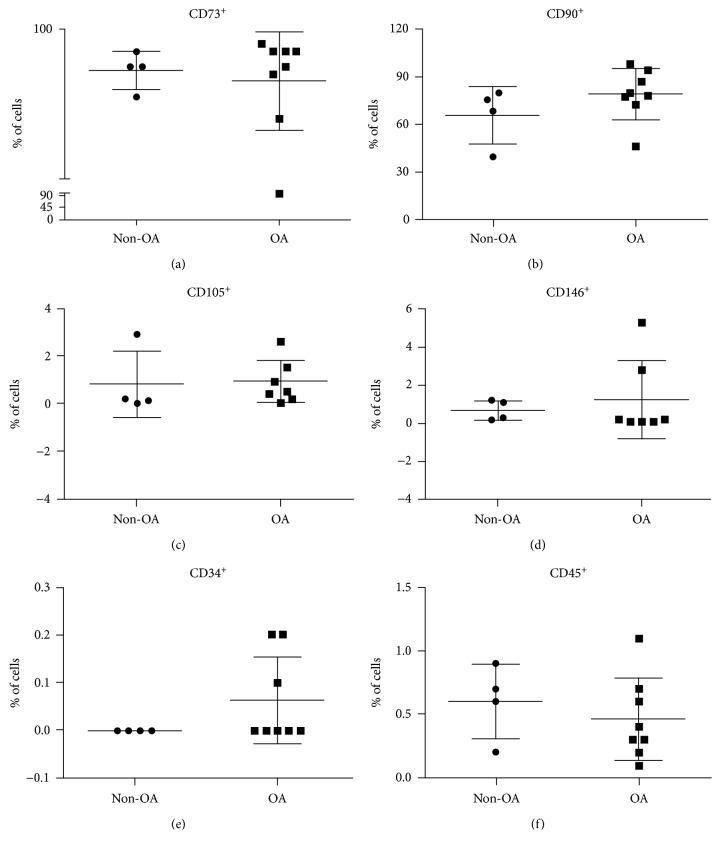
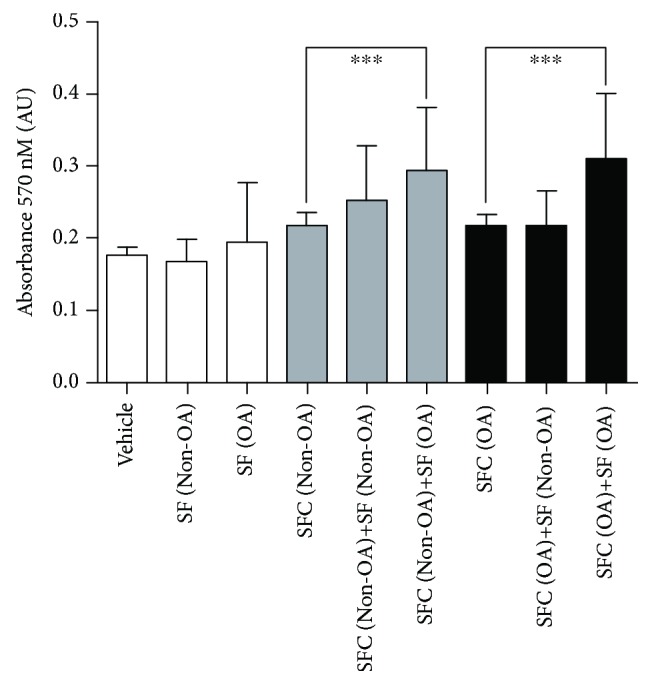
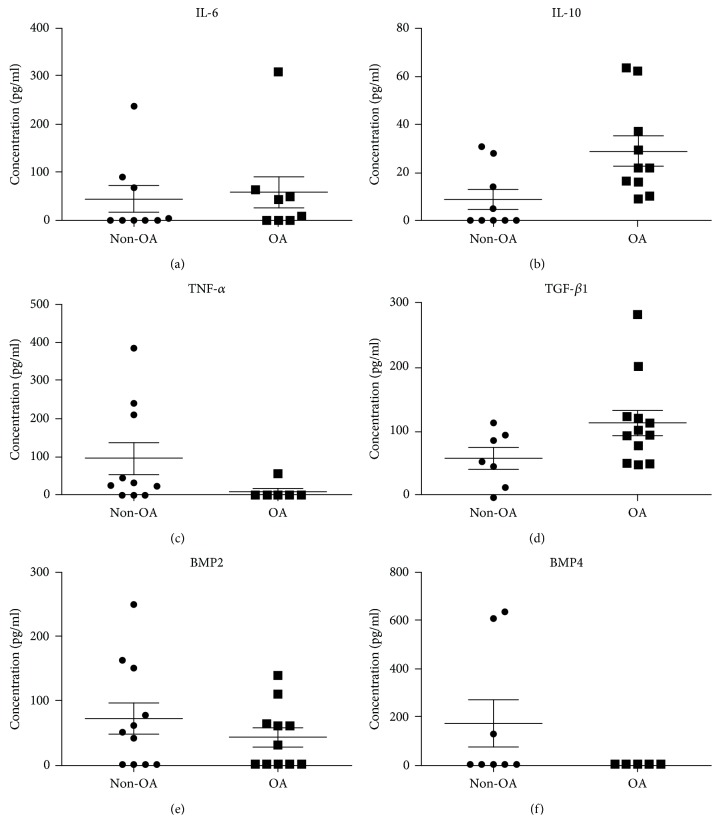
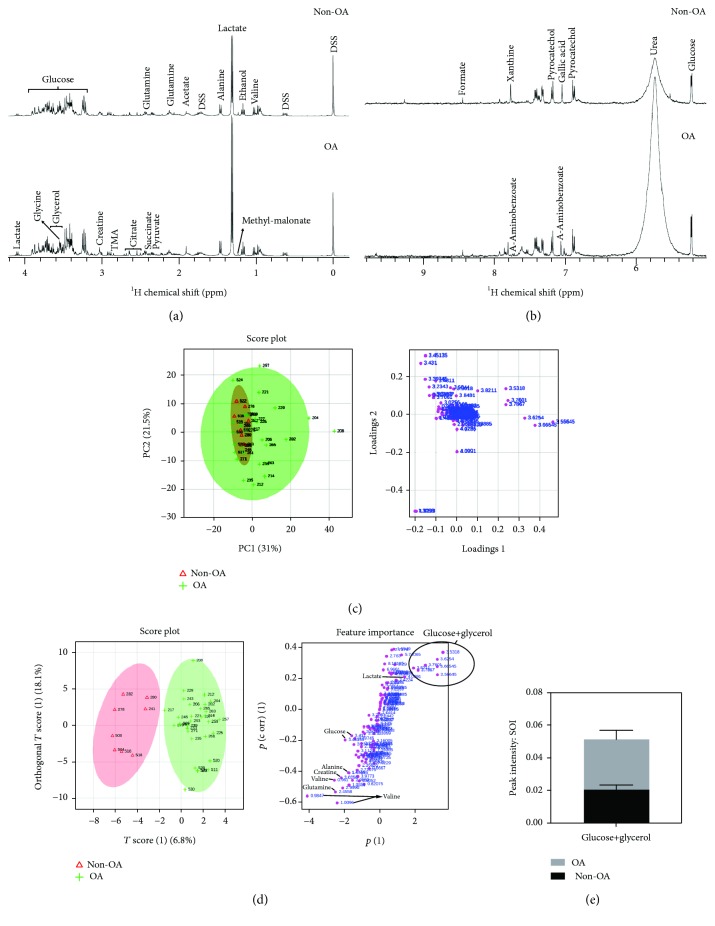
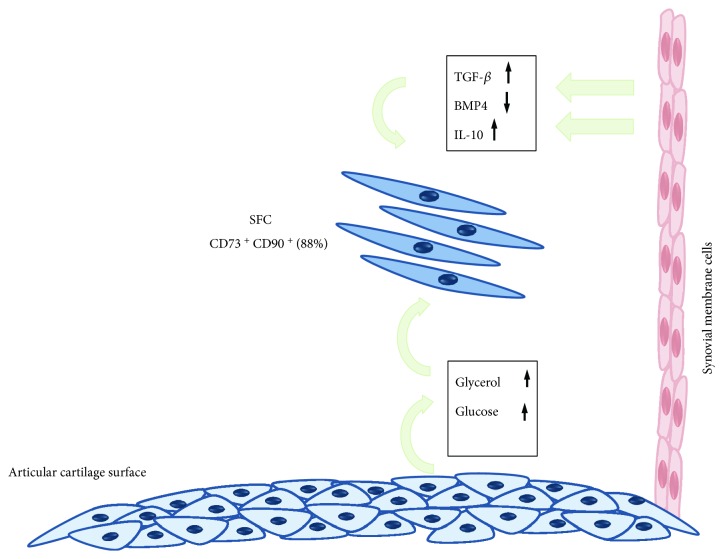
Synovial fluid holds a population of mesenchymal stem cells (MSC) that could be used for clinical treatment. Our goal was to characterize the inflammatory and metabolomic profile of the synovial fluid from osteoarthritic patients and to identify its modulatory effect on synovial fluid cells. Synovial fluid was collected from non-OA and OA patients, which was centrifuged to isolate cells. Cells were cultured for 21 days, characterized with specific markers for MSC, and exposed to a specific cocktail to induce chondrogenic, osteogenic, and adipogenic differentiation. Then, we performed a MTT assay exposing SF cells from non-OA and OA patients to a medium containing non-OA and OA synovial fluid. Synovial fluid from non-OA and OA patients was submitted to ELISA to evaluate BMP-2, BMP-4, IL-6, IL-10, TNF-α, and TGF-β1 concentrations and to a metabolomic evaluation using 1H-NMR. Synovial fluid cells presented spindle-shaped morphology in vitro. Samples from OA patients formed a higher number of colonies than the ones from non-OA patients. After 21 days, the colony-forming cells from OA patients differentiated into the three mesenchymal cell lineages, under the appropriated induction protocols. Synovial fluid cells increased its metabolic activity after being exposed to the OA synovial fluid. ELISA assay showed that OA synovial fluid samples presented higher concentration of IL-10 and TGF-β1 than the non-OA, while the NMR showed that OA synovial fluid presents higher concentrations of glucose and glycerol. In conclusion, SFC activity is modulated by OA synovial fluid, which presents higher concentration of IL-10, TGF-β, glycerol, and glucose.


Figures

Figure 1
Figure 1
CFU phenotype. CFU stained with cresyl violet. OA patient's SFC formed more colonies (b) than non-OA ones (a). OA patient's CFU (B′) had higher diameter than non-OA CFU (A′). Scale (a, b): 1 mm. Scale (A′ and B′): 0.5 mm.
Figure 2
Figure 2
Chondrogenic, osteogenic and adipogenic induction of SFC. Images of the SFC after induction protocols. Non-OA patient's SFC did not differentiate under the appropriate protocols (a, c, e). On the other hand, OA patient's SFC differentiated, as we can identify the presence of chondroblasts evidenced by alcian blue (b), the presence of calcium deposits evidenced by von Kossa (d), and the presence of lipid accumulation with Oil Red O (f). Scale (a, c, d, e, f): 10 μm. Scale (b): 500 μm.
Figure 3
Figure 3
SFC flow cytometry. Isolated analysis of markers showed no differences in the concentration of SFC positive for CD73, CD90, CD146, CD34, and CD45 between non-OA and OA patients. OA SFC presented higher concentration of CD105 positive cells. Grouped analysis of markers showed no differences in the concentration of SFC positive for CD73 and CD90; CD73, CD90, and CD105; CD73, CD90, and CD146; and CD73, CD90, CD105, and CD146 between non-OA and OA patients.
Figure 4
Figure 4
Mitochondrial activity of non-OA and OA SFC exposed to medium containing non-OA and OA SF. Medium containing non-OA and OA synovial fluid increases OA SFC (OA SFC 0.21 ± 0.002 vs. OA SFC+SF OA 0.30 ± 0.007; p < 0.0001, n = 7) and non-OA SFC activity (non-OA SFC 0.222 ± 0.003 vs. non-OA SFC+SF OA 0.30 ± 0.01; p = 0.0017, n = 7). OA: osteoarthritis.
Figure 5
Figure 5
IL-6, IL-10, TNF-α, TGF-β, BMP-2, and BMP-4 concentration in non-OA and OA SF. We found no statistically significant differences between the concentrations of (a) IL-6 (non-OA SF 44.36 pg/mL ± 26.81 vs. OA SF 57.75 pg/mL ± 32.57; p > 0.05), (c) TNF-α (non-OA SF 96.76 pg/mL ± 42.44 vs. OA SF 9.55 pg/mL ± 9.55; p > 0.05), (e) BMP-2 (non-OA SF 72.26 pg/mL ± 24.96 vs. OA SF 42.20 pg/mL ± 14.83; p > 0.05), and (f) BMP-4 (below detection limits of the method) in the non-OA and OA SF. The concentrations of IL-10 (b) and TGF-β1 (d) were higher in the OA SF (IL-10: non-OA SF 8.65 pg/mL ± 4.23 vs. OA SF 28.93 pg/mL ± 6.32; p = 0.0093; TGF-β1: non-OA SF 58.29 pg/mL ± 16.03 vs. OA SF 113.4 pg/mL ± 19.6; p = 0.03). IL: interleukin; OA: osteoarthritis.
Figure 6
Figure 6
Non-OA and OA synovial fluid presents different metabolomic profiles. NMR spectra of the non-OA and OA synovial fluid in the aliphatic (a) and aromatic (b) region. The principal component analysis (PCA) score plot (c) shows the distribution of each patient due to the variance of metabolite intensity. The loading plot, on the right, shows the importance of each metabolite, i.e., the charge factor of each metabolite in class separation of non-OA (n = 9) and OA patients (n = 31). Multivariate statistical analysis, OPLS-DA (d), shows that it is possible to distinguish the group of non-OA patients from the OA ones based on the metabolomic profile. The score plot, in which each dot represents a patient, and loading plot (charge factor), on the right, in which each dot corresponds to a metabolite. Glucose and glycerol were the metabolites with most altered concentration in OA patients (e). p < 0.05.
Figure 7
Figure 7
Crosstalk between articular cartilage, synovium, and OA synovial fluid cells. Articular chondrocytes altered metabolism, shifting from the anaerobic to the glycolytic pathway, and other alternative sources of energy production, leading to a raise in glycerol and glucose concentration in the synovial fluid OA SF. Besides, synovium inflammation increases TGF-β and IL-4 production and reduces BMP-4 expression. These alterations are interpreted by the SFC as stimuli to keep proliferation and not to differentiate. So, synovial fluid cells keep proliferating, instead of repairing articular lesions.

References

    1. Goldring M. B., Goldring S. R. Osteoarthritis. Journal of Cellular Physiology. 2007;213(3):626–634. doi: 10.1002/jcp.21258. - DOI - PubMed
    1. Safran M. R., Kim H., Zaffagnini S. The use of scaffolds in the management of articular injury. JAAOS. 2008;16(6):306–311. - PubMed
    1. Loeser R. F., Goldring S. R., Scanzello C. R., Goldring M. B. Osteoarthritis: a disease of the joint as an organ. Arthritis and Rheumatism. 2012;64(6):1697–1707. doi: 10.1002/art.34453. - DOI - PMC - PubMed
    1. Houard X., Goldring M. B. Homeostatic mechanisms in articular cartilage and role of inflammation in osteoarthritis. Current Rheumatology Reports. 2013;15(11):p. 375. doi: 10.1007/s11926-013-0375-6. - DOI - PMC - PubMed
    1. Gupta P. K., Das A. K., Chullikana A., Majumdar A. S. Mesenchymal stem cells for cartilage repair in osteoarthritis. Stem Cell Research & Therapy. 2012;3(4):p. 25. doi: 10.1186/scrt116. - DOI - PMC - PubMed

LinkOut - more resources