. 2019 Feb 5;9(2):804-817.
doi: 10.1002/ece3.4825. eCollection 2019 Jan.

Precision gain versus effort with joint models using detection/non-detection and banding data

Affiliations

Precision gain versus effort with joint models using detection/non-detection and banding data

Jamie S Sanderlin et al. Ecol Evol. .

Abstract

Capture-recapture techniques provide valuable information, but are often more cost-prohibitive at large spatial and temporal scales than less-intensive sampling techniques. Model development combining multiple data sources to leverage data source strengths and for improved parameter precision has increased, but with limited discussion on precision gain versus effort. We present a general framework for evaluating trade-offs between precision gained and costs associated with acquiring multiple data sources, useful for designing future or new phases of current studies.We illustrated how Bayesian hierarchical joint models using detection/non-detection and banding data can improve abundance, survival, and recruitment inference, and quantified data source costs in a northern Arizona, USA, western bluebird (Sialia mexicana) population. We used an 8-year detection/non-detection (distributed across the landscape) and banding (subset of locations within landscape) data set to estimate parameters. We constructed separate models using detection/non-detection and banding data, and a joint model using both data types to evaluate parameter precision gain relative to effort.Joint model parameter estimates were more precise than single data model estimates, but parameter precision varied (apparent survival > abundance > recruitment). Banding provided greater apparent survival precision than detection/non-detection data. Therefore, little precision was gained when detection/non-detection data were added to banding data. Additional costs were minimal; however, additional spatial coverage and ability to estimate abundance and recruitment improved inference. Conversely, more precision was gained when adding banding to detection/non-detection data at higher cost. Spatial coverage was identical, yet survival and abundance estimates were more precise. Justification of increased costs associated with additional data types depends on project objectives.We illustrate a general framework for evaluating precision gain relative to effort, applicable to joint data models with any data type combination. This framework evaluates costs and benefits from and effort levels between multiple data types, thus improving population monitoring designs.

Keywords: abundance; data integration; integrated population models; recruitment; study design; survival; western bluebird; wildfire effects.


Figures
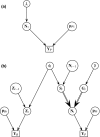
Figure 1
Figure 1
Directed acyclic graphs (DAG) of joint data model including banding (B) and detection/non‐detection (P) data for a western bluebird case study in ponderosa pine forests within Coconino National Forest in north‐central Arizona, USA between 1999 and 2006. Notation is as follows: λ (expected count of individuals), N (abundance), ϕ (apparent survival probability), S (number of individuals that survived), γ (recruitment), G (number of individuals gained through recruitment), p P (point‐count detection probability), p B (banding detection probability), Z (latent alive matrix for banded individuals), Y P (detection/non‐detection data), and Y B (banding data). For simplicity, case study regression coefficient parameters for λ, ϕ, γ, p P, and p B were not included within the figure. Arrows indicate dependencies with parameters (circle nodes) and data (square nodes). Single arrows indicate probabilistic relationships, whereas double arrows indicate deterministic relationships. DAGs for the (a) first time period (t = 1) and (b) time periods after the first time period (t > 1) are displayed
Figure 2
Figure 2
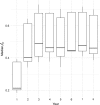
Box and whisker plot for detection probability medians of all sampling locations by year for detection/non‐detection data from the joint data model from a western bluebird case study in ponderosa pine forests within Coconino National Forest in north‐central Arizona, USA between 1999 and 2006. Detection probability estimates from detection/non‐detection data were originally for each secondary period but converted to primary periods (e.g., p^yr=1-i=131-p^sessioni)
Figure 3
Figure 3
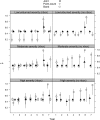
Apparent survival (φ) posterior median estimates and associated Bayesian credible intervals from a western bluebird case study in ponderosa pine forests within Coconino National Forest in north‐central Arizona, USA between 1999 and 2006. Estimates were derived using data from a single bird point‐count station and models using detection/non‐detection data only, banding data only, and a joint model using both data types. Example sampling locations included those with (nbox) and without nest boxes (no nbox) for high (Transect A, points 2 and 6), moderate (Transect B, points 2 and 1), and low/unburned (Transect J, points 6 and 1) burn severity
Figure 4
Figure 4
Abundance (N) posterior median estimates and associated Bayesian credible intervals from a western bluebird case study in ponderosa pine forests within Coconino National Forest in north‐central Arizona, USA between 1999 and 2006. Estimates were derived using data from a single bird point‐count station and models using detection/non‐detection data only, banding data only, and a joint model using both data types. Example sampling locations included those with (nbox) and without nest boxes (no nbox) for high (Transect A, points 2 and 6), moderate (Transect B, points 2 and 1), and low/unburned (Transect J, points 6 and 1) burn severity
Figure 5
Figure 5
Recruitment (G) posterior median estimates and associated Bayesian credible intervals from a western bluebird case study in ponderosa pine forests within Coconino National Forest in north‐central Arizona, USA between 1999 and 2006. Estimates were derived using data from a single bird point‐count station and models using detection/non‐detection data only, banding data only, and a joint model using both data types. Example sampling locations included those with (nbox) and without nest boxes (no nbox) for high (Transect A, points 2 and 6), moderate (Transect B, points 2 and 1), and low/unburned (Transect J, points 6 and 1) burn severity
Figure 6
Figure 6
Violin plots showing the difference in relative Bayesian credible interval (BCI) length (a measure of precision) between models built from single and joint data sources using data from a western bluebird case study in ponderosa pine forests within Coconino National Forest in north‐central Arizona, USA between 1999 and 2006 relative to cost (USD) of adding additional data sources. Relative difference in BCI length was calculated as (BCI length single‐BCI length joint)/BCI length joint, so larger numbers equate to more precision gained by incorporating multiple data types. Individual plots show the kernel density distribution across all points sampled. Phi band (left) shows the gain in precision for apparent survival estimates when detection/non‐detection data were added to existing banding data. Phi pnt, N pnt, and G pnt (left to right in right hand group) show the increase in precision of estimates for apparent survival, abundance, and recruitment, respectively, when banding data were added to existing detection/non‐detection data

References

    1. Ahrestani, F. S. , Saracco, J. F. , Sauer, J. R. , Pardieck, K. L. , & Royle, J. A. (2017). An integrated population model for bird monitoring in North America. Ecological Applications, 27(3), 916–924. 10.1002/eap.1493. - DOI - PubMed
    1. Arnason, A. N. , Schwarz, C. J. , & Gerrard, J. M. (1991). Estimating closed population size and number of marked animals from sighting data. The Journal of Wildlife Management, 55(4), 716–730. 10.2307/3809524 - DOI
    1. Besbeas, P. , Freeman, S. N. , Morgan, B. J. T. , & Catchpole, E. A. (2002). Integrating mark‐recapture‐recovery and census data to estimate animal abundance and demographic parameters. Biometrics, 58(3), 540–547. 10.1111/j.0006-341X.2002.00540.x - DOI - PubMed
    1. Besbeas, P. , Lebreton, J.‐D. , & Morgan, B. J. T. (2003). The efficient integration of abundance and demographic data. Journal of the Royal Statistical Society. Series C (Applied Statistics), 52(1), 95–102. 10.1111/1467-9876.00391 - DOI
    1. Block, W. M. , Strohmeyer, B. E. , & Sanderlin, J. S. (2018). Northern Arizona, USA, post-wildfire avian data: Western bluebird detection/non‐detection and banding data. Fort Collins, CO: Forest Service Research Data Archive; 10.2737/RDS-2018-0040 - DOI

LinkOut - more resources