

Neurochemically distinct circuitry regulates locus coeruleus activity during female social stress depending on coping style
- PMID: 30767070
- PMCID: PMC6510627
- DOI: 10.1007/s00429-019-01837-5
Neurochemically distinct circuitry regulates locus coeruleus activity during female social stress depending on coping style
Abstract
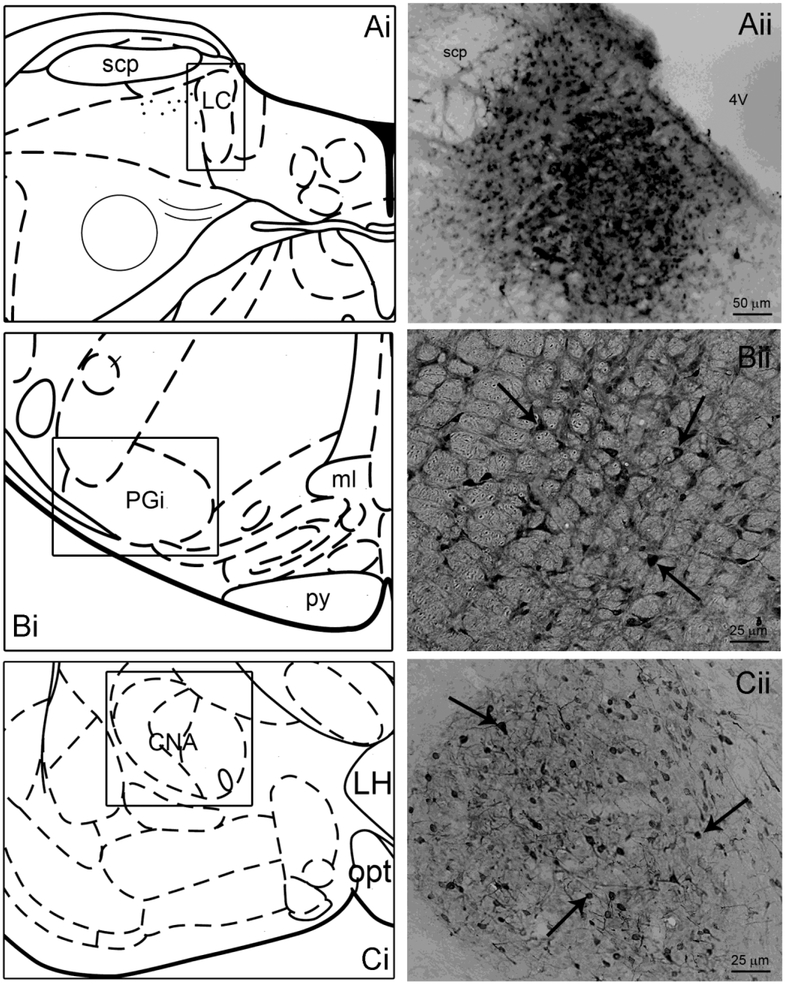
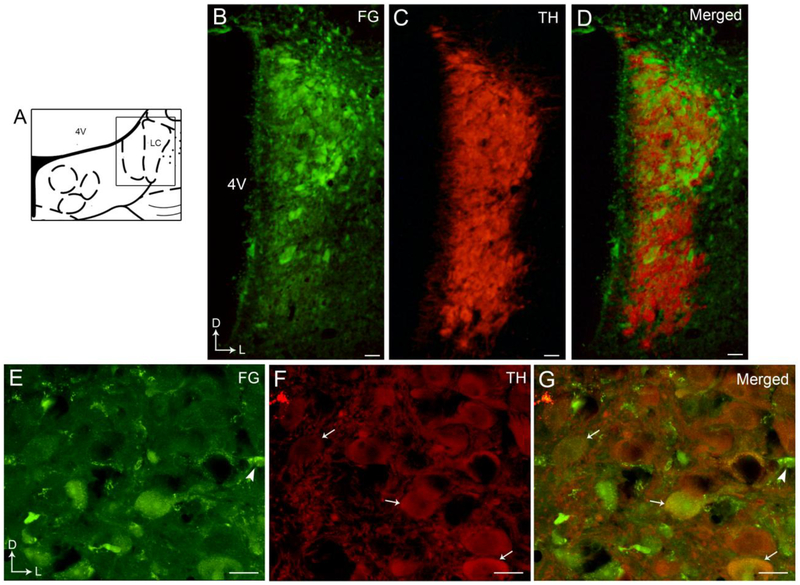
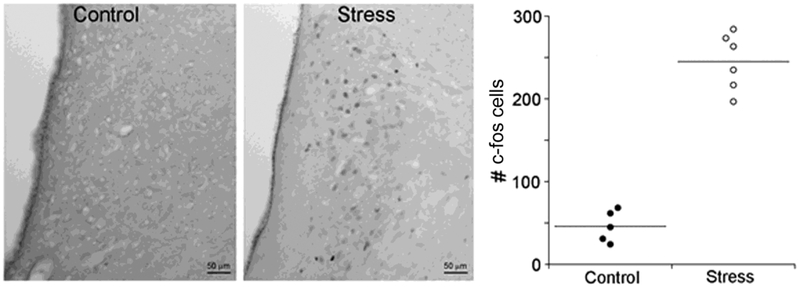
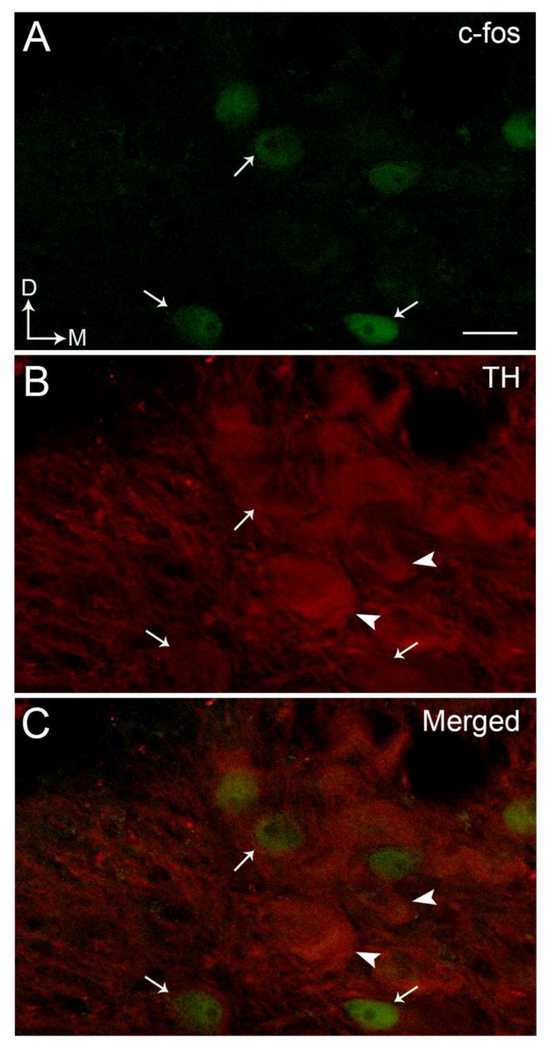
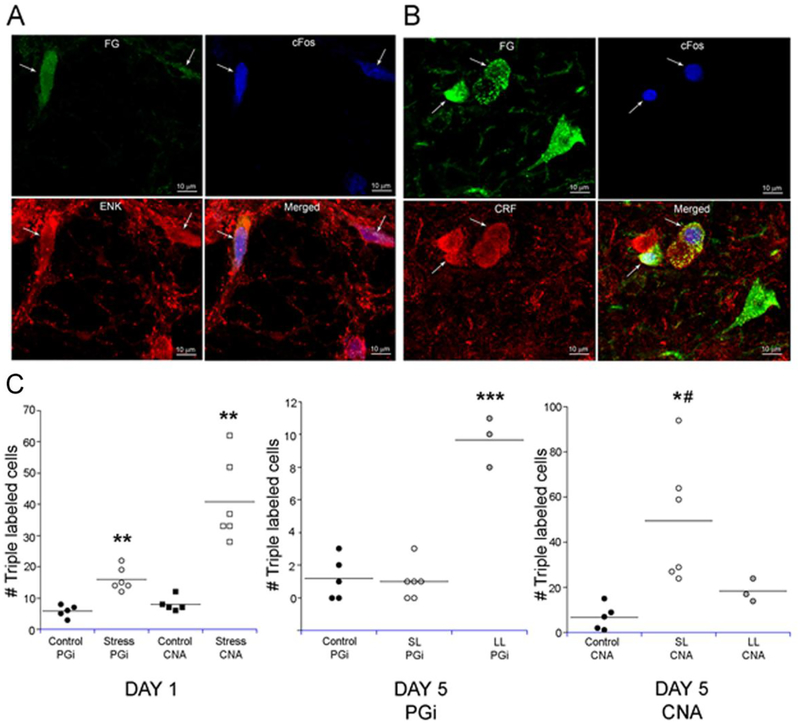
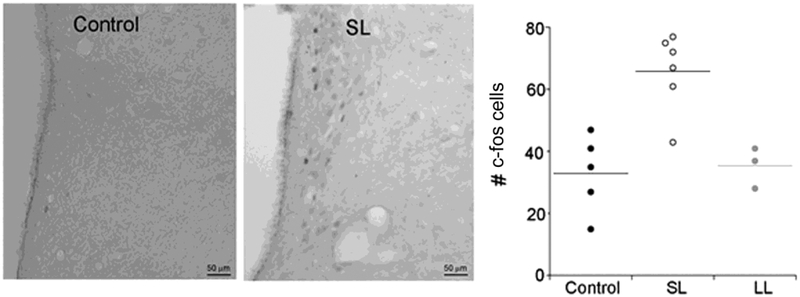
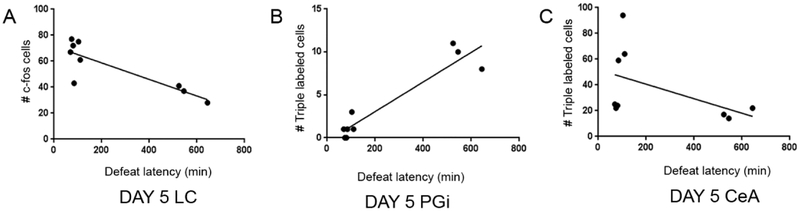
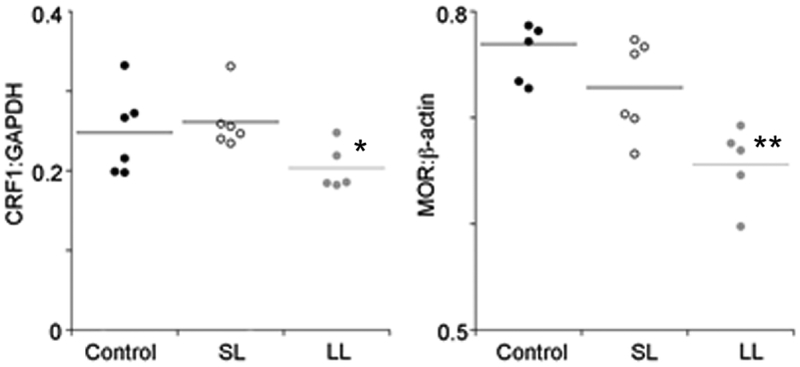
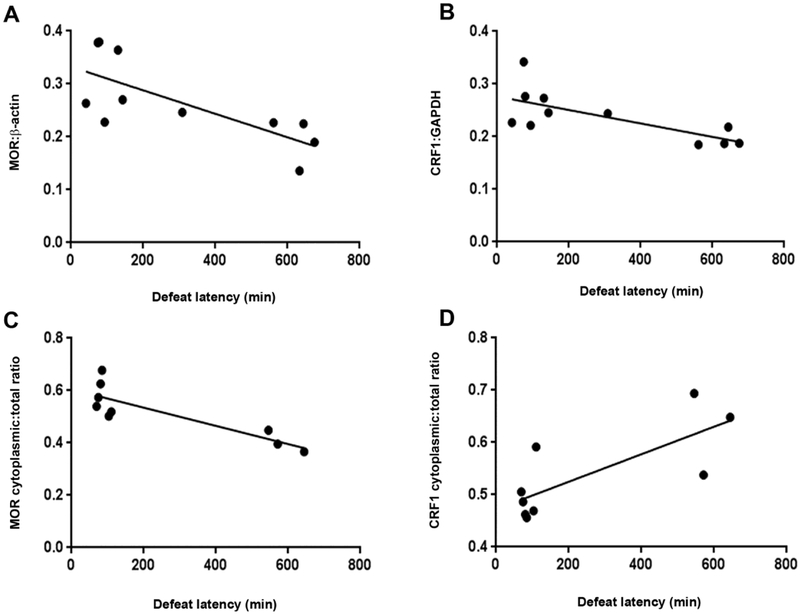
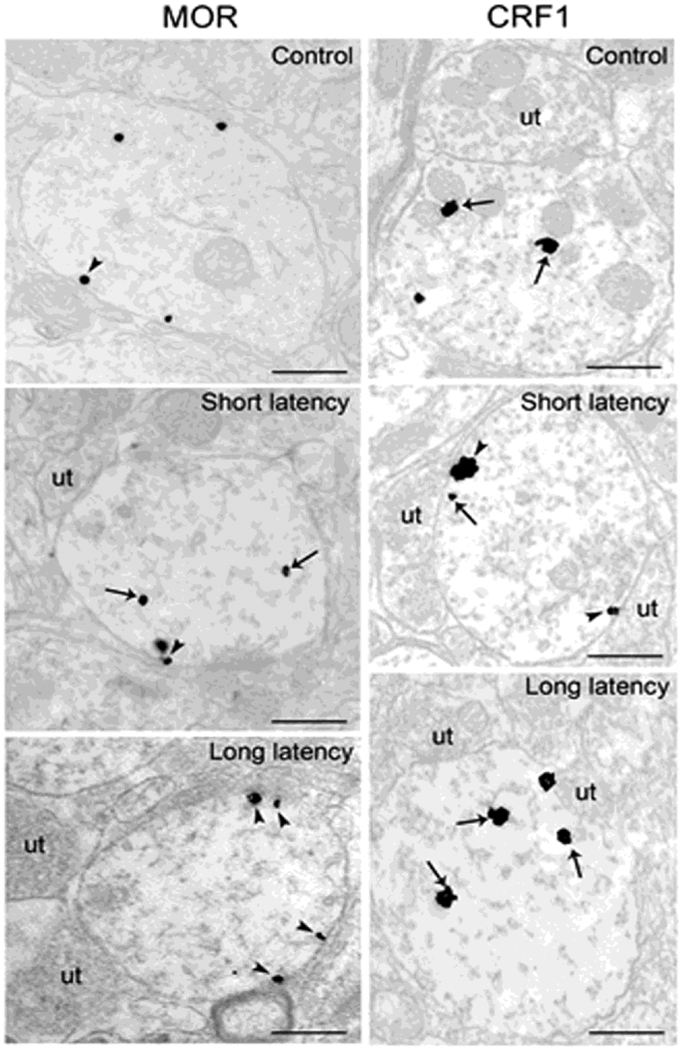
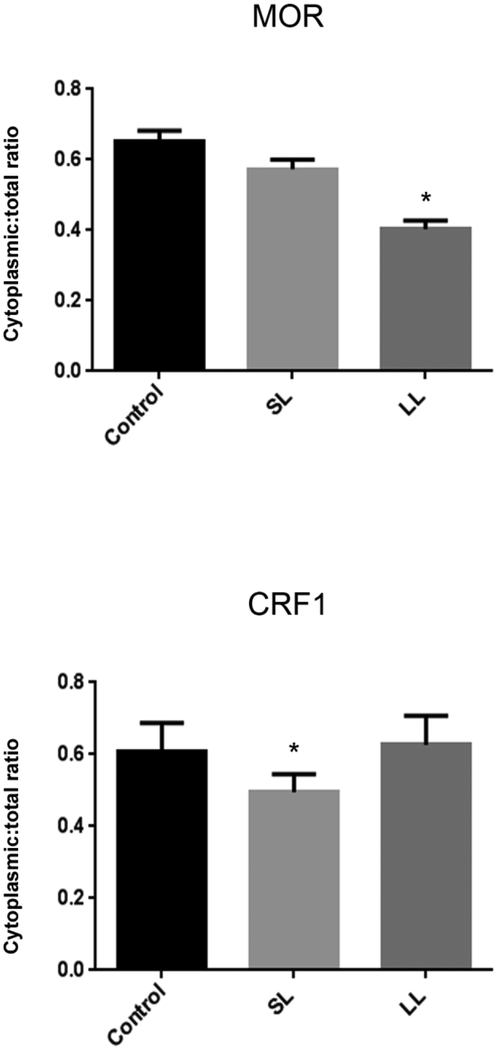
Stress-related psychiatric diseases are nearly twice as prevalent in women compared to men. We recently showed in male rats that the resident-intruder model of social stress differentially engages stress-related circuitry that regulates norepinephrine-containing neurons of the locus coeruleus (LC) depending on coping strategy as determined by the latency to assume a defeat posture. Here, we determined whether this social stress had similar effects in female rats. LC afferents were retrogradely labeled with Fluorogold (FG) and rats had one or five daily exposures to an aggressive resident. Sections through the nucleus paragigantocellularis (PGi), a source of enkephalin (ENK) afferents to the LC, and central nucleus of the amygdala (CeA), a source of corticotropin-releasing factor (CRF) afferents to the LC, were processed for immunocytochemical detection of c-fos, a marker of neuronal activity, FG and ENK or CRF. Like male rats, female rats defeated with a relatively short latency (SL) in response to a single resident-intruder exposure and showed significant c-fos activation of LC neurons, PGi-ENK LC afferents, and CeA-CRF-LC afferents. With repeated exposure, some rats exhibited a long latency to defeat (LL). LC neurons and CeA-CRF-LC afferents were activated in SL rats compared to control and LL, whereas PGi-ENK LC afferents were not. Conversely, in LL rats, PGi-ENK LC and CeA-CRF-LC afferents were activated compared to controls but not LC neurons. CRF type 1 receptor (CRF1) and µ-opioid receptor (MOR) expression levels in LC were decreased in LL rats. Finally, electron microscopy showed a relative increase in MOR on the plasma membrane of LL rats and a relative increase in CRF1 on the plasma membrane of SL rats. Together, these results suggest that as is the case for males, social stress engages divergent circuitry to regulate the LC in female rats depending on coping strategy, with a bias towards CRF influence in more subordinate rats and opioid influence in less subordinate rats.
Keywords: Central nucleus of the amygdala; Corticotropin-releasing factor; Enkephalin; Locus coeruleus; Nucleus paragigantocellularis; Social stress; µ-Opioid receptor and corticotropin-releasing factor receptor.
Figures
Similar articles
-
Social Stress Engages Neurochemically-Distinct Afferents to the Rat Locus Coeruleus Depending on Coping Strategy.eNeuro. 2015 Nov 26;2(6):ENEURO.0042-15.2015. doi: 10.1523/ENEURO.0042-15.2015. eCollection 2015 Nov-Dec. eNeuro. 2015. PMID: 26634226 Free PMC article.
-
Cellular interactions between axon terminals containing endogenous opioid peptides or corticotropin-releasing factor in the rat locus coeruleus and surrounding dorsal pontine tegmentum.J Comp Neurol. 2003 Nov 24;466(4):445-56. doi: 10.1002/cne.10893. J Comp Neurol. 2003. PMID: 14566941
-
Predator stress engages corticotropin-releasing factor and opioid systems to alter the operating mode of locus coeruleus norepinephrine neurons.Neuropharmacology. 2012 Mar;62(4):1737-45. doi: 10.1016/j.neuropharm.2011.11.020. Epub 2011 Dec 23. Neuropharmacology. 2012. PMID: 22210331 Free PMC article.
-
Opposing regulation of the locus coeruleus by corticotropin-releasing factor and opioids. Potential for reciprocal interactions between stress and opioid sensitivity.Psychopharmacology (Berl). 2001 Dec;158(4):331-42. doi: 10.1007/s002130000673. Epub 2001 Mar 14. Psychopharmacology (Berl). 2001. PMID: 11797054 Review.
-
Corticotrophin-releasing factor 1 activation in the central amygdale and visceral hyperalgesia.Neurogastroenterol Motil. 2015 Jan;27(1):1-6. doi: 10.1111/nmo.12495. Neurogastroenterol Motil. 2015. PMID: 25557223 Free PMC article. Review.
Cited by
-
Properties and modulation of excitatory inputs to the locus coeruleus.J Physiol. 2022 Nov;600(22):4897-4916. doi: 10.1113/JP283605. Epub 2022 Oct 13. J Physiol. 2022. PMID: 36156249 Free PMC article.
-
Noradrenergic Regulation of the Medial Prefrontal Cortex Mediates Stress Coping in Postpartum Female Mice.Mol Neurobiol. 2025 Jan;62(1):137-155. doi: 10.1007/s12035-024-04240-2. Epub 2024 Jun 3. Mol Neurobiol. 2025. PMID: 38829510
-
Silence, Solitude, and Serotonin: Neural Mechanisms Linking Hearing Loss and Social Isolation.Brain Sci. 2020 Jun 12;10(6):367. doi: 10.3390/brainsci10060367. Brain Sci. 2020. PMID: 32545607 Free PMC article. Review.
-
Decreased Resting-State Functional Connectivity of Periaqueductal Gray in Temporal Lobe Epilepsy Comorbid With Migraine.Front Neurol. 2021 May 26;12:636202. doi: 10.3389/fneur.2021.636202. eCollection 2021. Front Neurol. 2021. PMID: 34122295 Free PMC article.
-
The development of compulsive coping behaviour is associated with a downregulation of Arc in a Locus Coeruleus neuronal ensemble.Neuropsychopharmacology. 2023 Mar;48(4):653-663. doi: 10.1038/s41386-022-01522-y. Epub 2023 Jan 12. Neuropsychopharmacology. 2023. PMID: 36635597 Free PMC article.
References
-
- Avgustinovich DF, Kovalenko IL, Kudryavtseva NN (2005) A model of anxious depression: persistence of behavioral pathology. Neurosci Behav Physiol 35:917–924. - PubMed
-
- Bangasser DA, Curtis A, Reyes BA, Bethea TT, Parastatidis I, Ischiropoulos H, Van Bockstaele EJ, Valentino RJ (2010) Sex differences in corticotropin-releasing factor receptor signaling and trafficking: potential role in female vulnerability to stress-related psychopathology. Mol Psychiatry 15:877, 896–904. - PMC - PubMed
-
- Barr J, Van Bockstaele EJ (2005) Vesicular glutamate transporter-1 colocalizes with endogenous opioid peptides in axon terminals of the rat locus coeruleus. The anatomical Record. 284:466–474. - PubMed
-
- Berridge CW, Waterhouse BD (2003) The locus-coeruleus-noradrenergic system: modulation of behavioral state and state-dependent cognitive processes. Brain Res Rev 42:33–84. - PubMed
MeSH terms
Substances
Grants and funding
LinkOut - more resources
Full Text Sources
Medical
