Review
. 2019 May;471(5):701-717.
doi: 10.1007/s00424-019-02259-2. Epub 2019 Feb 15.

Three perspectives on the molecular basis of hypercontractility caused by hypertrophic cardiomyopathy mutations

Affiliations
Review

Three perspectives on the molecular basis of hypercontractility caused by hypertrophic cardiomyopathy mutations

James A Spudich. Pflugers Arch. 2019 May.

Abstract

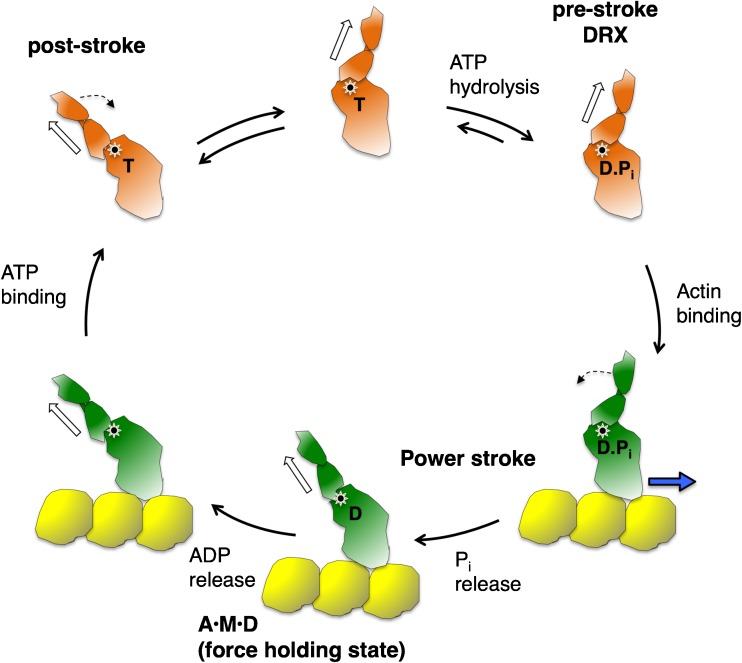
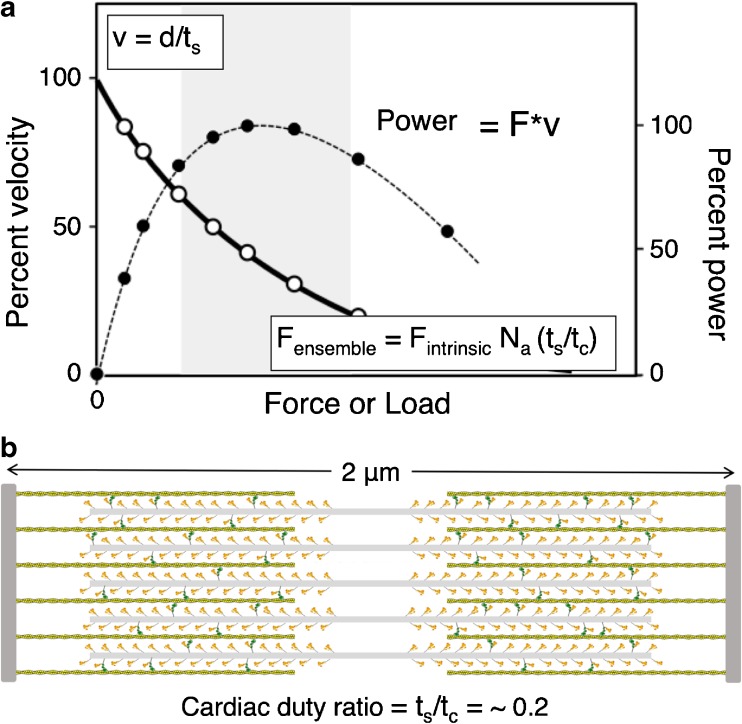
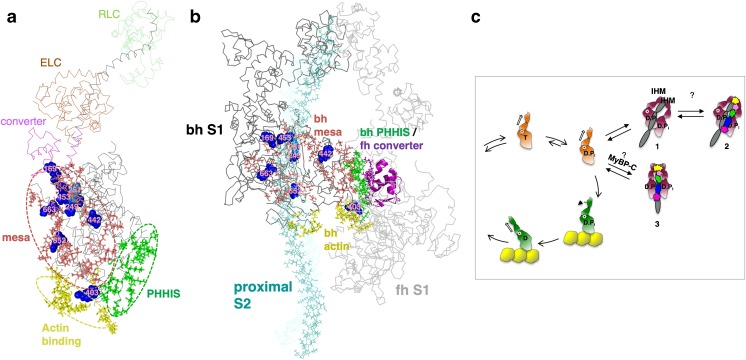
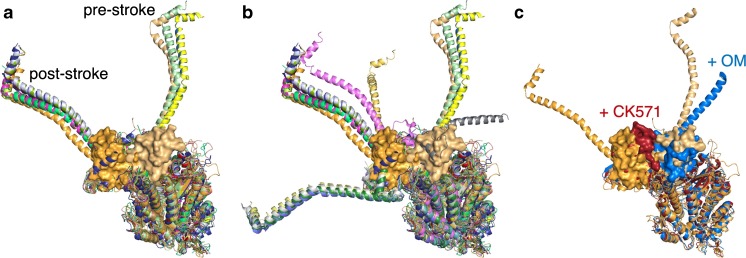
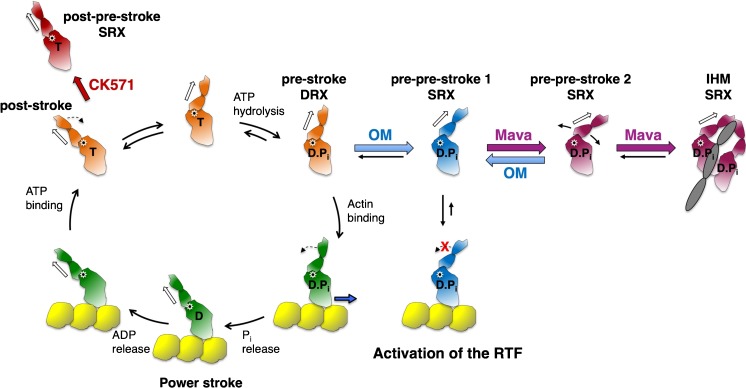
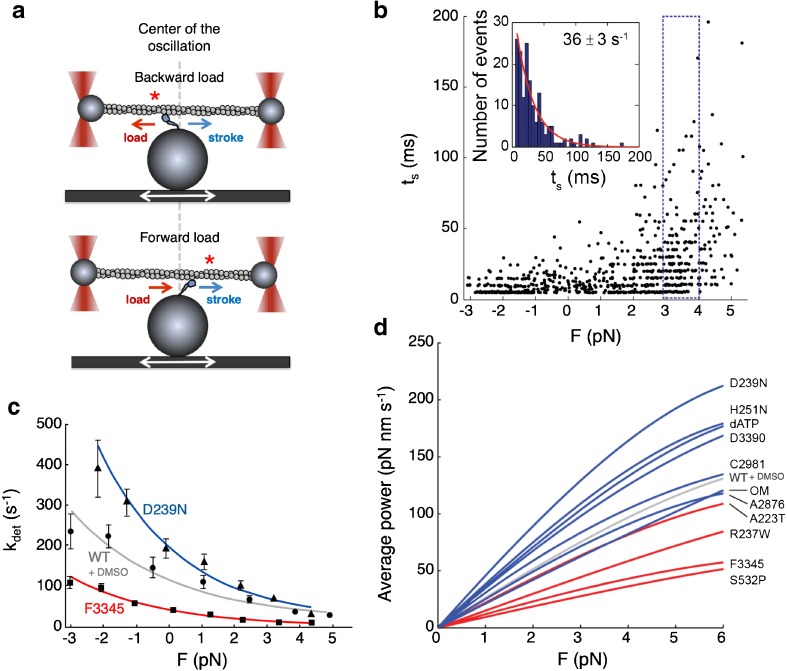
Several lines of evidence suggest that the primary effect of hypertrophic cardiomyopathy mutations in human β-cardiac myosin is hypercontractility of the heart, which leads to subsequent hypertrophy, fibrosis, and myofilament disarray. Here, I describe three perspectives on the molecular basis of this hypercontractility. The first is that hypercontractility results from changes in the fundamental parameters of the actin-activated β-cardiac myosin chemo-mechanical ATPase cycle. The second considers that hypercontractility results from an increase in the number of functionally accessible heads in the sarcomere for interaction with actin. The final and third perspective is that load dependence of contractility is affected by cardiomyopathy mutations and small-molecule effectors in a manner that changes the power output of cardiac contraction. Experimental approaches associated with each perspective are described along with concepts of therapeutic approaches that could prove valuable in treating hypertrophic cardiomyopathy.

Keywords: Hypertrophic cardiomyopathy; Interacting heads motif; Load; Super-relaxed state; β-Cardiac myosin.


Conflict of interest statement

J.A.S. is a cofounder of MyoKardia, a biotechnology company developing small molecules that target the sarcomere for the treatment of inherited cardiomyopathies, and of Cytokinetics and is a member of their scientific advisory boards.

Figures

Fig. 1
Fig. 1
Chemo-mechanical cycle of the interaction of myosin heads with actin. The pre-stroke S1 with bound ADP (D) and inorganic phosphate (Pi) binds to actin (yellow); while bound to actin, the lever arm swings to the left about a fulcrum point (black dot on white star), moving the actin filament to the right (bold blue arrow) with respect to the myosin thick filament; ADP release allows a further small stroke to the post-stroke position and frees the active site for binding of ATP (T); ATP binding weakens the interaction of the S1 to actin; ATP hydrolysis locks the head into the pre-stroke state, which when functionally accessible for interaction with actin is in a disordered relaxed (DRX) state
Fig. 2
Fig. 2
The force-velocity curve for muscle contraction and schematic of the cardiac sarcomere in its relaxed state. a The force-velocity curve (hyperbolic solid line, open circles) refers to how the velocity (v) decreases as a function of the load (F) imposed on the contractile machinery. The shape of the curve depends on how much force the contractile machinery can produce. At any velocity along the curve, the ensemble force of the system matches the equal and opposite load imposed. Power output is the force times the velocity at every point along the curve (dashed line, solid circles). The gray zone is the region of highest power output. b Schematic description of a cardiac sarcomere drawn to scale, depicted at its resting length just beginning its contraction. The sarcomere is 2 μm long, the myosin bipolar thick filaments are 1.6 μm long, and the actin filaments are 0.8 μm long. A duty ratio (the fraction of the functionally accessible heads in a strongly bound force-producing state (green)) of ~ 0.2 is depicted
Fig. 3
Fig. 3
Human β-cardiac myosin structural models. a PyMol homology model of human β-cardiac myosin S1 in the pre-stroke state (HBCprestrokeS1; downloadable at http://spudlab.stanford.edu/homology-models/). Domains of the heavy chain are the mesa surface (salmon), the actin-binding surface (yellow), the primary head-head interaction site of the blocked head in the IHM (green), and the converter (purple). The ELC (brown) and the RLC (green), bound to the light-chain binding domain (gray) of the heavy chain, constitute the lever arm. The positions of the blocked head mesa Arg residues 169, 249, 251, 403, 652, and 663, which when mutated cause HCM, are shown in blue. Modeling was done as described previously [60, 88]. b Homology model of the IHM off state of human β-cardiac myosin (MS03; downloadable at http://spudlab.stanford.edu/homology-models/). The motor domains are dark gray (blocked head; bh) and light gray (free head; fh), the ELCs and RLCs are in shades of gray, and proximal S2 is in cyan. Otherwise, the color scheme is as in (a). c Two possible sequestered states of MyBP-C-bound HMM are shown. One possible state further stabilizes the normal folded-back sequestered state (depicted here as the IHM configuration) while the other is a distinctly different folded sequestered state. Both MyBP-C-bound myosin structural states are highly theoretical and serve as working hypotheses going forward
Fig. 4
Fig. 4
Differing conformations of S1 depending on what ligands are bound. a Nine X-ray crystal structures of the post-stroke state (PDB files 5H53 (skeletal muscle, dark blue), 3I5G (squid, light blue), 315I (squid, red), 3I5I (squid, smudge green), 1SR6 (scallop, lemon green), 1DFK (scallop, pink), 2EC6 (scallop, blue-green), 1S5G (scallop, gold), and 1KK7 (scallop, salmon)), and 3 X-ray crystal structures of the pre-stroke state (PDB files 1DFL (scallop muscle, marine blue), 1EFL (scallop, yellow), and 1QVI (scallop, light green). The HBCprestrokeS1 (cardiac homology model as in Fig. 3; light orange with converter depicted in PyMol surface mode) and the HBCpoststrokeS1 (cardiac homology model, orange with converter depicted in PyMol surface mode) homology models are also shown. All structures and models were aligned using residues from the beginning of the heavy chain N-termini and ending just before the converter domain. b The structures in a plus PDB files 1B7T (scallop, light yellow), 3I5F (squid, bright pink), 2MYS (skeletal, yellow gold), 1KK8 (scallop, light gray), 1KQM (scallop, medium blue), 1KWO (scallop, forest green), 1L2O (scallop, dark teal), and 1BR1 (scallop, medium gray), aligned as in (a). c The HBCprestrokeS1 (cardiac homology model, light orange) and the HBCpoststrokeS1 (cardiac homology model, orange) plus PDB files 5T45 (smooth muscle with CK571 bound, dark red) and 5N69 (cardiac with Omecamtiv mecarbil (OM) bound, medium blue)
Fig. 5
Fig. 5
Chemo-mechanical cycle of the interaction of myosin heads with actin and off-cycle structures with small-molecule ligands bound. CK571-bound S1 (red) in a near post-stroke state. OM-bound S1 (medium blue) in a near pre-stroke state. Mavacamten (Mava)-bound S1 (purple) in a hypothetical pre-pre-stroke state
Fig. 6
Fig. 6
Single-molecule load dependence measurements using harmonic force spectroscopy. a Schematic illustration of the harmonic force spectroscopy technique. The myosin can bind to the actin filament at any position of the oscillating stage, which produces a range of backward and forward loads exerted on the myosin molecule. b Plot of the strongly bound state time (ts) of WT human β-cardiac sS1 bound to actin as a function of backward (resistive, positive force (F) values) and forward (assistive, negative F values) load. The insert shows the number of events as a function of ts derived from the data from the 1-pN bin shown by the dashed rectangle (from + 3 to + 4 pN). Fitting the data to a single exponential gave a detachment rate constant (kdet) of 36 ms. c Plot of kdet as a function of the load (F) for the HCM mutant D239N human β-cardiac sS1 (blue), WT human β-cardiac sS1 with the small-molecule inhibitor F3345 bound (red), and WT human β-cardiac sS1 in 2% DMSO (small-molecule experiments were carried out in 2% DMSO; the WT without DMSO curve was very similar). d Plot of the average power output as a function of load (F) for WT human β-cardiac sS1 with small-molecule activators bound and 2 HCM sS1 mutants (blue), and human β-cardiac sS1 with a small-molecule inhibitor bound, and 3 DCM sS1 mutants (red). The WT + DMSO control is shown in light gray

Similar articles

Cited by

References

    1. Ababou A, Rostkova E, Mistry S, Le Masurier C, Gautel M, Pfuhl M. Myosin binding protein C positioned to play a key role in regulation of muscle contraction: structure and interactions of domain C1. J Mol Biol. 2008;384:615–630. - PMC - PubMed
    1. Adhikari AS, Kooiker KB, Sarkar SS, Liu C, Bernstein D, Spudich JA, Ruppel KM. Early-onset hypertrophic cardiomyopathy mutations significantly increase the velocity, force, and actin-activated ATPase activity of human beta-cardiac myosin. Cell Rep. 2016;17:2857–2864. - PMC - PubMed
    1. Adhikari AS, Trivedi DV, Sarkar SS, Song D, Kooiker KB, Bernstein D, Spudich JA, Ruppel KM (2019) Hypertrophic cardiomyopathy mutations at the folded-back sequestered β-cardiac myosin S1-S2 and S1-S1 interfaces release sequestered heads and increase myosin enzymatic activity. BioRxiv. 10.1101/537159 - PMC - PubMed
    1. Aksel T, Choe Yu E, Sutton S, Ruppel KM, Spudich JA. Ensemble force changes that result from human cardiac myosin mutations and a small-molecule effector. Cell Rep. 2015;11:910–920. - PMC - PubMed
    1. Al-Khayat HA, Kensler RW, Squire JM, Marston SB, Morris EP. Atomic model of the human cardiac muscle myosin filament. Proc Natl Acad Sci U S A. 2013;110:318–323. - PMC - PubMed

Publication types

MeSH terms

Substances

LinkOut - more resources