

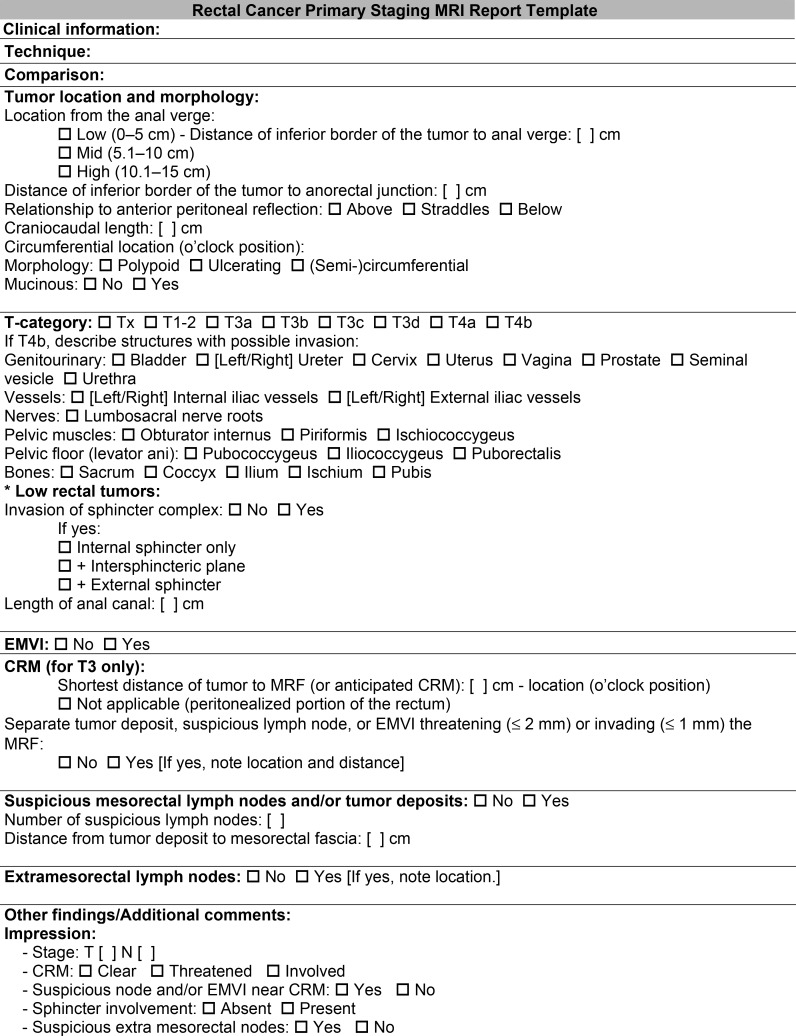
MRI of Rectal Cancer: Tumor Staging, Imaging Techniques, and Management
- PMID: 30768361
- PMCID: PMC6438362
- DOI: 10.1148/rg.2019180114
MRI of Rectal Cancer: Tumor Staging, Imaging Techniques, and Management
Abstract
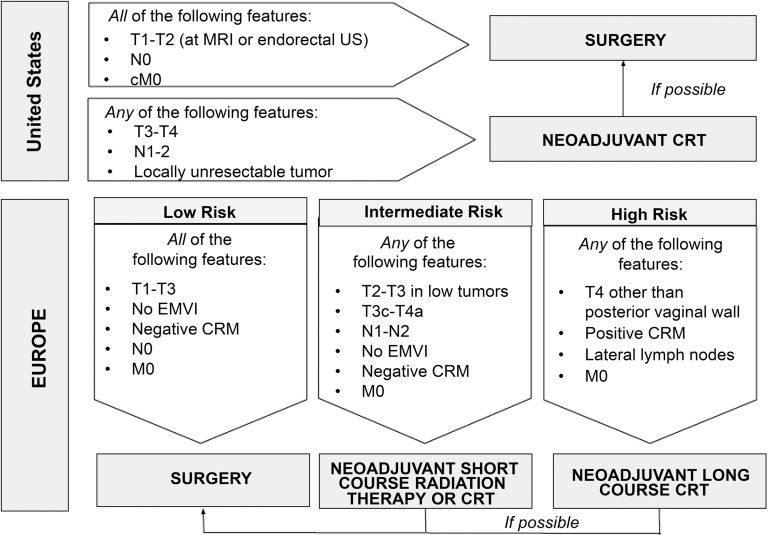
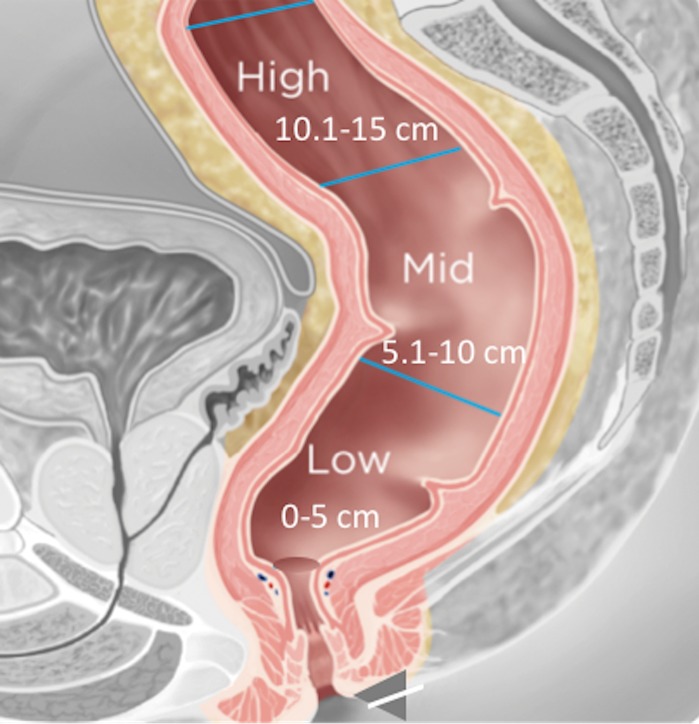
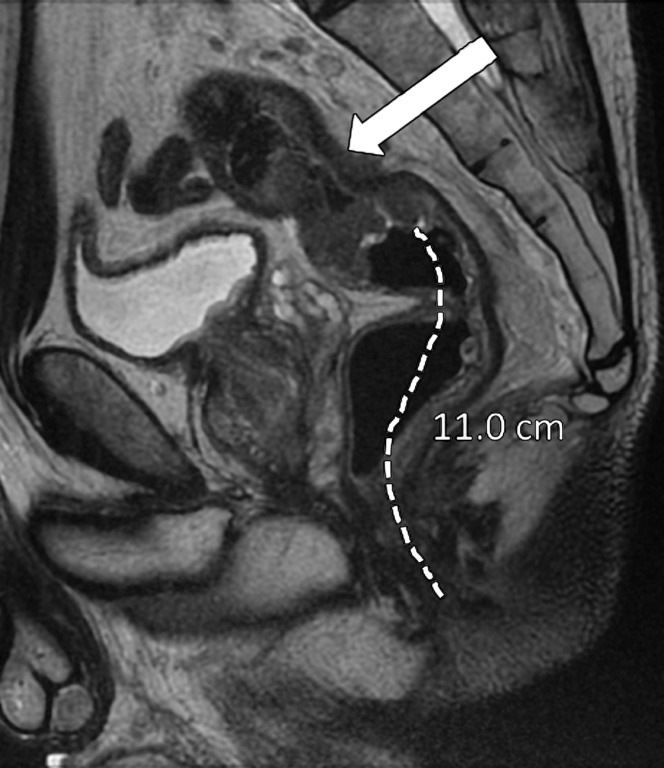
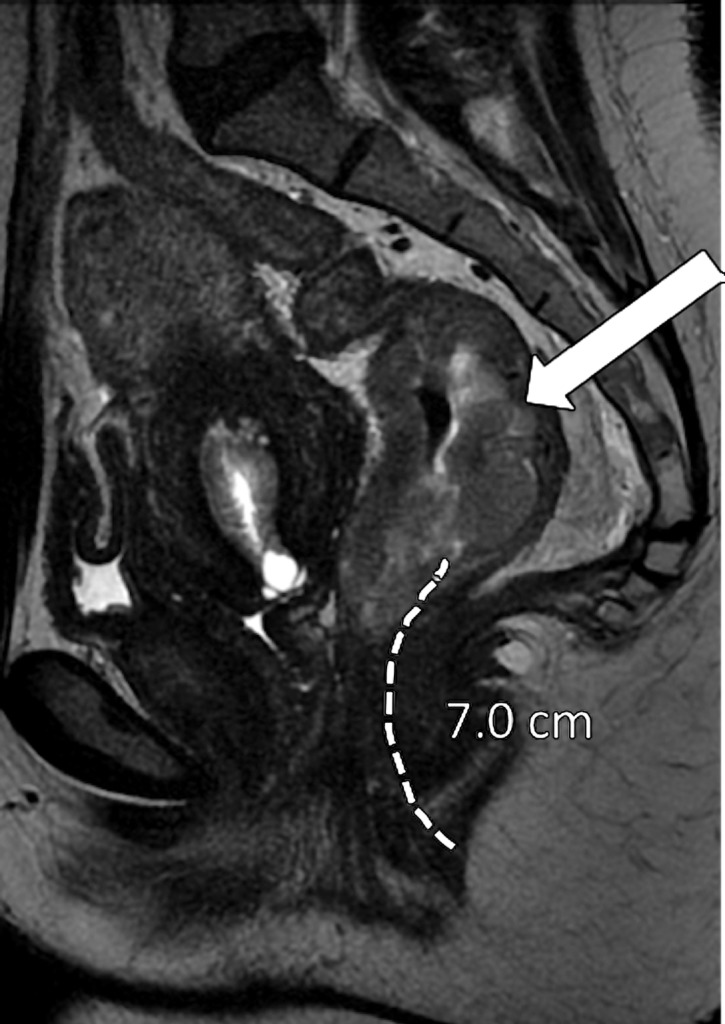
Rectal cancer is prone to local recurrence and systemic metastasis. However, owing to improvements in TNM staging and treatment, including a more widespread use of rectal MRI and increased radiologist awareness of the key rectal cancer TNM staging features, the mortality rate of rectal cancer has been declining over the past few decades in adults over 50 years of age. Currently, rectal MRI plays a key role in the pre- and posttreatment evaluation of rectal cancer, assisting the multidisciplinary team in tailoring the most appropriate treatment option. The benefits achieved with rectal MRI are strictly dependent on obtaining good-quality images, which is important for the characterization of the main anatomic structures and their relationship with the tumor. In primary staging, rectal MRI helps the radiologist (a) describe the tumor location and morphology, (b) provide its T and N categories, (c) detect the presence of extramural vascular invasion, and (d) identify its relationship with surrounding structures, including the sphincter complex and involvement of the mesorectal fascia. These features help diagnose locally advanced rectal tumors (categories T3c-d, T4, N1, and N2), for which neoadjuvant chemoradiotherapy (CRT) is indicated. In restaging after neoadjuvant CRT, in addition to reassessing the features noted during primary staging, rectal MRI can help in the assessment of treatment response, especially with the emergence of nonsurgical approaches such as "watch and wait." ©RSNA, 2019.
Figures
References
-
- Ferlay J, Soerjomataram I, Dikshit R, et al. Cancer incidence and mortality worldwide: sources, methods and major patterns in GLOBOCAN 2012. Int J Cancer 2015;136(5):e359–e386. - PubMed
-
- American Cancer Society . Cancer facts and figures: 2018. https://www.cancer.org/content/dam/cancer-org/research/cancer-facts-and-.... Accessed May 1, 2018.
-
- Nagtegaal I, Gaspar C, Marijnen C, Van De Velde C, Fodde R, Van Krieken H. Morphological changes in tumour type after radiotherapy are accompanied by changes in gene expression profile but not in clinical behaviour. J Pathol 2004;204(2):183–192. - PubMed
-
- Heald RJ, Ryall RD. Recurrence and survival after total mesorectal excision for rectal cancer. Lancet 1986;1(8496): 1479–1482. - PubMed
Publication types
MeSH terms
Grants and funding
LinkOut - more resources
Full Text Sources
Medical
Research Materials
Miscellaneous
