. 2019 Feb 15;17(2):e2006732.
doi: 10.1371/journal.pbio.2006732. eCollection 2019 Feb.

Fast near-whole-brain imaging in adult Drosophila during responses to stimuli and behavior

Affiliations

Fast near-whole-brain imaging in adult Drosophila during responses to stimuli and behavior

Sophie Aimon et al. PLoS Biol. .

Abstract

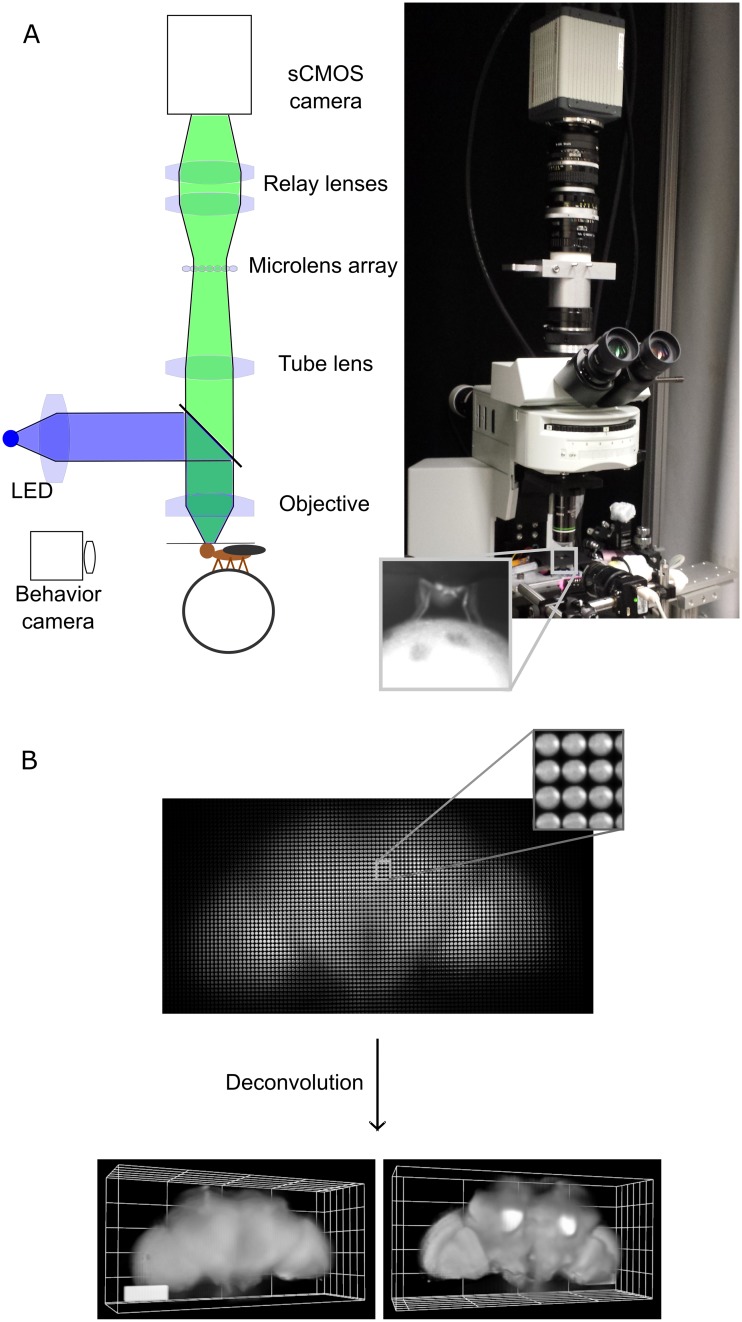
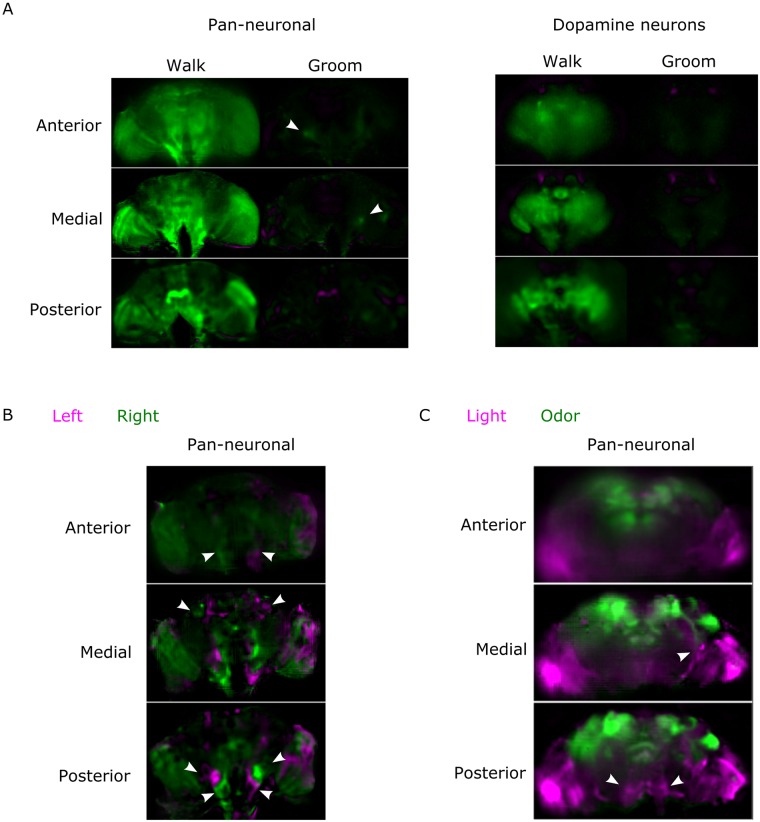
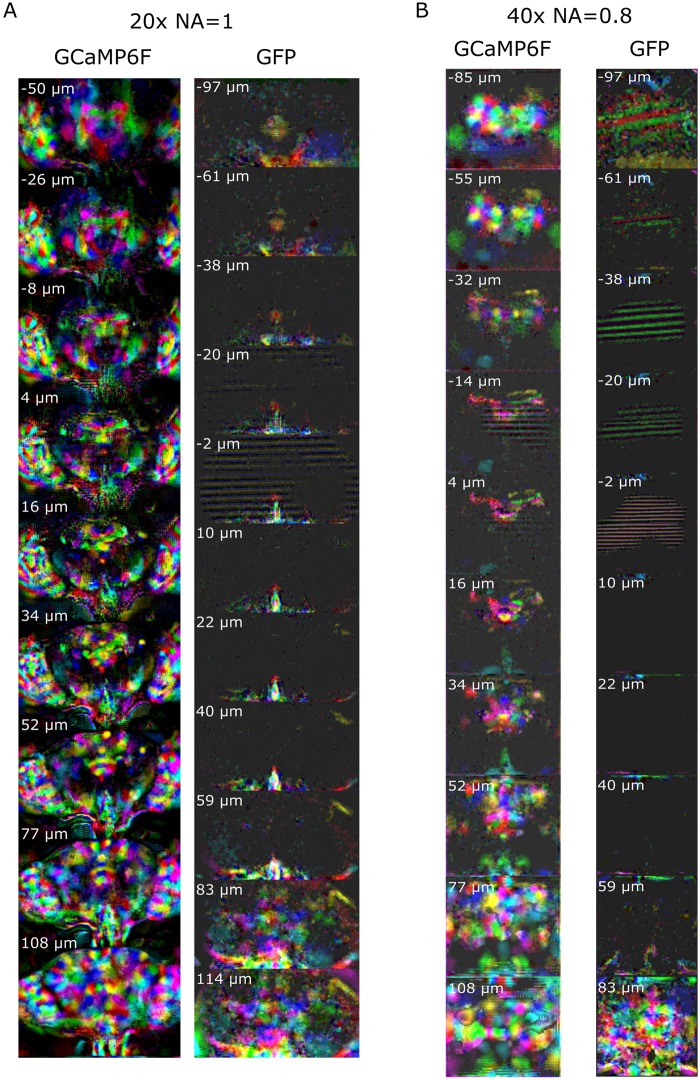
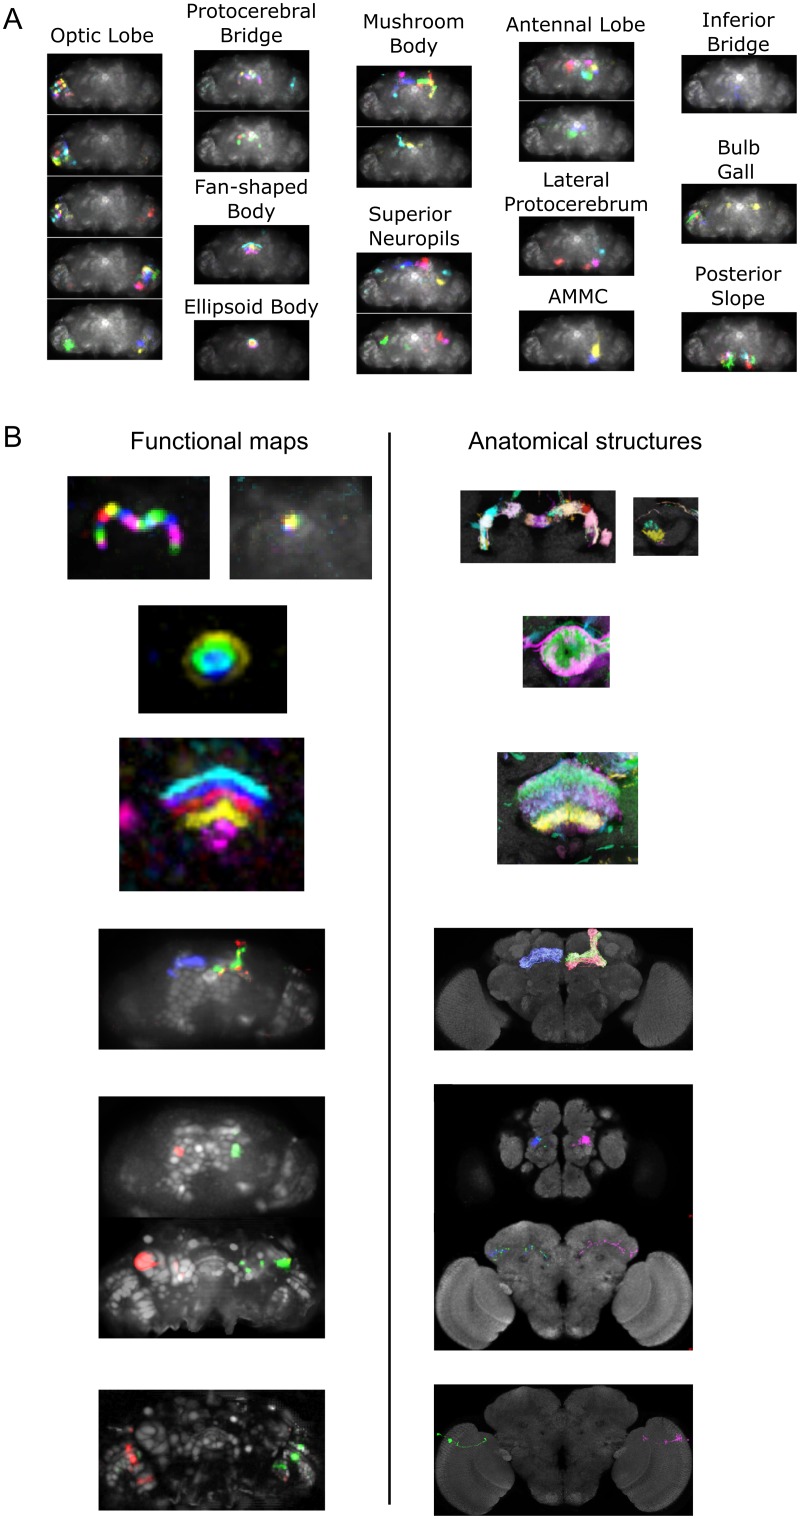
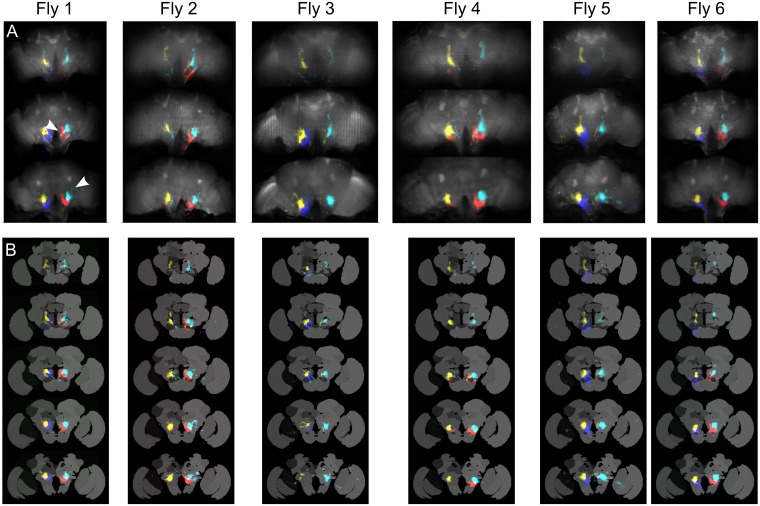
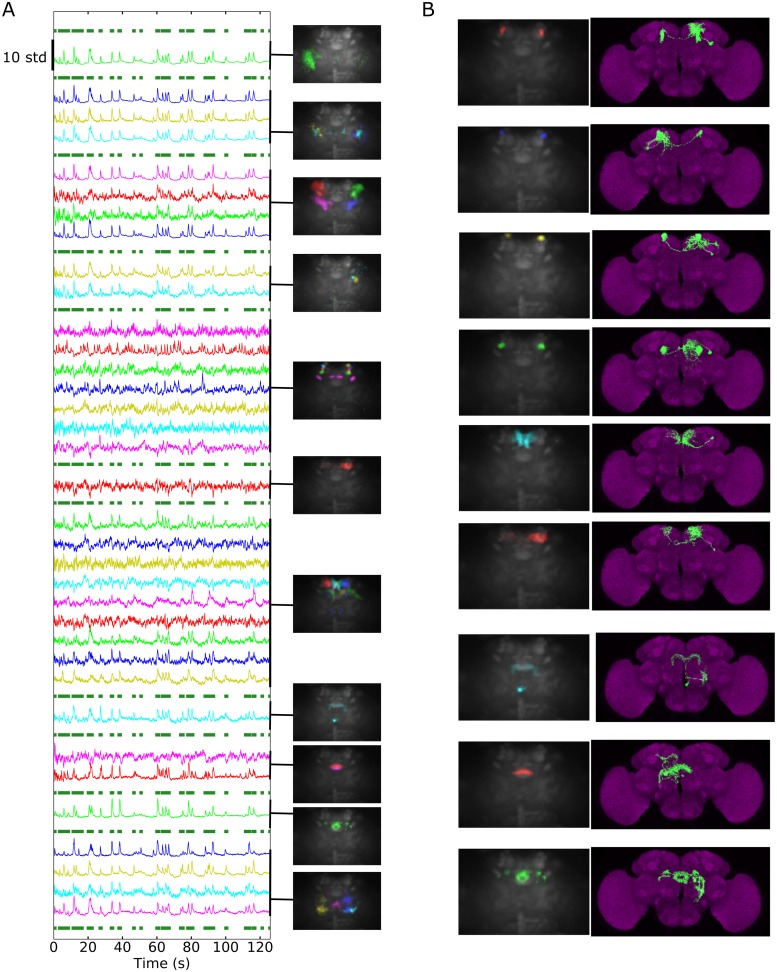
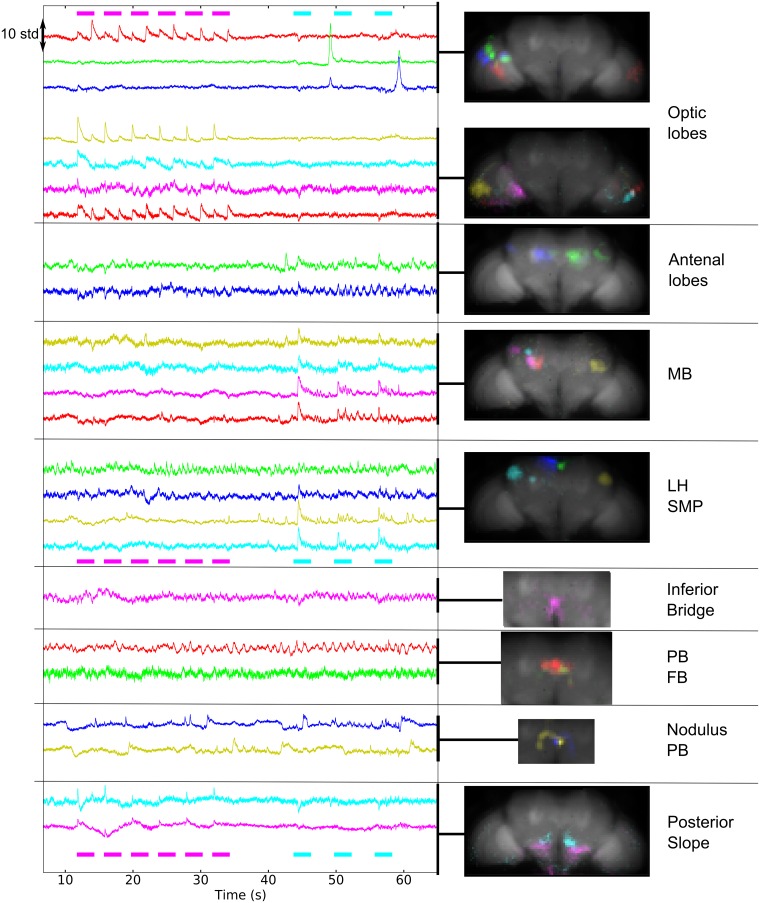
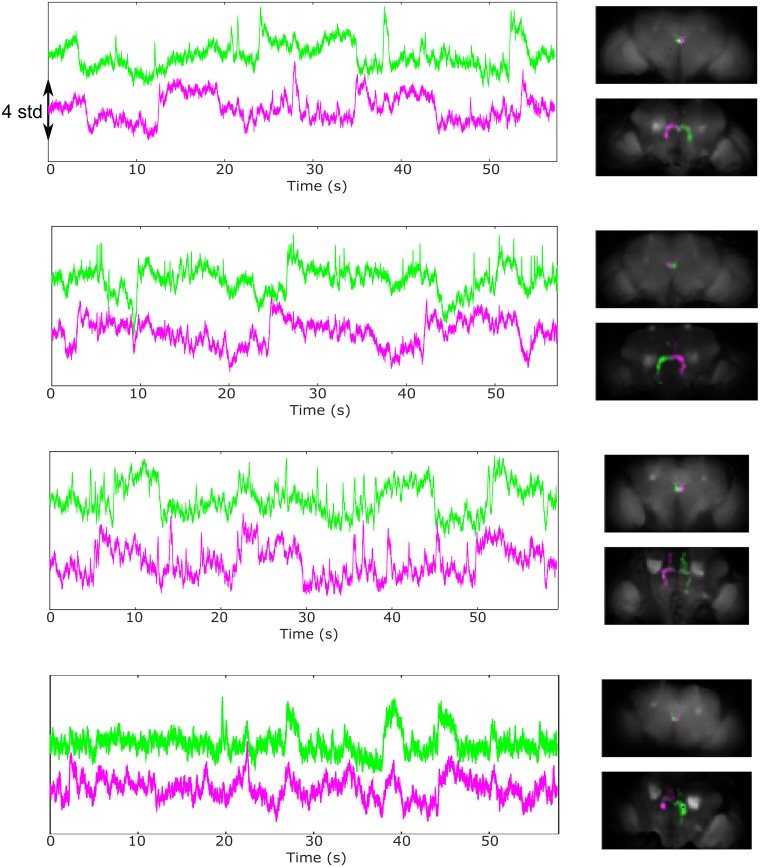
Whole-brain recordings give us a global perspective of the brain in action. In this study, we describe a method using light field microscopy to record near-whole brain calcium and voltage activity at high speed in behaving adult flies. We first obtained global activity maps for various stimuli and behaviors. Notably, we found that brain activity increased on a global scale when the fly walked but not when it groomed. This global increase with walking was particularly strong in dopamine neurons. Second, we extracted maps of spatially distinct sources of activity as well as their time series using principal component analysis and independent component analysis. The characteristic shapes in the maps matched the anatomy of subneuropil regions and, in some cases, a specific neuron type. Brain structures that responded to light and odor were consistent with previous reports, confirming the new technique's validity. We also observed previously uncharacterized behavior-related activity as well as patterns of spontaneous voltage activity.


Conflict of interest statement

The authors have declared that no competing interests exist.

Figures

Fig 1
Fig 1. Imaging the brain of adult behaving flies using light field microscopy.
A) Experimental setup. The fly is head fixed, and its tarsi are touching a ball. The light from the brain’s fluorescence goes through the objective, the microscope tube lens, a microlens array, and relay lenses onto the sensor of a high-speed sCMOS camera. Another camera in front of the fly records its behavior. B) Example of a light field deconvolution (fly’s genotype: nsyb-Gal4, UAS-ArcLight). Top: 2D light field image acquired in 5 ms—one camera acquisition period—with a 20x NA 1.0 objective. Bottom: anterior and posterior views (slightly tilted sideways) of the computationally reconstructed volume. 3D bar is 90 x 30 x 30 microns. See also S1–S3 Figs. NA, numerical aperture; nysb-Gal4, nSynaptobrevin-Gal4; sCMOS, scientific complementary metal-oxide-semiconductor.
Fig 2
Fig 2. Near-whole brain activity maps for various conditions.
A) Comparison of fluorescence intensity when the fly rests and when it is active (either walking or grooming). The pixel value is green if the fluorescence is higher during the behavior and magenta if the fluorescence is higher during rest. Arrows point to regions (in the antennal mechanosensory and motor center) corresponding to the higher average change between groom and rest among flies (see also S9 Fig). The pan-neuronal driver was nsyb-Gal4 and the dopamine driver was TH-Gal4. Both flies expressed GCaMP6f. Note that there is an angle (39 degrees for the pan-neuronal experiment and 20 degrees for the dopamine experiment) between the z-axis and the anterior—posterior axis. B) Comparison of fluorescence intensity when the fly turns left or right. The arrows point to regions (in the posterior slope, gnathal ganglia, and superior lateral protocerebrum or anterior tubercule) symmetrical and reproducible from fly to fly. The fly’s genotype was nsyb-Gal4 and UAS-GCaMP6f. Note that there is a 40 degree angle between the z-axis and the anterior—posterior axis. The pixel value is green if the fluorescence is higher during turning left, magenta if the fluorescence is higher during turning right. C) Comparison of fluorescence increase during the response to stimuli for odor (magenta) and light (green). The arrows point to the posterior slope (bottom panel) and the optical glomeruli (middle panel). The fly’s genotype was Cha-Gal4, GMR57C10-Gal4, and UAS-GCaMP6f. Note that the brain is tilted 19 degrees along the lateral axis. See also S4–S9 Figs. Data can be found on CNCRS.org (http://dx.doi.org/10.6080/K01J97ZN). CNCRS, Collaborative Research in Computational Neuroscience; nsyb-Gal4, nSynaptobrevin-Gal4; TH-Gal4, tyrosine hydroxylase-Gal4; Cha-Gal4, choline acetyltransferase-Gal4.
Fig 3
Fig 3. Z-stack slices of the 3D map for all the components extracted using PCA/ICA.
The maps from calcium activity (GCaMP6f) are compared with the maps obtained with an activity-independent fluorophore (GFP). Different colors are assigned randomly to different components. Note that the slice depth is larger when it is farther from the middle of the brain (see Methods section). See S10 and S11 Figs for maps aligned to an anatomical template and S12 Fig for examples of individual artifactual components. GCaMP6f data can be found on CNCRS.org (http://dx.doi.org/10.6080/K01J97ZN). CNCRS, Collaborative Research in Computational Neuroscience; GFP, green fluorescent protein; ICA, independent component analysis; PCA, principal component analysis.
Fig 4
Fig 4. Functional components match anatomical structures.
A) Components automatically sorted by region and projected along the z-axis. Note that the sorting (the component’s maps are averaged in anatomical regions of interest) could be inaccurate in the case of maps containing small parts of large regions and noise in very small regions (i.e., the bulb or gall). Data can be found on CNCRS.org (http://dx.doi.org/10.6080/K01J97ZN). B) Comparison between functional and anatomical maps. Left: functional maps from a pan-neuronal (GMR57C10-Gal4 and Cha-Gal4) GCaMP6f experiment. Right: corresponding anatomical structures. Maps were constructed using the Virtual Fly Brain database. Three bottom images show neurons from major neuron types (three different Kenyon cell types, antennal lobe projection neuron, and transmedullar neurons) matching the functional maps. The brain for the functional data is tilted 19 degrees along the lateral axis compared to the template presented on the right. Note that functional maps in the fan-shaped body are the same scale as functional maps obtained with microscopy techniques with higher resolution [17]. See also S13–S17 Figs for consideration regarding the associated time series. Cha-Gal4, choline acetyltransferase-Gal4; CNCRS, Collaborative Research in Computational Neuroscience.
Fig 5
Fig 5. Z-stacks of components among the six most correlated to turning left (cyan and blue) or right (red and yellow).
Each color corresponds to one component. Flies expressed GCaMP6 pan-neuronally. A) Anterior, medial, and posterior slices in the original orientation. The arrows point to characteristic shapes (inverted V for blue and red and fine claw-like dorsal neurites for yellow and cyan). B) The same components aligned to an anatomical template’s z-stack. See also S18 Fig. Data can be found on CNCRS.org (http://dx.doi.org/10.6080/K01J97ZN). CNCRS, Collaborative Research in Computational Neuroscience.
Fig 6
Fig 6. Components from flies expressing GCaMP6f in dopamine neurons (TH-Gal4 driver).
A) All activity-related components are presented and sorted by brain region, with the color of the time series (which are variance normalized) on the left, matching the color of the maps on the right (e.g., the first image corresponds to the first trace, the second image to the next three traces, and so on). Note that most components are strongly correlated with the fly walking (forest green traces interleaved with the component traces). The fly was resting or grooming the rest of the time. Data can be found on CNCRS.org (http://dx.doi.org/10.6080/K01J97ZN). B) Example of TH-positive neuron from the Virtual Fly Brain database (right) matching the components’ maps (left). Note that the brain is tilted 20 degrees along the lateral axis compared to the template presented on the right. (See also S19 Fig). CNCRS, Collaborative Research in Computational Neuroscience; TH-Gal4, tyrosine hydroxylase-Gal4; Cha-Gal4, choline acetyltransferase-Gal4.
Fig 7
Fig 7. Components extracted from voltage activity.
ArcLight was expressed pan-neuronally (nsyb-Gal4). The fly was presented with periodic flashes of UV light (violet bars) and puffs of apple cider vinegar (pink bars). The component time series are shown on the left (variance normalized), and the corresponding maps are on the right, sorted by the brain region that was majorly present in the map. Note that the coronal plane was tilted 37 degrees away from the horizontal plane for this fly. See also S20–S23 and S25 Figs. Data can be found on CNCRS.org (http://dx.doi.org/10.6080/K01J97ZN). CNCRS, Collaborative Research in Computational Neuroscience; FB, fan-shaped body; LH, lateral horn; MB, mushroom body, nsyb-Gal4, nSynaptobrevin-Gal4; PB, protocerebral bridge; SMP, superior medial protocerebrum.
Fig 8
Fig 8. Spontaneous switches between up- and down-activity states for components in a nodulus and the contralateral part of the protocerebral bridge.
We detected these components in all flies examined (genotype: UAS_ArcLight and from top to bottom: nsyb-Gal4, nsyb-Gal4, Cha-Gal4, and GMR57C10-Gal4, nsyb-Gal4). The images on the right present the two components (in different colors) at two different z planes (at the level of the noduli and fan-shaped body and at the level of the protocerebral bridge). Note that the flies were not walking in those experiments. See also S24 Fig. Cha-Gal4, choline acetyltransferase-Gal4; nsyb-Gal4, nSynaptobrevin-Gal4.

References

    1. Tomer R, Lovett-Barron M, Kauvar I, Andalman A, Burns VM, Sankaran S, et al. SPED Light Sheet Microscopy: Fast Mapping of Biological System Structure and Function. Cell. Cell Press; 2015;163: 1796–1806. - PMC - PubMed
    1. Lemon WC, Pulver SR, Hockendorf B, McDole K, Branson K, Freeman J, et al. Whole-central nervous system functional imaging in larval Drosophila. Nat Commun. Nature Publishing Group, a division of Macmillan Publishers Limited. All Rights Reserved.; 2015;6 Available: 10.1038/ncomms8924 - DOI - PMC - PubMed
    1. Broxton M, Grosenick L, Yang S, Cohen N, Andalman A, Deisseroth K, et al. Wave optics theory and 3-D deconvolution for the light field microscope. Opt Express. 2013;21: 25418–39. 10.1364/OE.21.025418 - DOI - PMC - PubMed
    1. Prevedel R, Yoon Y-G, Hoffmann M, Pak N, Wetzstein G, Kato S, et al. Simultaneous whole-animal 3D imaging of neuronal activity using light-field microscopy. Nat Methods. 2014;11: 727–30. 10.1038/nmeth.2964 - DOI - PMC - PubMed
    1. Levoy M, Ng R, Adams A, Footer M, Horowitz M. Light field microscopy. ACM Trans Graph. 2006;25: 924 10.1145/1141911.1141976 - DOI

Publication types

LinkOut - more resources