. 2019 Feb 15;14(2):e0212337.
doi: 10.1371/journal.pone.0212337. eCollection 2019.

Huntingtin associates with the actin cytoskeleton and α-actinin isoforms to influence stimulus dependent morphology changes

Affiliations

Huntingtin associates with the actin cytoskeleton and α-actinin isoforms to influence stimulus dependent morphology changes

Adelaide Tousley et al. PLoS One. .

Abstract

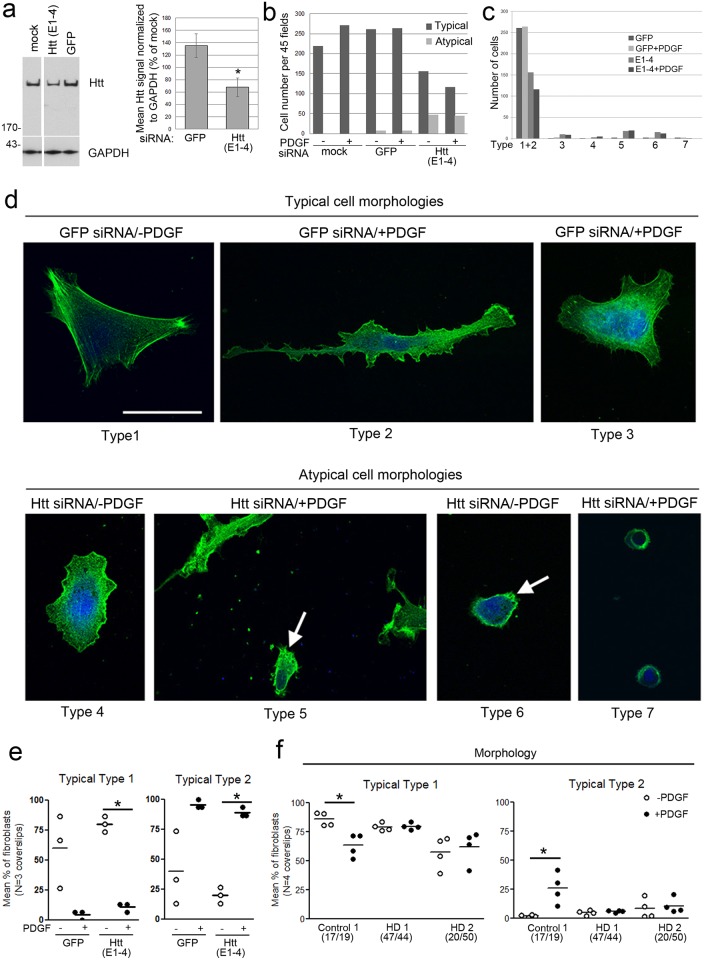
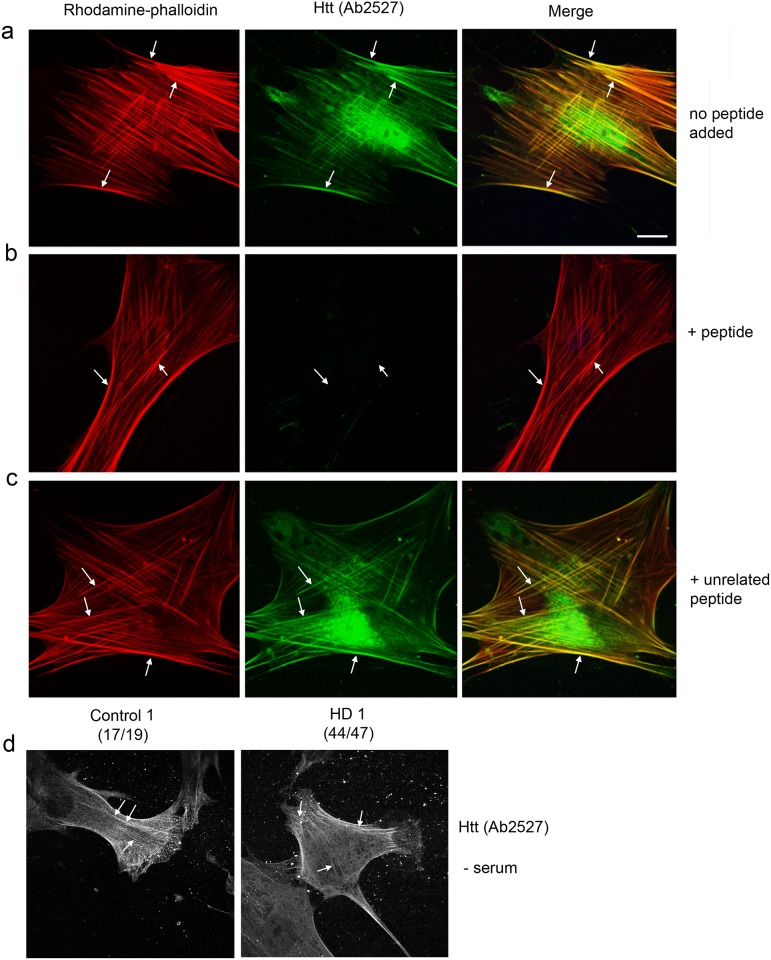
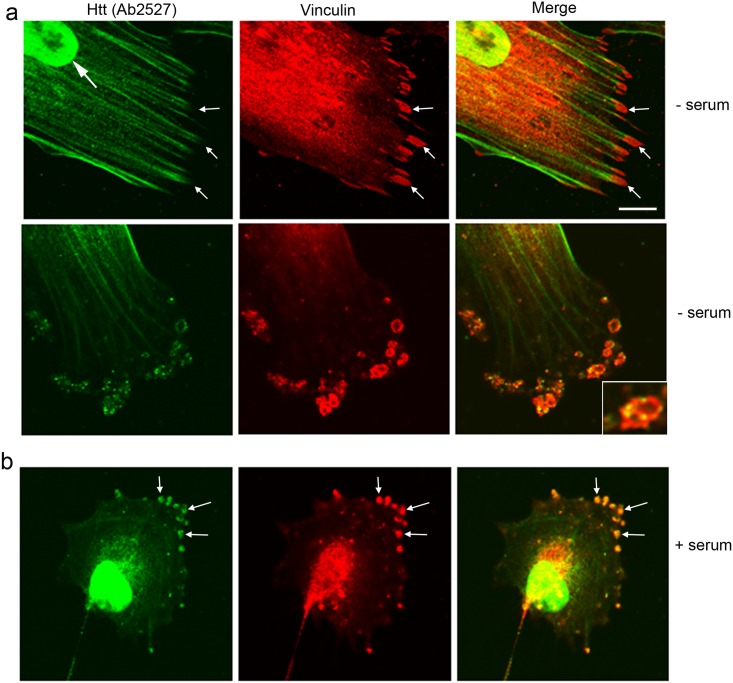
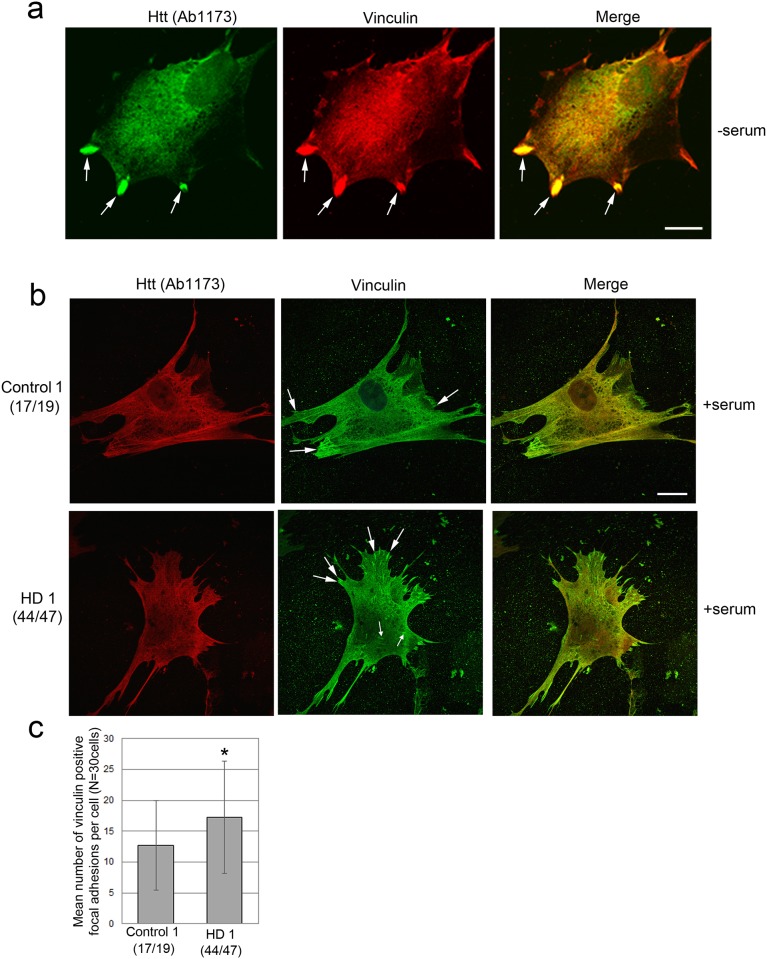
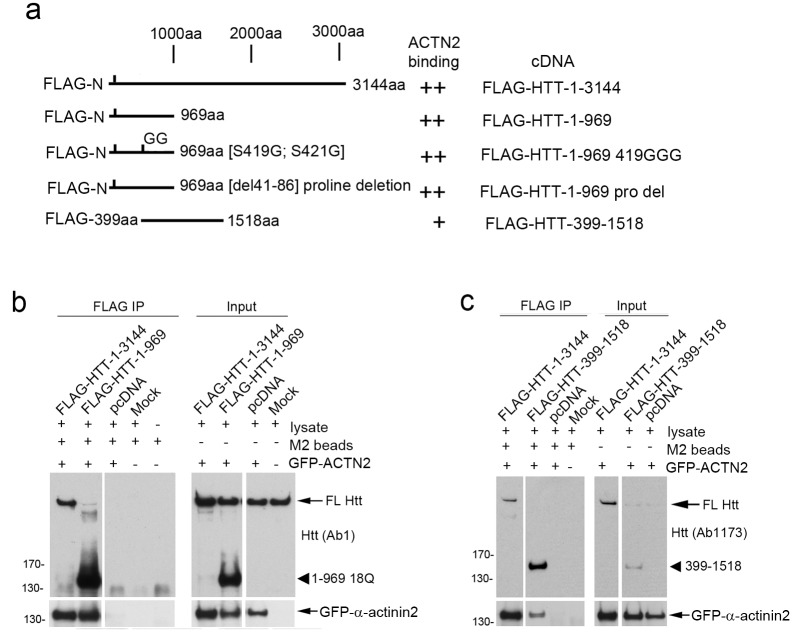
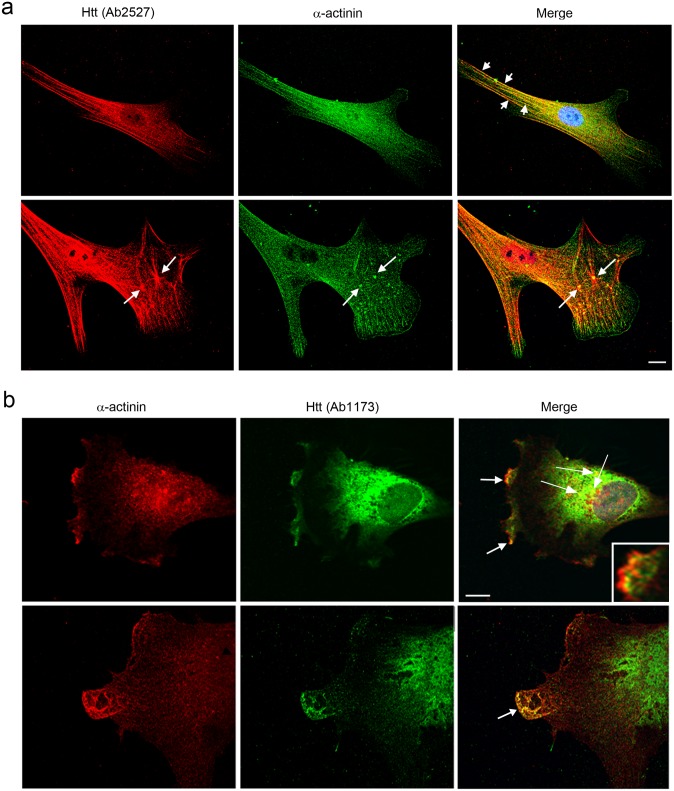
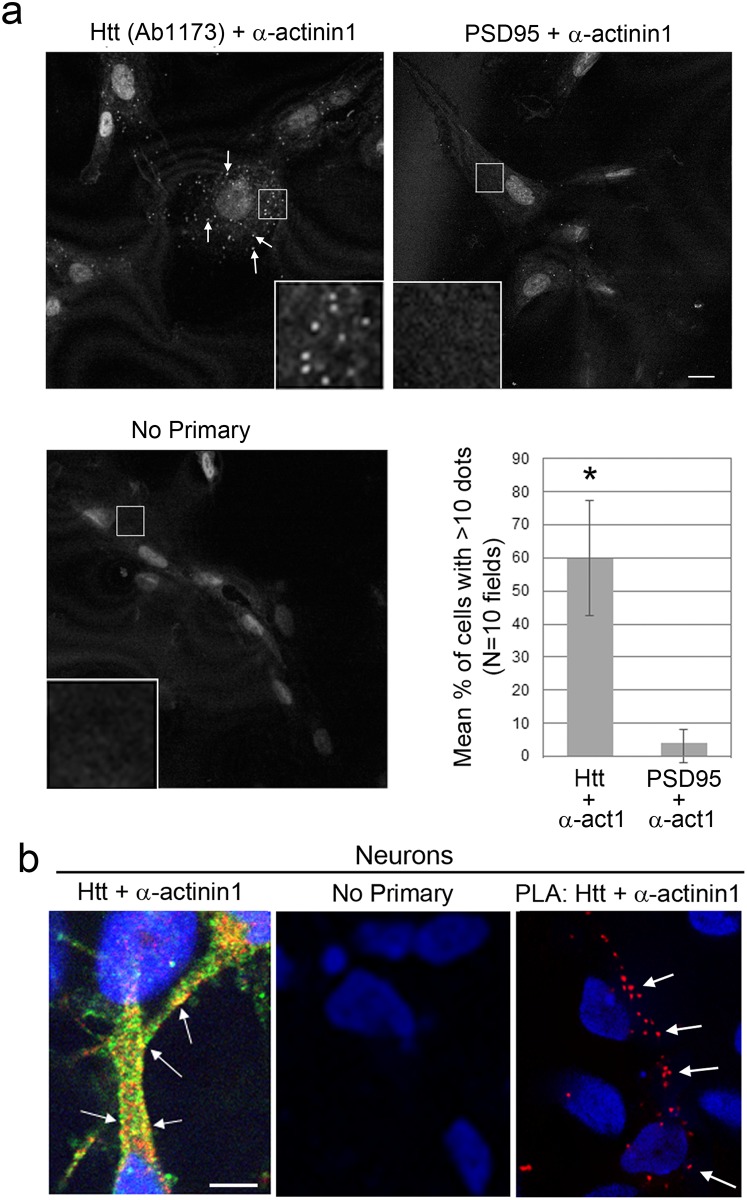
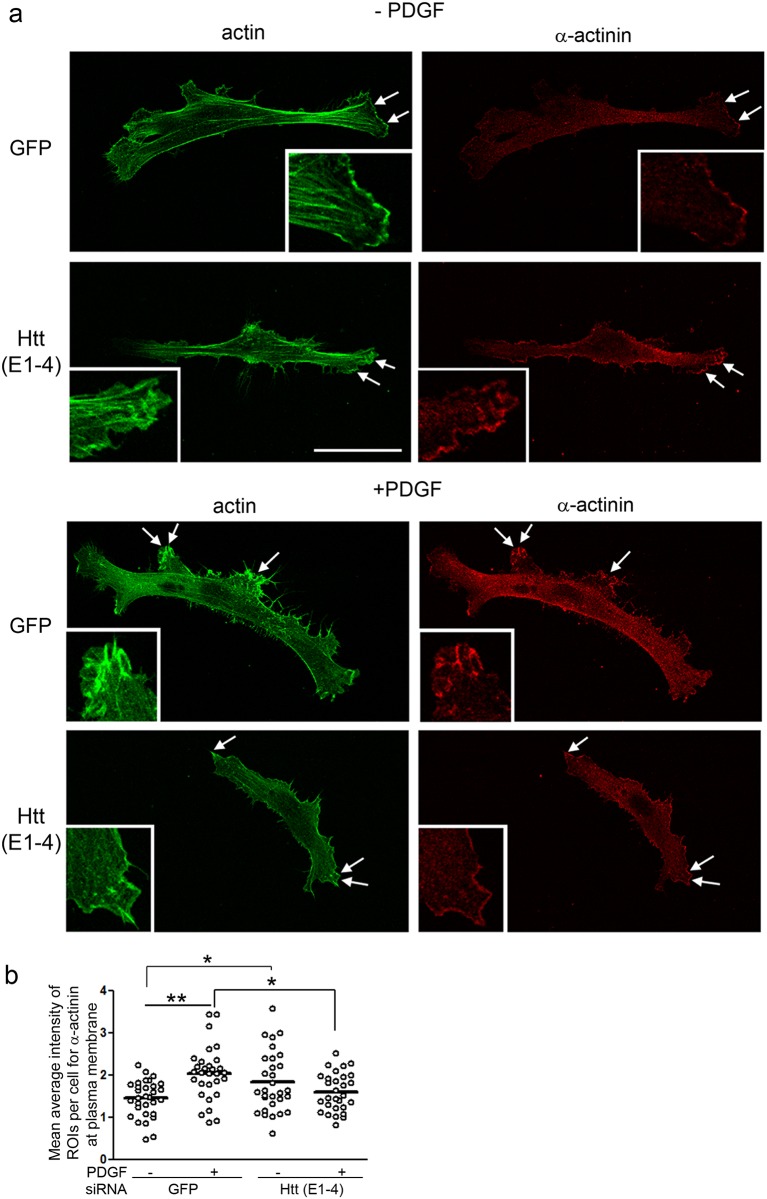
One response of cells to growth factor stimulus involves changes in morphology driven by the actin cytoskeleton and actin associated proteins which regulate functions such as cell adhesion, motility and in neurons, synaptic plasticity. Previous studies suggest that Huntingtin may be involved in regulating morphology however, there has been limited evidence linking endogenous Huntingtin localization or function with cytoplasmic actin in cells. We found that depletion of Huntingtin in human fibroblasts reduced adhesion and altered morphology and these phenotypes were made worse with growth factor stimulation, whereas the presence of the Huntington's Disease mutation inhibited growth factor induced changes in morphology and increased numbers of vinculin-positive focal adhesions. Huntingtin immunoreactivity localized to actin stress fibers, vinculin-positive adhesion contacts and membrane ruffles in fibroblasts. Interactome data from others has shown that Huntingtin can associate with α-actinin isoforms which bind actin filaments. Mapping studies using a cDNA encoding α-actinin-2 showed that it interacts within Huntingtin aa 399-969. Double-label immunofluorescence showed Huntingtin and α-actinin-1 co-localized to stress fibers, membrane ruffles and lamellar protrusions in fibroblasts. Proximity ligation assays confirmed a close molecular interaction between Huntingtin and α-actinin-1 in human fibroblasts and neurons. Huntingtin silencing with siRNA in fibroblasts blocked the recruitment of α-actinin-1 to membrane foci. These studies support the idea that Huntingtin is involved in regulating adhesion and actin dependent functions including those involving α-actinin.


Conflict of interest statement

Kimberly Kegel-Gleason is on the editorial board of PLOS ONE. KKG’s spouse owns less than 0.1% stock in the following companies: Bristol-Myers Squibb Company, Cisco Systems, Inc., GE Healthcare Life Sciences, Generex Biotechnology Corporation, GlaxoSmithKline, Metabolix Bioplastics, Nanogen, Inc., Nanometrics, inc., StemCells, Inc. All purchases are compliant with Research Procurement standards that both individual and organizational conflicts of interest compliance with Uniform Guidance (UG) Procurement Standards issued by the Office of Management and Budget (OMB). This does not alter our adherence to PLOS ONE policies on sharing data and materials. No other authors have conflicts of interest to report. All other authors declare that they have no conflicts of interest with the contents of this article.

Figures

Fig 1
Fig 1. Acute loss of endogenous Huntingtin changes cell morphology.
(a) Western blots show Huntingtin signal is reduced in Control 1 fibroblasts treated with siRNA targeting exon1 of Huntingtin (E1-4) compared to cells treated with siRNA against GFP (a control siRNA) or mock treated cells. Full blots are shown in S1a Fig. Graph shows mean ±SD for Huntingtin (Htt) total pixel intensity standardized to GAPDH as percent of mock treated cells from western blots (*p<0.01, n = 4 biological replicates, unpaired t-test compared to GFP. (b) Graph shows total number of Typical and Atypical cells identified using F-actin labeling. Results are shown for mock (no siRNA plus transfection reagent), siRNA targeting GFP or siRNA targeting Huntingtin (E1-4) and in the absence or presence of 100 ng/ml PDGF for 15 min. Total cell number counted for each group was mock, 219 cells; mock + PDGF, 271 cells; GFP siRNA, 269 cells; GFP siRNA + PDGF, 272 cells; Huntingtin siRNA, 203 cells, Huntingtin siRNA+ PDGF, 161cells (3 coverslips per group). Populations were compared using Pearson’s chi square test (p = 1.25 E-22), Mantel-Haenszel analysis and showed a highly significant change in cell shape in response to treatment with Huntingtin (E1-4) when controlled for PDGF treatment (p<2.2e-16; confidence interval is p<0.05) and no change in cell shape in response to PDGF treatment when controlled for treatment with Huntingtin (E1-4) (p = 0.4103). (c) Graph shows breakdown of cell counts for each category shown in Fig 1b and described in d. (d) F-actin labeling in primary fibroblasts. Sample of representative images of cells with “Typical” morphologies (Types 1–3) found in control cultures and “Atypical” morphologies (Types 4–7). “Typical” morphology (Types 1–3) have flat, polarized or non-polarized shape, have cytoplasm is well-spread with stress fibers (Type 1) or without stress fibers (Types 2 and 3), and some with ruffled membranes or lamellapodia (Type 2). “Atypical” morphology (Types 4–7) are moderately spread and have high proportion of ruffling of the plasma membrane (Type 4), are not well spread with some apparent retraction of the cytoplasm toward the nucleus (Type 5, arrow), are rounded with short adherent extensions off the plasma membrane (Type 6, arrow), or are fully rounded with no apparent adhesions (Type 7). Cells stained with Alexa-Phalloidin. Scale bar = 50 μm and applies to all images in d. (e) SiRNA treated Control 1 cells were assessed for morphology Types 1 and 2 in serum starved or stimulated with 100 ng/ml PDGF for 15 minutes. Graph shows mean percent ±SD. *<0.05, paired t-test, n = 3 coverslips. (f) Control 1 (17/19) and two HD human fibroblast lines (HD1 47/44 and HD2 20/50) were assessed in parallel for morphology types described in d. Cells were serum starved or stimulated with 100 ng/ml PDGF for 15 min. Graphs show mean percent ±SD for number of Type 1 (left) and Type 2 (right)’ Typical cells and Type 8 Atypical cells are shown in S2c Fig. A significant loss of Type 1 cells and a gain of Type 2 cells occurs in Control 1 fibroblasts with stimulation reflecting membrane ruffling (Two-way ANOVA and Bonferroni posthoc test, *p<0.05, n = 4 coverslips). Numbers in parentheses on x-axis indicate CAG repeat length for each Huntingtin allele in each cell.
Fig 2
Fig 2. Huntingtin co-localizes with F-actin stress fibers in normal human fibroblasts.
(a) Immunofluorescence and confocal microscopy performed with anti-Huntingtin (Htt) antibody Ab2527 (Green) and rhodamine-phalloidin (Red) to visualize F-actin in serum-starved Control1 cells. Co-localization (Yellow) is observed in merged images at right. Immunostaining for Ab2527 is coincident with F-actin stress fibers (arrows). Small vesicles and nuclei were also labeled. (b) In parallel cells were immune-stained with Ab2527 pre-incubated with ten-fold mass of specific blocking peptide. The presence of the blocking peptide eliminated filamentous, small vesicle and nuclear staining. Arrows show where phalloidin-positive actin stress fibers are present in the cell. (c) Cells were immune-stained with Ab2527 pre-incubated with ten-fold mas of an unrelated peptide. The normal staining for Ab2527 including filamentous (arrows), vesicular and nuclear staining are evident. (d) Immunostaining with Ab2527 performed in parallel in Control1 and HD1 cells. Both control and HD cells showed normal filamentous staining (arrows). Scale bar in a = 5 μm and applies to all images.
Fig 3
Fig 3. Huntingtin can co-localize to vinculin-positive adhesion structures.
Double-label immunofluorescence with anti-Huntingtin antibody Ab2527 (Green) and anti-Vinculin (Red). (a) In serum starved cells, Huntingtin immunoreactivity occurs along stress fibers leading into large Vinculin-positive adhesion plaques (top row, arrows), from which Huntingtin is excluded. In cells containing less prominent stress fibers (bottom row), small foci of staining for Huntingtin with Ab2527 was present in Vinculin-positive adhesion structures that appeared less well-organized than those depicted in a suggesting immature or developing adhesion plaques (inset). (b) In cells grown with serum with no stress fibers and with focal contacts, Huntingtin labeled with Ab2527 and Vinculin co-localize (arrows in merged). Scale bar in a = 5 μm and applies to all images.
Fig 4
Fig 4. Huntingtin detected with Ab1173 can localize to vinculin-positive adhesions. Immunofluorescence for Huntingtin with Ab1173 in Control 1 and HD1 human fibroblasts is similar, but Vinculin-positive adhesion plaques are increased in HD1 cells.
(a) Double label immunofluorescence with Huntingtin labeled with Ab1173 (Green) and Vinculin (Red) shows colocalization in focal adhesions in serum starved cells. Scale bar in a = 5μm. Shown are representative images. (b) Double-label immunofluorescence and confocal microscopy of cells grown in normal serum containing medium shows similar staining of anti-Huntingtin Ab1173 in Control 1 and HD1 human fibroblasts. Staining was diffuse through the cytoplasm with lower levels in the nucleus (red). Staining for Vinculin (green) was diffuse throughout the cell with accumulations in focal adhesions (arrows) at the periphery of the cell. Scale bar in b = 5μm. (c) In control plus serum conditions, HD1 47/44 fibroblasts had significantly increased numbers of vinculin-positive focal adhesions per cell compared to Control1 (17/19) cells (17.2 ± 9.1 per cell for HD (47/44) compared to 12.7 ± 7.3 for Control (17/19) cell; p = 0.037, unpaired t-test, n = 30 cells).
Fig 5
Fig 5. Exogenous α-actinin-2 and Huntingtin associate in lysates from human HeLa cells and deletion analysis maps the interaction region to aa 399–969 of Huntingtin.
(a) Deletion analysis was performed in HeLa cells using Huntingtin cDNA constructs as depicted co-expressed with a cDNA for GFP-α-actinin-2 (GFP-ACTN2). The CAG length in Huntingtin was 18 (wild-type). Ability to pull down GFP-α-actinin-2 indicated at right. (b) Western blots of FLAG immunoprecipitates and inputs. FLAG tagged full length Huntingtin (FLAG-HTT-1-3144) or aa 1–969 (FLAG-HTT-1-969) pulls down GFP-α-actinin-2. (c) FLAG tagged full length Huntingtin (FLAG-HTT-1-3144) or aa 399–1518 (FLAG-HTT-399-1518) pulls down GFP-α-actinin-2. The minimal shared region was aa 399–969 of Huntingtin. Full blots for b and c are shown in S5 Fig.
Fig 6
Fig 6. Huntingtin co-localizes with α-actinin-1 in primary human fibroblasts.
(a and b) Double-label immunofluorescence using two anti-Huntingtin antibodies (Ab2527 and Ab1173) and a monoclonal antibody against α-actinin-1 in human primary fibroblasts. (a) Huntingtin detected with Ab2527 (Red) co-localized with α-actinin (Green) at stress fibers in serum-starved cells (top, short arrows). In normal growth medium, rare cells displayed reactivity for Huntingtin detected with Ab2527 on stellate polygonal structures in the cytoplasm consistent with actin microfilament together with reactivity for α-actinin at the vertex (bottom, arrows) as previously described [45]. (b) Huntingtin detected with Ab1173 (Green) co-localized with α-actinin-1 (Red) in lamellipodia at ruffled membranes (top panel, arrows and inset) and in protrusions at the leading edge of lamellipodia (bottom panel, arrow). Arrowheads indicate Huntingtin detected with anti-actinin-1 in the cytoplasm at perinuclear sites. Yellow shows co-localization in Merged images. 60x oil objective. Images in a (top panel) and b are representative images. Scale bars = 10μm.
Fig 7
Fig 7. A proximity ligation assay (PLA) produced reaction product when an antibody for Huntingtin (Ab1173) and α-actinin-1 were used.
Fluorescence was visualized by confocal microscopy in human Control 1 fibroblasts (a) and human neurons (b). At top left in a, the fluorescence confocal image shows the reaction product with anti-Huntingtin polyclonal Ab1173 and monoclonal anti- α-actinin-1 in small foci in the cytoplasm. Arrows indicate the reaction product in small foci. Boxed region indicates inset showing dots at increased magnification. At top right in a, confocal image shows low levels of reaction product using polyclonal antibody targeting PSD95 and monoclonal α-actinin-1. At bottom left in a, reaction where primary antibodies were omitted shows no reaction product. At bottom right in a, graph shows mean ± standard deviations percentage of cells with ≥10 foci per cell. N = 10 confocal fields per condition, p<0.0001, unpaired t-test. Images taken with 60X oil objective. In b, the left image shows Merged images of traditional double-label immunofluorescence in a human neuron (left) and no primary antibodies (center). Co-localization in Yellow is observed in the cell body and in patches at the plasma membrane along the primary process in a polarized cell with a neuronal morphology. At right, PLA reaction product (Red, arrows) also shows co-localization in the cell body and along major process. 60x oil objective. Images are representative. Scale bars = 10 μm. Nuclei were stained using Hoechst.
Fig 8
Fig 8. Reduced Huntingtin levels alter localization of α-actinin at the plasma membrane.
(a) Confocal micrographs of human fibroblasts labeled for F-actin with Alexa-Phalloidin (Green) and α-actinin (Red). Cells were treated with siRNA targeting GFP as a control or E1-4 targeting Huntingtin (Htt). Shown are representative images of cells serum-starved or cells treated for 15 minutes with 100 ng/ml PDGF. Insets show higher magnification of the regions at double arrows. Scale bar = 50 μm. (b) Graph shows mean pixel intensity (bar) for α-actinin at membrane ruffles in well spread cells Types 1–3 (see Methods). Statistics were performed by one-way ANOVA and Tukey’s HSD posthoc test, n = 30 cells, 3 coverslips per condition; *p<0.05, **p<0.001.

References

    1. DeMali KA, Barlow CA, Burridge K. Recruitment of the Arp2/3 complex to vinculin: coupling membrane protrusion to matrix adhesion. J Cell Biol. 2002;159(5):881–91. 10.1083/jcb.200206043 - DOI - PMC - PubMed
    1. Galbraith CG, Yamada KM, Galbraith JA. Polymerizing actin fibers position integrins primed to probe for adhesion sites. Science. 2007;315(5814):992–5. 10.1126/science.1137904 - DOI - PubMed
    1. Greenwood JA, Theibert AB, Prestwich GD, Murphy-Ullrich JE. Restructuring of focal adhesion plaques by PI 3-kinase. Regulation by PtdIns (3,4,5)-p(3) binding to alpha-actinin. J Cell Biol. 2000;150(3):627–42. - PMC - PubMed
    1. Svitkina TM, Borisy GG. Arp2/3 complex and actin depolymerizing factor/cofilin in dendritic organization and treadmilling of actin filament array in lamellipodia. J Cell Biol. 1999;145(5):1009–26. - PMC - PubMed
    1. HDCRG. A novel gene containing a trinucleotide repeat that is expanded and unstable on Huntington’s disease chromosomes. The Huntington’s Disease Collaborative Research Group. Cell. 1993;72(6):971–83. - PubMed

Publication types

MeSH terms

LinkOut - more resources