. 2019 Feb 15;14(2):e0212320.
doi: 10.1371/journal.pone.0212320. eCollection 2019.

Forecasting stock prices with a feature fusion LSTM-CNN model using different representations of the same data

Affiliations

Forecasting stock prices with a feature fusion LSTM-CNN model using different representations of the same data

Taewook Kim et al. PLoS One. .

Abstract

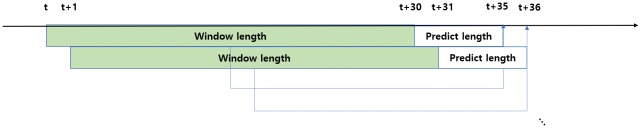
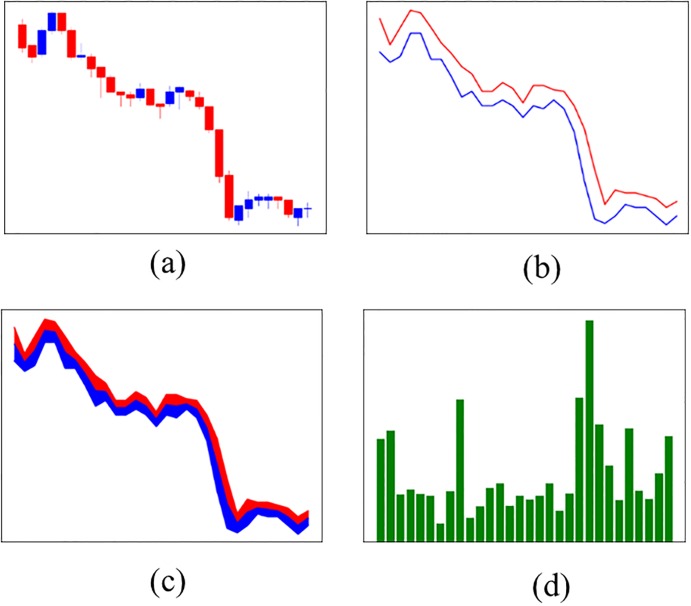
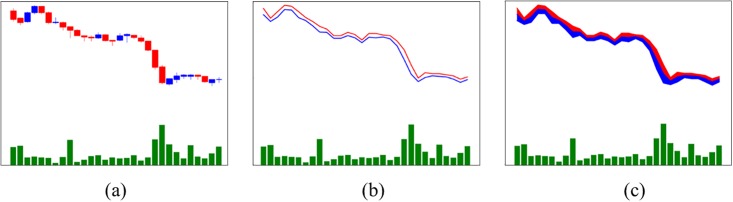
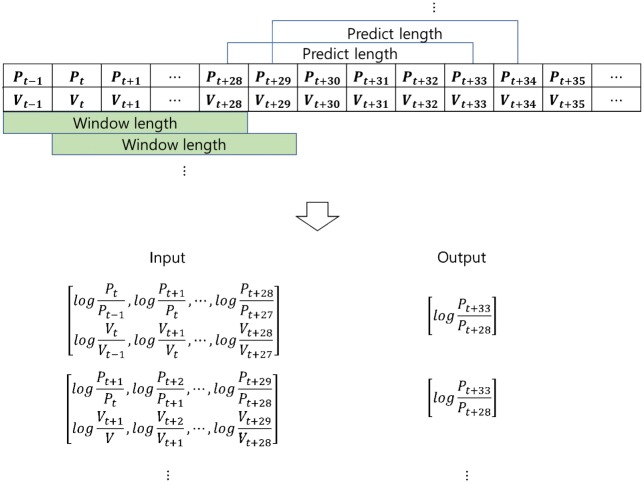
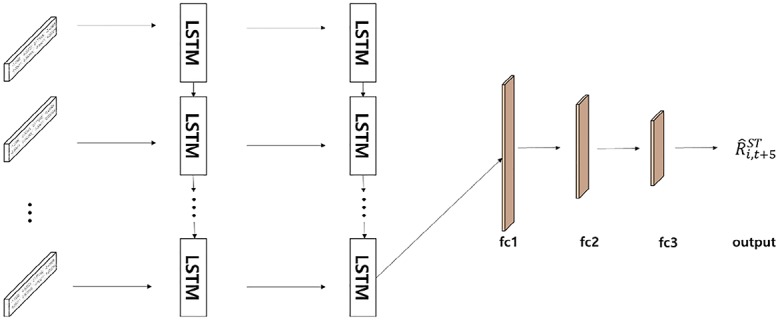
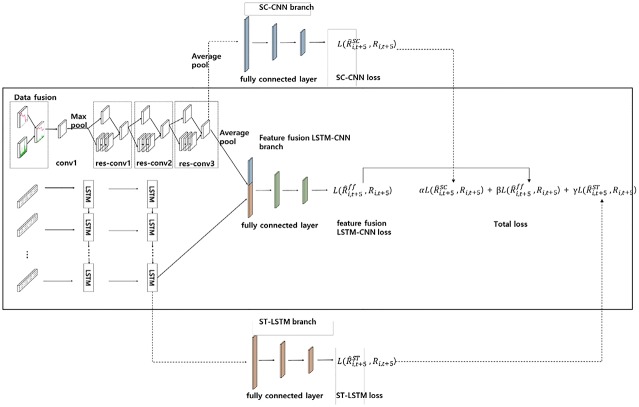
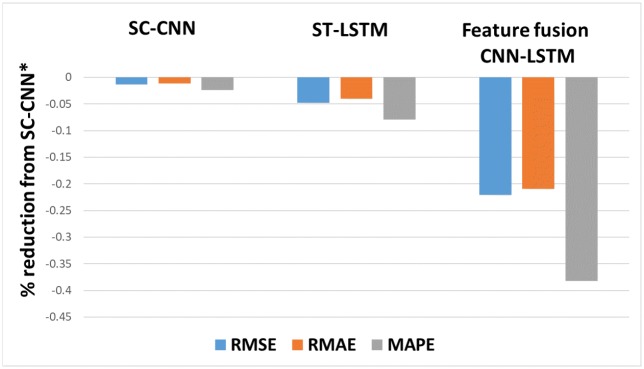
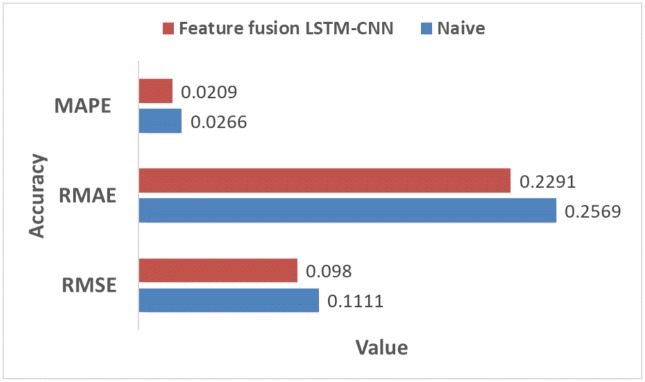
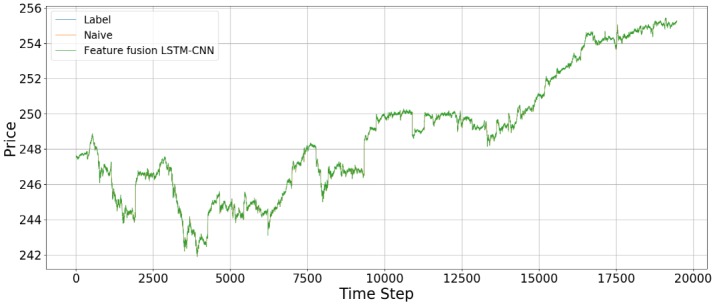
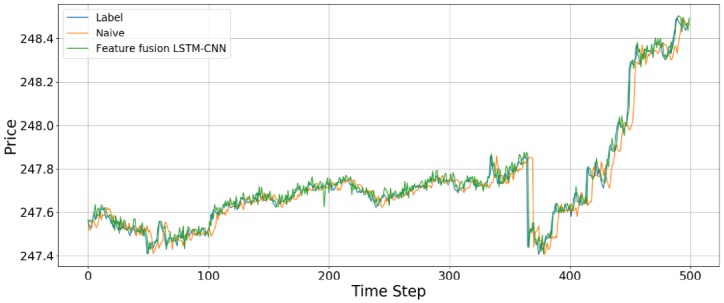
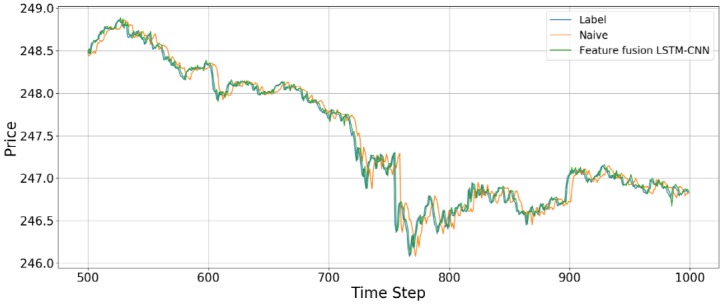
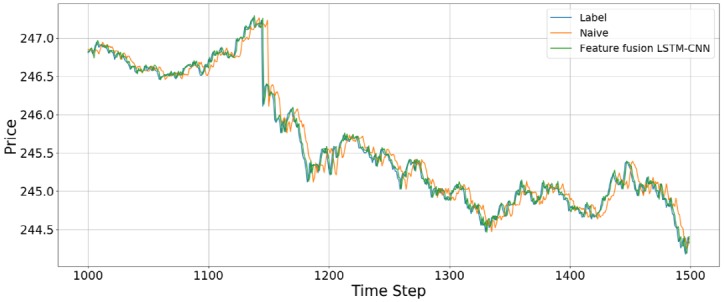
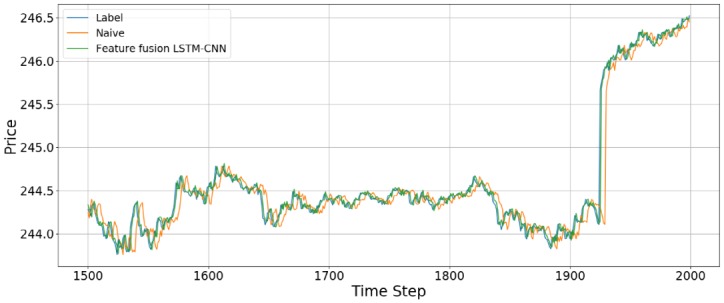
Forecasting stock prices plays an important role in setting a trading strategy or determining the appropriate timing for buying or selling a stock. We propose a model, called the feature fusion long short-term memory-convolutional neural network (LSTM-CNN) model, that combines features learned from different representations of the same data, namely, stock time series and stock chart images, to predict stock prices. The proposed model is composed of LSTM and a CNN, which are utilized for extracting temporal features and image features. We measure the performance of the proposed model relative to those of single models (CNN and LSTM) using SPDR S&P 500 ETF data. Our feature fusion LSTM-CNN model outperforms the single models in predicting stock prices. In addition, we discover that a candlestick chart is the most appropriate stock chart image to use to forecast stock prices. Thus, this study shows that prediction error can be efficiently reduced by using a combination of temporal and image features from the same data rather than using these features separately.


Conflict of interest statement

The authors have declared that no competing interests exist.

Figures

Fig 1
Fig 1. Setting training, validation and testing dataset during the whole sample period.
Fig 2
Fig 2. Setting window length, predict length and rolling window during the whole sample period.
Fig 3
Fig 3. Four stock chart images using SPY data. The time interval is between t − 30 and t.
(a) Candlestick chart, (b) Line chart, (c) F-line chart, and (d) Bar chart.
Fig 4
Fig 4. Three fusion chart images using early fusion. The time interval is between t − 30 and t.
(a) Candlebar chart, (b) Linebar chart, and (c) F-linebar chart.
Fig 5
Fig 5. Preprocessing stock time series data using logarithmic return based on the window length and predict length.
Fig 6
Fig 6. Residual learning.
(a) Stacked layers (b) Stacked layers using a shortcut connection.
Fig 7
Fig 7. Bottleneck architecture.
(a) A building block (b) A bottleneck building block.
Fig 8
Fig 8. Construction of the SC-CNN model using residual learning and the bottleneck method.
Fig 9
Fig 9. Memory block of LSTM.
Fig 10
Fig 10. The architecture of the ST-LSTM model.
Fig 11
Fig 11. The architecture of proposed feature fusion LSTM-CNN model comprised of SC-CNN and ST-LSTM models.
Fig 12
Fig 12. Comparison of prediction errors among three models based on SC-CNN*.
The input data are candlebar charts, which are the best performing fusion chart images, and stock time series data. Note: SC-CNN* uses a candlestick chart, which is a stock chart image only.
Fig 13
Fig 13. Comparison of accuracy between feature fusion LSTM-CNN and naive model.
Fig 14
Fig 14. An example of predicting stock prices using the feature fusion LSTM-CNN model and Naive model on the testing dataset.
The input data are candlebar chart and stock time series.
Fig 15
Fig 15. An example of predicting stock prices using the feature fusion LSTM-CNN model with a test dataset of between 0 and 500 data points.
The input data are candlebar chart and stock time series.
Fig 16
Fig 16. An example of predicting stock prices using the feature fusion LSTM-CNN model with a test dataset of between 500 and 1,000 data points.
The input data are candlebar chart and stock time series.
Fig 17
Fig 17. An example of predicting stock prices using the feature fusion LSTM-CNN model with a test dataset of between 1,000 and 1,500 data points.
The input data are candlebar chart and stock time series.
Fig 18
Fig 18. An example of predicting stock prices using the feature fusion LSTM-CNN model with a test dataset of between 1,500 and 2,000 data points.
The input data are candlebar chart and stock time series.

References

    1. Cowles A. Can Stock Market Forecasters Forecast? Econom. 1933;1:309.
    1. Fama EF. Efficient Capital Markets-A Review of Theory and Empirical Work. J Finance [Internet]. 1970;25(2):383–417. Available from: http://books.google.de/books?id=ox48PAAACAAJ&dq=intitle:Efficient+Capita...
    1. Bao W, Yue J, Rao Y. A deep learning framework for financial time series using stacked autoencoders and long-short term memory. PLoS One. 2017;12(7). - PMC - PubMed
    1. Tsang PM, Kwok P, Choy SO, Kwan R, Ng SC, Mak J, et al. Design and implementation of NN5 for Hong Kong stock price forecasting. Eng Appl Artif Intell [Internet]. 2007;20(4):453–61. Available from: http://linkinghub.elsevier.com/retrieve/pii/S095219760600162X
    1. Brooks C. Predicting stock index volatility: Can market volume help? J Forecast. 1998;17(1):59–80.

Publication types