. 2019 Apr 5;18(4):1787-1795.
doi: 10.1021/acs.jproteome.8b00981. Epub 2019 Feb 25.

Development of a Sensitive, Scalable Method for Spatial, Cell-Type-Resolved Proteomics of the Human Brain

Affiliations

Development of a Sensitive, Scalable Method for Spatial, Cell-Type-Resolved Proteomics of the Human Brain

Simon Davis et al. J Proteome Res. .

Abstract

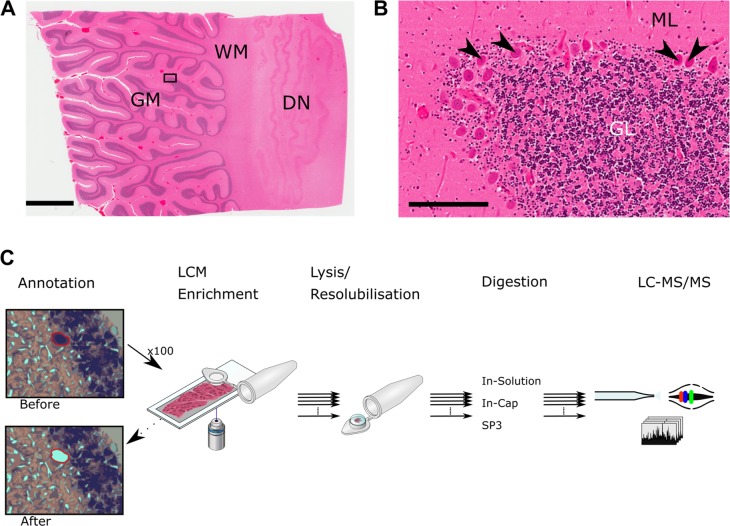
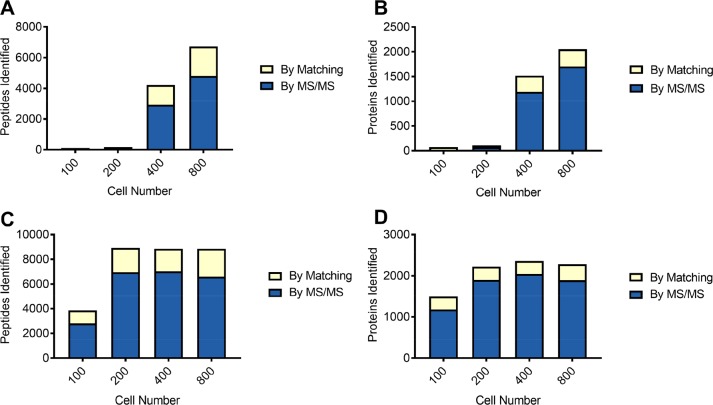
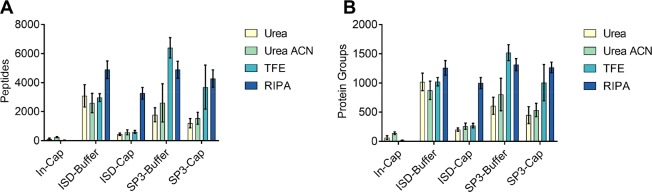
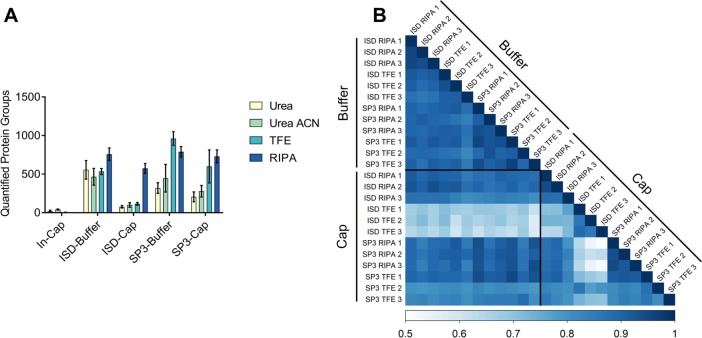
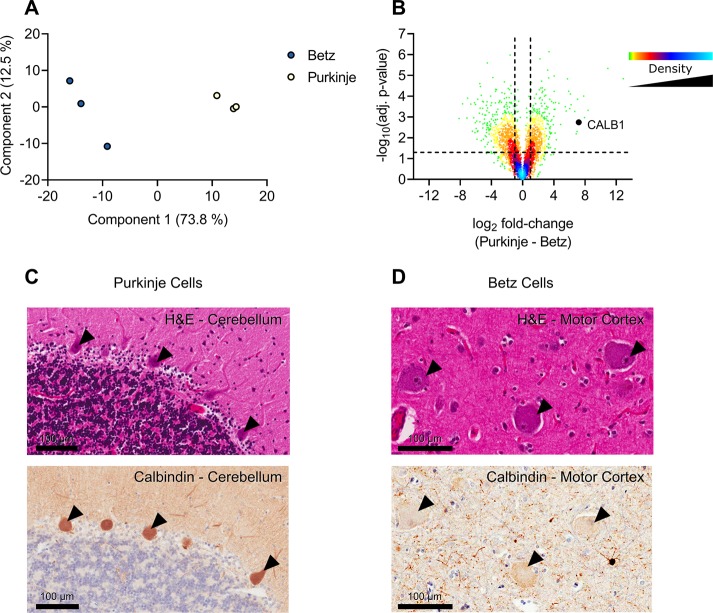
While nearly comprehensive proteome coverage can be achieved from bulk tissue or cultured cells, the data usually lacks spatial resolution. As a result, tissue based proteomics averages protein abundance across multiple cell types and/or localizations. With proteomics platforms lacking sensitivity and throughput to undertake deep single-cell proteome studies in order to resolve spatial or cell type dependent protein expression gradients within tissue, proteome analysis has been combined with sorting techniques to enrich for certain cell populations. However, the spatial resolution and context is lost after cell sorting. Here, we report an optimized method for the proteomic analysis of neurons isolated from post-mortem human brain by laser capture microdissection (LCM). We tested combinations of sample collection methods, lysis buffers and digestion methods to maximize the number of identifications and quantitative performance, identifying 1500 proteins from 60 000 μm2 of 10 μm thick cerebellar molecular layer with excellent reproducibility. To demonstrate the ability of our workflow to resolve cell type specific proteomes within human brain tissue, we isolated sets of individual Betz and Purkinje cells. Both neuronal cell types are involved in motor coordination and were found to express highly specific proteomes to a depth of 2800 to 3600 proteins.

Keywords: LC−MS/MS; brain; laser capture microdissection; spatially resolved proteomics; tissue proteomics.


Conflict of interest statement

The authors declare no competing financial interest.

Figures

Figure 1
Figure 1
Cerebellar cortex and overview of LCM-proteomics workflow. (A) Image of a cerebellar cortex tissue slice stained with H&E. Rectangle indicates area shown in (B). GM: gray matter. WM: white matter. DN: dentate nucleus. Scale bar represents 4 mm. (B) Higher magnification of area indicated in (A). Arrowheads indicate Purkinje cells. ML: molecular layer. GL: granular layer. Scale bar represents 200 μm. (C) Schematic overview of the LCM workflow. Different collection methods, lysis buffers, and digestion protocols were tested.
Figure 2
Figure 2
Comparison between retrieving cells from the LCM cap and digesting in situ in the LCM cap. As a pilot experiment, 100, 200, 400, and 800 Purkinje cells were collected using LCM and processed after centrifuging to collect the cells from the cap prior to digestion (A,B) or digested directly in the LCM cap (C,D). “By matching” refers to identifications matched from a sample of cerebellar cortex using MaxQuant’s “match between runs”. Digesting directly in the LCM cap results in an increase in peptide and protein identifications, especially at low cell numbers. (A) Number of peptides identified from Purkinje cells recovered from the LCM cap. (B) Number of proteins identified from Purkinje cells recovered from the LCM cap. (C) Number of peptides identified from Purkinje cells digested in the LCM cap. (D) Number of proteins identified from Purkinje cells digested in the LCM cap.
Figure 3
Figure 3
Comparison of protein identifications of methods used for protein retrieval and digestion. To determine an optimal method of material collection, lysis and digestion, 60 000 μm3 of the molecular layer (the area of approximately 100 Purkinje cells) was collected to test different combinations of collection methods, lysis buffers and digestion methods. (A) Mean number of peptides identified in each combination. (B) Mean number of proteins identified in each combination. All bars are mean values (n = 3) and error bars represent standard deviation. In-Cap refers to the in situ digestion method. Cap and Buffer refer to collecting material onto both a dry LCM cap and recovering in the indicated lysis buffer, or collecting directly into the indicated lysis buffer. ISD: in-solution digestion.
Figure 4
Figure 4
Quantitative performance of the tested methods. (A) The number of protein groups quantified using MaxQuant’s MaxLFQ algorithm (default settings). (B) Pearson correlation matrix of samples where Trifluoroethanol (TFE) or RIPA buffer, scale is truncated for clarity. Cap and Buffer refer to collecting material onto both a dry LCM cap and recovering in the indicated lysis buffer, or collecting directly into the indicated lysis buffer. ISD: in-solution digestion.
Figure 5
Figure 5
Analysis of Betz and Purkinje cells. Analysis of Betz and Purkinje cell proteomes. (A) Principal component analysis of Betz and Purkinje cells based on MaxQuant LFQ values. (B) Volcano plot of the Purkinje cell proteome against the Betz cell proteome. Positive log2 fold-changes indicate the mean LFQ value is higher in Purkinje cells. Y-axis values are permutation-corrected FDRs. Horizontal dashed line represents 5% FDR threshold. Vertical dashed lines represent ±2-fold-change. Color gradient represents density of data points. (C) Cerebellum stained with H&E (top) or for calbindin 1 (bottom); arrowheads indicate examples of positively stained Purkinje cells. Scale bar represents 100 μm. (D) Motor cortex stained with H&E (top) or for calbindin 1 (bottom); arrowheads indicate negatively stained Betz cells. Scale bar represents 100 μm.

References

    1. Davis S.; et al. Expanding Proteome Coverage with CHarge Ordered Parallel Ion aNalysis (CHOPIN) Combined with Broad Specificity Proteolysis. J. Proteome Res. 2017, 16, 1288–1299. 10.1021/acs.jproteome.6b00915. - DOI - PMC - PubMed
    1. Bekker-Jensen D. B.; et al. An Optimized Shotgun Strategy for the Rapid Generation of Comprehensive Human Proteomes. Cell Syst. 2017, 11, 214–221. 10.1016/j.cels.2017.05.009. - DOI - PMC - PubMed
    1. Specht H.; Slavov N. Transformative Opportunities for Single-Cell Proteomics. J. Proteome Res. 2018, 17, 2565–2571. 10.1021/acs.jproteome.8b00257. - DOI - PMC - PubMed
    1. Murgia M.; et al. Single muscle fiber proteomics reveals unexpected mitochondrial specialization. EMBO Rep. 2015, 16, 387–95. 10.15252/embr.201439757. - DOI - PMC - PubMed
    1. Virant-Klun I.; Leicht S.; Hughes C.; Krijgsveld J. Identification of Maturation-Specific Proteins by Single-Cell Proteomics of Human Oocytes. Mol. Cell. Proteomics 2016, 15, 2616–27. 10.1074/mcp.M115.056887. - DOI - PMC - PubMed

Publication types