. 2019 May;156(6):1761-1774.
doi: 10.1053/j.gastro.2019.01.263. Epub 2019 Feb 12.

Systems Biology Analyses Show Hyperactivation of Transforming Growth Factor-β and JNK Signaling Pathways in Esophageal Cancer

Affiliations

Systems Biology Analyses Show Hyperactivation of Transforming Growth Factor-β and JNK Signaling Pathways in Esophageal Cancer

Andrew E Blum et al. Gastroenterology. 2019 May.

Abstract

Background & aims: Esophageal adenocarcinoma (EAC) is resistant to standard chemoradiation treatments, and few targeted therapies are available. We used large-scale tissue profiling and pharmacogenetic analyses to identify deregulated signaling pathways in EAC tissues that might be targeted to slow tumor growth or progression.

Methods: We collected 397 biopsy specimens from patients with EAC and nonmalignant Barrett's esophagus (BE), with or without dysplasia. We performed RNA-sequencing analyses and used systems biology approaches to identify pathways that are differentially activated in EAC vs nonmalignant dysplastic tissues; pathway activities were confirmed with immunohistochemistry and quantitative real-time polymerase chain reaction analyses of signaling components in patient tissue samples. Human EAC (FLO-1 and EsoAd1), dysplastic BE (CP-B, CP-C, CP-D), and nondysplastic BE (CP-A) cells were incubated with pharmacologic inhibitors or transfected with small interfering RNAs. We measured effects on proliferation, colony formation, migration, and/or growth of xenograft tumors in nude mice.

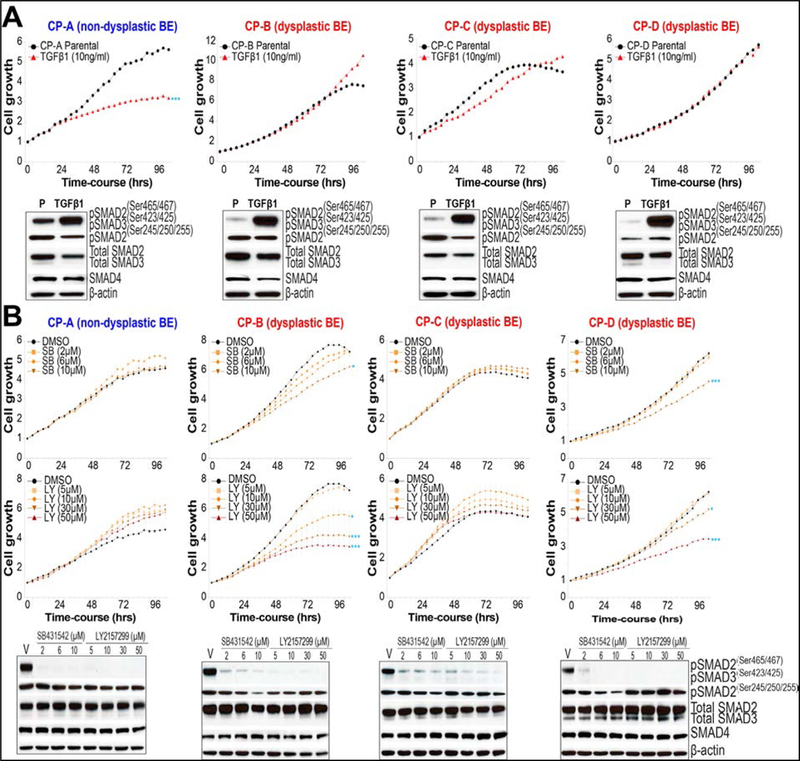
Results: Comparisons of EAC vs nondysplastic BE tissues showed hyperactivation of transforming growth factor-β (TGFB) and/or Jun N-terminal kinase (JNK) signaling pathways in more than 80% of EAC samples. Immunohistochemical analyses showed increased nuclear localization of phosphorylated JUN and SMAD proteins in EAC tumor tissues compared with nonmalignant tissues. Genes regulated by the TGFB and JNK pathway were overexpressed specifically in EAC and dysplastic BE. Pharmacologic inhibition or knockdown of TGFB or JNK signaling components in EAC cells (FLO-1 or EsoAd1) significantly reduced cell proliferation, colony formation, cell migration, and/or growth of xenograft tumors in mice in a SMAD4-independent manner. Inhibition of the TGFB pathway in BE cell lines reduced the proliferation of dysplastic, but not nondysplastic, cells.

Conclusions: In a transcriptome analysis of EAC and nondysplastic BE tissues, we found the TGFB and JNK signaling pathways to be hyperactivated in EACs and the genes regulated by these pathways to be overexpressed in EAC and dysplastic BE. Inhibiting these pathways in EAC cells reduces their proliferation, migration, and formation of xenograft tumors. Strategies to block the TGFB and JNK signaling pathways might be developed for treatment of EAC.

Keywords: InFlo; LY2157299; PARADIGM; SP600125.


Conflict of interest statement

The other authors have no potential conflicts of interest to disclose.

Figures

Figure 1.
Figure 1.. Majority of EACs exhibit hyperactivation of JNK–JUN and TGFβ–SMAD signaling sub-networks.
(A) PARADIGM SuperPathway sub-networks exhibiting differential activity in EAC versus NDSBEs. Pathway components showing significant activity differences between EAC (N=56) and NDSBE (N=18) (Wilcoxon P-Value ≤ 0.05) tissue samples are plotted along with their regulatory relationships in shades of red (up-regulated in EACs) and green (down-regulated in EACs), with darker colors corresponding to lower Wilcoxon P-values (see Data Legend). The size of the node corresponds to the percentage of EACs showing deregulation compared to all NDSBEs (see Data Legend). The three dashed boxes indicate major pathway sub-networks showing selective hyperactivation in EACs. (B) Distribution of JNK–JUN and TGFβ–SMAD signaling sub-network activities across EACs and NDSBEs. The distribution of activity levels for EAC (N=56) and NDSBE (N=18) tissue samples are plotted for the JNK–JUN and TGFβ–SMAD signaling networks respectively. For each sample, the median activity level of all of the components within the respective sub-networks (A) was calculated and plotted along the X-axis. Activity levels > 0 denote hyperactivity, 0 being neutral and < 0 indicating low activity (X-axis) as estimated by PARADIGM. Significant differences in the proportion of samples showing hyperactivity (>0) of a given sub-network between EAC versus NDSBE groups was evaluated using a Fisher’s Exact test. Overall, 79% and 73% of EACs exhibit higher JNK–JUN and TGFβ–SMAD sub-network activity, respectively, compared to any NDSBE cases in the discovery cohort (Fisher’s exact P << 0.001).
Figure 2.
Figure 2.. Orthogonal validation of JNK–JUN and TGFβ–SMAD signaling activities in primary tissue cohorts.
(A,B) Representative Immunohistochemistry images demonstrating marked nuclear localization and expression of phospho-c-JUN (A) and phospho-SMAD (B) proteins in EAC tumor epithelia, as compared to NDSBE (Scale bar, 100μm). The bar graphs below respective images indicate the IHC-based semi-quantitative index of staining (H-score) in NDSBE (N=5) versus EAC (N=5) primary tissue samples. * (P < 0.05) indicates significant differences in H-score index between EAC versus NDSBE, estimated using a non-parametric Mann-Whitney test. (C,D) Heatmaps showing hierarchical clustering of the 105 RNAseq discovery tissue samples using RNAseq expression profiles of JUN (C) and SMAD (D) target-genes. The heatmap represents the median-subtracted log2 FPKM expression level of individual genes across samples. (E,F) qPCR analyses showing significantly increased expression of representative JUN (E) and SMAD (F) target-genes in the EACs. SQ and GAST samples were included as additional comparators in these qPCR analyses. (G,H) qPCR analyses of representative JUN (G) and SMAD (H) target-gene expression in a validation cohort consisting of 48 EAC, 21 HGD, 64 Barrett’s metaplasia (BM) with no longitudinal follow-up, and 159 normal esophageal SQ tissue samples. Y-axis shows the fold-changes in the expression of respective target-genes across samples, relative to NDSBE (E,F) or BM (G,H) cases. Bold horizontal lines within each tissue-type indicate the median fold-change in expression. ** (P << 0.01) and *** (P << 10−5) indicate significant differences in gene expression between EAC versus NDSBE/BM, or HGD versus BM, estimated using a Student’s t-test assuming unequal variances.
Figure 3.
Figure 3.. Effects of TGFβ–SMAD and JNK–JUN signaling on the growth of FLO-1 EAC cells.
(A) Assessment of FLO-1 colony growth in soft agar. Y-axis in the bar graph shows FLO-1 colony numbers following TGFβ1 (10ng/ml) treatment, expressed as a fraction of colony counts observed in the untreated Parental (P) cells. All data are plotted as mean ± SEM, obtained from atleast three independent experiments, each performed in triplicates. Significant differences in colony growth were estimated using a Student’s t-test assuming unequal variances. Shown below the bar graph are representative images of colony growth in Parental and TGFβ1 treated FLO-1 cells. Also shown below are Western blot images depicting phospho-SMAD induction at 48hrs following TGFβ1 treatment in FLO-1 cells. (B–D) IncuCyte-based growth assessments of FLO-1 cells treated with varying concentrations of TGFβRI inhibitors, SB431542 or LY2157299 (B,C), or with a JNK inhibitor, SP600125 (D). Y-axes represent the average fold-change in cell confluence values normalized to time zero (X-axes) in respective treatment versus DMSO vehicle controls. Also shown are representative Western blot images depicting the protein levels of total and phospho-SMAD/c-JUN, with β-actin as a loading control, at 48hrs following treatment. (E) IncuCyte-based cell (line graphs, Top Left) and colony growth (bar graphs, Bottom Left) assessments of FLO-1 cells treated with siRNAs targeting TGFβ1, TGFβ2, TGFβ3, TGFβRI, TGFβR2, SMAD2, SMAD3, or SMAD4. Y-axes in line graphs represent the average fold-change in cell confluence values normalized to time zero (X-axes) in respective treatment versus non-targeting control siRNA groups. Y-axes in bar graphs represent the colony numbers for each treatment siRNA groups, expressed as a fraction of colony counts observed in the non-targeting control siRNA. Protein levels of ligands (bar graph) were quantified by ELISA and receptor/SMAD components by Western Blots, at 48hrs following siRNA treatments. (F) IncuCyte-based cell (line graphs, Top) and colony growth (bar graphs, Bottom) assessments of FLO-1 cells treated with siRNAs targeting c-JUN, along with representative Western blot images depicting the protein levels of total and phospho-c-JUN at 48hrs post-treatment. For growth assays, cells were plated in individual wells in replicates and inhibitor/siRNA treatments were performed in each of these wells independently for subsequent analyses. All data are plotted as mean ± SEM, obtained from atleast six biologic replicate measurements. * (P < 0.05), ** (P<0.005), and *** (P < 0.0005) indicate significant differences between the respective test versus control groups, estimated using a Student’s t-test assuming unequal variances.
Figure 4.
Figure 4.. Small molecule inhibitors of TGFβ–SMAD signaling blocks the growth of SMAD4-deficient EAC cells.
(A–B) IncuCyte-based growth assessments of SMAD4-null EsoAd1 cells treated with varying concentrations of TGFβRI inhibitors, SB431542 or LY2157299. Y-axes represent the average fold-change in cell confluence values normalized to time zero (X-axes) in respective treatment versus DMSO vehicle control groups. (C) IncuCyte-based cell (line graphs, Top Left) and colony growth (bar graphs, Bottom Left) assessments of EsoAd1 cells treated with siRNAs targeting TGFβ1, TGFβ2, TGFβ3, TGFβR1, TGFβR2, SMAD2, SMAD3, or SMAD4. Y-axes in line graphs represent the average fold-change in cell confluence values normalized to time zero (X-axes) in respective treatment versus non-targeting control siRNA groups. Y-axes in bar graphs represent the colony numbers for each treatment siRNA groups, expressed as a fraction of colony counts observed in the non-targeting control siRNA. Protein levels of ligands (bar graph) were quantified by ELISA and receptor/SMAD components by Western Blots, at 48hrs following siRNA treatments. For growth assays, cells were plated in individual wells in replicates and inhibitor/siRNA treatments were performed in each of these wells independently for subsequent analyses. All data are plotted as mean ± SEM, obtained from atleast six biologic replicate measurements. * (P < 0.05) and *** (P < 0.0005) indicate significant differences between the respective test versus control groups, estimated using a Student’s t-test assuming unequal variances.
Figure 5.
Figure 5.. Inhibition of TGFβ–SMAD or JNK–JUN signaling blocks the growth of EAC cells in vivo.
(A–D) Top row, Immunohistochemistry analyses of phosphorylated SMAD and c-JUN proteins in representative EsoAd1 and FLO-1 xenograft tumors (Scale bars, 100μm). (A–D) Middle row, assessment of EsoAd1 and FLO-1 tumor xenograft growth in immune-deficient mice treated with (A,B) TGFβRI inhibitors (SB431542, LY2157299), or with (C,D) JNK inhibitor (SP600125), as compared to respective vehicle control treatments (see Methods). Y-axis depicts average fold-change in tumor volume over time (X-axis) in respective treatment groups, normalized to the first day of treatment (time-point zero on X-axis). Data are plotted as mean ± SEM. ** (P < 0.005) and *** (P < 0.0005) indicate significant differences in tumor volume at the final time-point between respective treatment versus vehicle-control groups, estimated using a Student’s t-test. The number of established EsoAd1 xenograft tumors available for analysis from respective experimental arms at the beginning of the study were 46 (vehicle; i.p), 45 (vehicle; oral gavage), 26 (SB431542), 26 (LY2157299), and 26 (SP600125). The number of established FLO-1 xenograft tumors available for analysis from respective experimental arms at the beginning of the study were 34 (vehicle; i.p), 32 (vehicle; oral gavage), 29 (SB431542), 24 (LY2157299), and 25 (SP600125). (A–D) Bottom row, representative photographic images of mice with in situ xenograft tumors at the final time-point across the treatment arms.
Figure 6.
Figure 6.. Contrasting effects of TGFβ signaling in non-dysplastic versus dysplastic Barrett’s esophagus cells.
(A,B) IncuCyte-based cell growth assessments in non-dysplastic (CP-A) and dysplastic (CP-B, CP-C, CP-D) Barrett’s esophagus cells treated with (A) TGFβ1 ligand or untreated (Parental/P), or (B) with varying concentrations of TGFβRI kinase inhibitors, SB431542 (SB) and LY2157299 (LY), or with DMSO vehicle (V). Y-axes in line graphs represent the average fold-change in cell confluence values normalized to time zero (X-axes) in respective treatment versus control groups. Also shown are protein levels of SMAD components quantified by Western Blots at 48hrs post-treatment. For growth assays, cells were plated in individual wells in replicates and inhibitors treatments were performed in each of these wells independently for subsequent analyses. All data are plotted as mean ± SEM, obtained from atleast six biologic replicate measurements. * (P < 0.05) and *** (P < 0.0005) indicate significant differences in cell growth at the final time-point between the respective treatment versus control groups, estimated using a Student’s t-test assuming unequal variances.

References

    1. Brown LM, Devesa SS, Chow WH. Incidence of adenocarcinoma of the esophagus among white Americans by sex, stage, and age. J Natl Cancer Inst 2008;100:1184–7. - PMC - PubMed
    1. Hur C, Miller M, Kong CY, et al. Trends in esophageal adenocarcinoma incidence and mortality. Cancer 2013;119:1149–58. - PMC - PubMed
    1. Spechler SJ, Souza RF. Barrett’s esophagus. N Engl J Med 2014;371:836–45. - PubMed
    1. Rice TW, Blackstone EH, Rusch VW. 7th edition of the AJCC Cancer Staging Manual: esophagus and esophagogastric junction. Ann Surg Oncol 2010;17:1721–4. - PubMed
    1. Blum AE, Venkitachalam S, Guo Y, et al. RNA Sequencing Identifies Transcriptionally Viable Gene Fusions in Esophageal Adenocarcinomas. Cancer Res 2016;76:5628–5633. - PMC - PubMed

Publication types

MeSH terms