Review
. 2019 Aug:148:344-359.
doi: 10.1016/j.addr.2019.01.011. Epub 2019 Feb 12.

Let's get small (and smaller): Combining zebrafish and nanomedicine to advance neuroregenerative therapeutics

Affiliations
Review

Let's get small (and smaller): Combining zebrafish and nanomedicine to advance neuroregenerative therapeutics

David T White et al. Adv Drug Deliv Rev. 2019 Aug.

Abstract

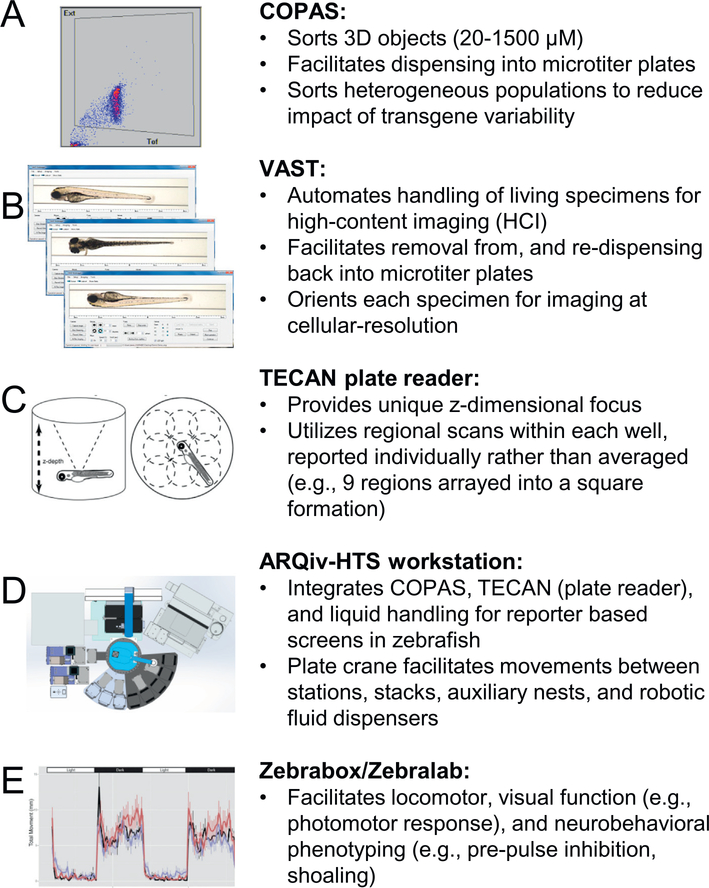
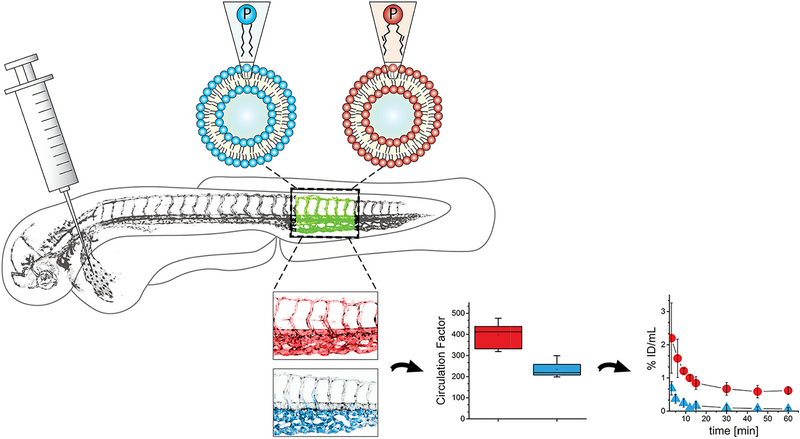
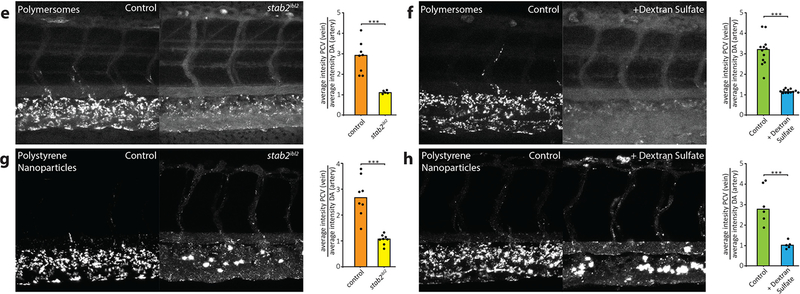
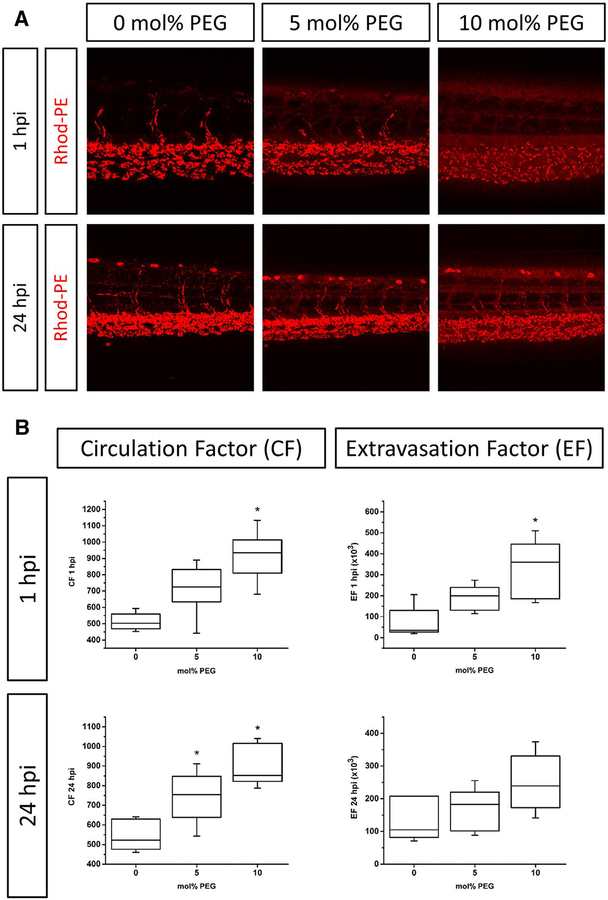
Several key attributes of zebrafish make them an ideal model system for the discovery and development of regeneration promoting therapeutics; most notably their robust capacity for self-repair which extends to the central nervous system. Further, by enabling large-scale drug discovery directly in living vertebrate disease models, zebrafish circumvent critical bottlenecks which have driven drug development costs up. This review summarizes currently available zebrafish phenotypic screening platforms, HTS-ready neurodegenerative disease modeling strategies, zebrafish small molecule screens which have succeeded in identifying regeneration promoting compounds and explores how intravital imaging in zebrafish can facilitate comprehensive analysis of nanocarrier biodistribution and pharmacokinetics. Finally, we discuss the benefits and challenges attending the combination of zebrafish and nanoparticle-based drug optimization, highlighting inspiring proof-of-concept studies and looking toward implementation across the drug development community.

Keywords: Drug optimization; Nanocarrier; Neurodegeneration; Neuroregeneration.


Figures

Fig. 1.
Fig. 1.
Key technologies available for evaluation of nanocarrier based enhancement of drug efficacy in vivo. Representative data format and a brief description are provided for each platform. (A) COPAS: sorts small objects based on optical density and fluorescent intensity. (B) VAST: handles and orients small objects for high-content imaging. (C) TECAN plate reader: measures fluorescence intensity in multi-well plates. (D) ARQiv-HTS workstation: integrates COPAS, TECAN, and additional automation for HTS-scale assays utilizing whole organisms. (E) Zebrabox/Zebralab: measures numerous behavioral metrics for larval zebrafish. Portions of figure (C [51], E [52]) reproduced by permission of PLOS One and Elsevier.
Fig. 2.
Fig. 2.
Zebrafish as a pre-clinical model to study the systemic circulation of nanocarrier drug delivery systems in vivo. Notably, changes in circulation patterns observed in zebrafish with various nanocarrier modifications paralleled pharmacokinetic distribution data collected from mammalian systems. Reproduced with permission of Journal of Controlled Release [60].
Fig. 3.
Fig. 3.
stab2-mediated scavenging of anionic nanoparticles in vivo. E,F) Carboxylated polystyrene nanoparticle. G,H) CCMV virus-like particle. Quantification of nanoparticle levels associated with venous versus arterial endothelial cells based on rhodamine fluorescence intensity associated with caudal vein vs dorsal aorta. Bar height represents median values, dots represent individual data points, and brackets indicate significantly different values (***p < 0.001) based on Mann–Whitney test. n = 5–12 samples per group (over two experiments). Partial figure reproduced by permission of ACS Nano [43].
Fig. 4.
Fig. 4.
Influence of PEGylation on liposome circulation in vivo in zebrafish. A) Liposome formulations (DSPC/cholesterol with increasing amounts of DSPE-PEG2000) were injected into transgenic zebrafish embryos and images were taken at 1 and 24 h post-injection. B) The circulation factor (CF) and extravasation factor (EF) of each lipid composition were calculated. n ≥ 5 experiments. Box plots represent median, third and first quantiles, minima and maxima. *p > 0.05 as compared to control (0 mol% PEG). Reproduced by permission of Journal of Controlled Release [60].
Fig. 5.
Fig. 5.
Graphical representation of nanocarrier-based drug optimization assay process in zebrafish. Five phases: 1) Nanocarrier-compound formulation 2) Assay development, 3) Assay optimization, 4) Nanocarrier-enabled enhancer screen, 5) Validation.

References

    1. Mullins MC, Hammerschmidt M, Haffter P, Nüsslein-Volhard C, Large-scale mutagenesis in the zebrafish: in search of genes controlling development in a vertebrate, Curr. Biol 4 (1994) 189–202. - PubMed
    1. Wang G, Rajpurohit SK, Delaspre F, Walker SL, White DT, Ceasrine A, Kuruvilla R, Li RJ, Shim JS, Liu JO, Parsons MJ, Mumm JS, First quantitative high-throughput screen in zebrafish identifies novel pathways for increasing pancreatic β-cell mass, Elife 4 (2015)10.7554/eLife.08261.001. - DOI - PMC - PubMed
    1. Zon LI, Peterson RT, In vivo drug discovery in the zebrafish, Nat. Rev. Drug Discov 4 (2005) 35–44, 10.1038/nrd1606. - DOI - PubMed
    1. Langheinrich U, Zebrafish: a new model on the pharmaceutical catwalk, BioEssays 25 (2003) 904–912, 10.1002/bies.10326. - DOI - PubMed
    1. Milan DJ, Peterson TA, Ruskin JN, Peterson RT, MacRae CA, Drugs that induce repolarization abnormalities cause bradycardia in zebrafish, Circulation 107 (2003) 1355–1358, 10.1161/01.CIR.0000061912.88753.87. - DOI - PubMed

Publication types

Substances