. 2019 Feb 14;11(2):221.
doi: 10.3390/cancers11020221.

A H2AX⁻CARP-1 Interaction Regulates Apoptosis Signaling Following DNA Damage

Affiliations

A H2AX⁻CARP-1 Interaction Regulates Apoptosis Signaling Following DNA Damage

Sreeja C Sekhar et al. Cancers (Basel). .

Abstract

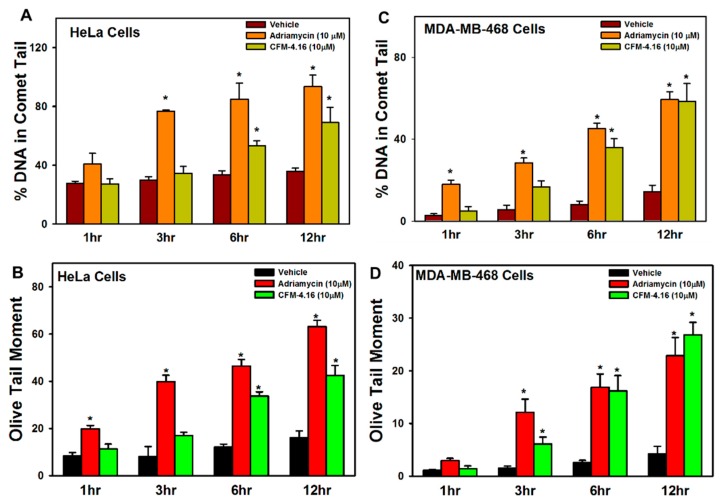
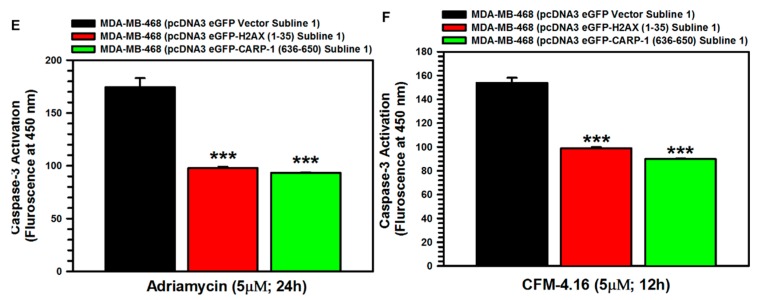
Cell Cycle and Apoptosis Regulatory Protein (CARP-1/CCAR1) is a peri-nuclear phosphoprotein that regulates apoptosis via chemotherapeutic Adriamycin (doxorubicin) and a novel class of CARP-1 functional mimetic (CFM) compounds. Although Adriamycin causes DNA damage, data from Comet assays revealed that CFM-4.16 also induced DNA damage. Phosphorylation of histone 2AX (γH2AX) protein is involved in regulating DNA damage repair and apoptosis signaling. Adriamycin or CFM-4.16 treatments inhibited cell growth and caused elevated CARP-1 and γH2AX in human breast (HBC) and cervical cancer (HeLa) cells. In fact, a robust nuclear or peri-nuclear co-localization of CARP-1 and γH2AX occurred in cells undergoing apoptosis. Knock-down of CARP-1 diminished γH2AX, their co-localization, and apoptosis in CFM-4.16- or Adriamycin-treated cells. We found that CARP-1 directly binds with H2AX, and H2AX interacted with CARP-1, but not CARP-1 (Δ600⁻652) mutant. Moreover, cells expressing CARP-1 (Δ600⁻652) mutant were resistant to apoptosis, and had diminished levels of γH2AX, when compared with cells expressing wild-type CARP-1. Mutagenesis studies revealed that H2AX residues 1⁻35 harbored a CARP-1-binding epitope, while CARP-1 amino acids 636⁻650 contained an H2AX-interacting epitope. Surface plasmon resonance studies revealed that CARP-1 (636⁻650) peptide bound with H2AX (1⁻35) peptide with a dissociation constant (Kd) of 127 nM. Cells expressing enhanced GFP (EGFP)-tagged H2AX (1⁻35) peptide or EGFP-tagged CARP-1 (636⁻650) peptide were resistant to inhibition by Adriamycin or CFM-4.16. Treatment of cells with transactivator of transcription (TAT)-tagged CARP-1 (636⁻650) peptide resulted in a moderate, statistically significant abrogation of Adriamycin-induced growth inhibition of cancer cells. Our studies provide evidence for requirement of CARP-1 interaction with H2AX in apoptosis signaling by Adriamycin and CFM compounds.

Keywords: CCAR1/CARP-1; apoptosis; cancer cells; chemotherapeutics; γH2AX.


Conflict of interest statement

The authors declare no conflict of interest.

Figures

Figure 1
Figure 1
Adriamycin and CFM-4.16 inhibit cell growth, elevate CARP-1 expression, and induce activation of JNKs and H2AX, and apoptosis. Noted cell lines were either treated with DMSO (Control), Adriamycin (A), or CFM-4.16 (B) for indicated dose and time. Cell viability was determined by MTT assay. The columns in the bar charts represent means of three independent experiments; bars, SE. (C) MDA-MB-468 cells were either untreated (noted as 0), or treated with Adriamycin or CFM-4.16 for noted dose and time. Cell lysates were analyzed with WB as described in Section 2 for levels of CARP-1, phospho- and total JNK1/2, γH2AX, and cleaved PARP. The WB membranes were subsequently probed with anti-actin antibodies to assess equal loading. In panel C, representative autorads out of two independent experiments is presented. The presence of respective protein is indicated by an arrowhead on the left side of each blot. The approximate location of various molecular-weight markers is indicated on the right side of each blot; kDa, kilodalton.
Figure 2
Figure 2
Adriamycin and CFM-4.16 induce DNA damage. Cells were treated with the noted dose of respective compound for indicated time periods. Mean values for percentage tail DNA content (A,C) and Olive tail moment (B,D) for respective cells from control and treatment periods for each compound were measured using software recommended by the manufacturer of the kit for measurement of DNA damage (Cell Bio Labs, CA, USA). The columns in each chart indicate average values for respective treatment condition; bars, SE; * p ≤ 0.05.
Figure 3
Figure 3
CARP-1 interacts with H2AX, and knock-down of CARP-1 abrogates γH2AX following treatments with Adriamycin or CFM-4.16. (A) Approximately 1 mg of cell lysate from each of the indicated cells was subjected to immunoprecipitation using anti-H2AX antibodies. The immunoprecipitates were then analyzed with WB by probing the membrane with anti-CARP-1 (α2) antibodies (top autoradiograph). The membrane was subsequently re-probed with anti-H2AX antibodies to ascertain presence of H2AX (middle autoradiograph). The whole-cell lysates were separately analyzed with WB to determine endogenous CARP-1 in the respective cell line (Lower autoradiograph). (B) Cells were either untreated (Control), or treated with Adriamycin or CFM-4.16 for noted dose and time. Cell lysates were analyzed with WB as described in Section 2 for levels of CARP-1 and γH2AX. The WB membrane was subsequently probed with anti-actin antibodies to assess equal loading. The presence of respective proteins is indicated by an arrowhead on the left side of each blot. The approximate location of various molecular-weight markers is indicated on the right side of each blot; kDa, kilodalton.
Figure 4
Figure 4
Deletion of CARP-1 amino acids 600–650 abrogates H2AX–CARP-1 interaction, and activation of H2AX and JNKs by Adriamycin or CFM-4.16. (A) Approximately 1 mg of cell lysate from each of the indicated cells was subjected to immunoprecipitation using anti-myc tag antibodies. The immunoprecipitates were then analyzed with WB by probing the membrane with anti-myc tag (for CARP-1) (top autoradiograph). The membrane was subsequently re-probed with anti-H2AX antibodies to ascertain presence of H2AX (middle autoradiograph). The whole-cell lysates were separately analyzed with WB to determine endogenous H2AX in the respective cell line (Lower autoradiograph). (B) Cells stably expressing myc-His-tagged CARP-1 or its Δ600–650 mutant were either untreated (Control), or treated with Adriamycin or CFM-4.16 for noted dose and time. Cell lysates were analyzed by immunoprecipitation using anti-myc tag or immunoglobulin G (IgG), followed by WB analysis using anti-myc tag (for CARP-1), γH2AX, or H2AX antibodies. (C) Cells were treated as in (B), and lysates were analyzed with WB using γH2AX and H2AX antibodies. (D,E) Cells stably expressing myc-His-tagged CARP-1 or its Δ600–650 mutant were either untreated (0), or treated with Adriamycin or CFM-4.16 for noted dose and time. Cell lysates were analyzed with WB using anti-γH2AX or phospho-JNK1/2 antibodies followed by probing of the respective membranes with antibodies for total H2AX and JNK1/2. myc tag (for CARP-1), or γH2AX antibodies. (F) MDA-MB-468 cells were either untreated (Control), or treated with noted agents. Cell lysates were analyzed with WB as described in Section 2 for levels of CARP-1, phospho- and total JNK1/2, γH2AX, and H2AX. The WB membranes were subsequently probed with anti-actin antibodies to assess equal loading. The presence of respective proteins in (AF) is indicated by an arrowhead on the left side of each blot. The approximate location of various molecular-weight markers is indicated on the right side of each blot; kDa, kilodalton.
Figure 5
Figure 5
Fine Mapping of H2AX/CARP-1 interacting epitopes. The Gst-tagged H2AX protein, and various Gst-tagged H2AX peptides and His-TAT-HA-tagged CARP-1 peptides were purified following expression in E. coli BL-21 cells essentially as described in Section 2. (A) Gst-H2AX protein was immobilized on glutathione sepharose followed by incubation indicated CARP-1 peptides. Following stringent washing, the bound proteins were analyzed with WB using anti-HA (upper) or anti-Gst (middle) antibodies. The lower blot shows respective HA-tagged CARP-1 peptides used as input. (B) Indicated Gst-tagged H2AX peptides were firstly immobilized on glutathione sepharose followed by incubation with His-TAT-HA-CARP-1 (631–660) peptide. Stringent washing and WB analyses were performed as in panel A. (C,D) Approximately 1 mg of cell lysate from each of the indicated cells stably expressing EGFP, EGFP-CARP-1 (636–650), or EGFP-H2AX (1–35) was subjected to immunoprecipitation using anti-EGFP antibodies. The immunoprecipitates were then analyzed with WB by probing the membrane with anti-EGFP, anti-H2AX, or anti-CARP-1 (α2) antibodies as noted in the upper boxes in (C,D). The whole-cell lysates were separately analyzed with WB to determine endogenous H2AX and CARP-1 levels in the respective cell line (lower boxes in (C,D)). The presence of respective proteins is indicated by an arrowhead on the left side of each blot. The approximate location of various molecular-weight markers is indicated on the right side of each blot; kDa, kilodalton.
Figure 6
Figure 6
Computational analyses of H2AX (1–35) binding with CARP-1 (631–650). Backbone RMSD calculations and conformation frequency analysis for the three poses (top, middle, and lower boxes) of the docked CARP-1 (model A)/H2AX complex (A), and CARP-1 (model B)/H2AX complex (B). Each analysis was completed over 24 ns of simulation for each complex. (C) Surface plasmon resonance sensogram showing binding of noted CARP-1 and H2AX peptides (inset) as detailed in Section 2.
Figure 6
Figure 6
Computational analyses of H2AX (1–35) binding with CARP-1 (631–650). Backbone RMSD calculations and conformation frequency analysis for the three poses (top, middle, and lower boxes) of the docked CARP-1 (model A)/H2AX complex (A), and CARP-1 (model B)/H2AX complex (B). Each analysis was completed over 24 ns of simulation for each complex. (C) Surface plasmon resonance sensogram showing binding of noted CARP-1 and H2AX peptides (inset) as detailed in Section 2.
Figure 7
Figure 7
Disruption of H2AX interaction with CARP-1 results in enhanced viabilities of CFM-4-, CFM-4.16-, or Adriamycin-treated cells in part due to reduced apoptosis. (A,C,D) Indicated MDA-MB-468 cell lines were treated with DMSO (Control), or with the noted dose and time of Adriamycin, CFM-4, or CFM-4.16 compounds. Determination of viable/live cells was carried out by MTT assay as described in Section 2. (B,E,F) Cell lysates derived from vehicle DMSO (Control), or CFM-4-, CFM-4.16-, or Adriamycin-treated cells were added to the wells that had immobilized fluorogenic substrates of noted caspases. The fluorescence released from the activated caspase-dependent cleavage of respective substrate was detected by a plate reader at the excitation and emission wavelengths of 380 nm and 460 nm, respectively, as detailed in Section 2. The columns in bar charts in panels A, C, D and B, D, F represent means of three and two independent experiments, respectively; bars, SE. For panels C and D, * p < 0.05, **p < 0.01 and *** p ≤ 0.001 relative to the respective EGFP vector subline. For panels E and F, *** p ≤ 0.05 relative to the respective EGFP vector subline.
Figure 7
Figure 7
Disruption of H2AX interaction with CARP-1 results in enhanced viabilities of CFM-4-, CFM-4.16-, or Adriamycin-treated cells in part due to reduced apoptosis. (A,C,D) Indicated MDA-MB-468 cell lines were treated with DMSO (Control), or with the noted dose and time of Adriamycin, CFM-4, or CFM-4.16 compounds. Determination of viable/live cells was carried out by MTT assay as described in Section 2. (B,E,F) Cell lysates derived from vehicle DMSO (Control), or CFM-4-, CFM-4.16-, or Adriamycin-treated cells were added to the wells that had immobilized fluorogenic substrates of noted caspases. The fluorescence released from the activated caspase-dependent cleavage of respective substrate was detected by a plate reader at the excitation and emission wavelengths of 380 nm and 460 nm, respectively, as detailed in Section 2. The columns in bar charts in panels A, C, D and B, D, F represent means of three and two independent experiments, respectively; bars, SE. For panels C and D, * p < 0.05, **p < 0.01 and *** p ≤ 0.001 relative to the respective EGFP vector subline. For panels E and F, *** p ≤ 0.05 relative to the respective EGFP vector subline.
Figure 8
Figure 8
Ectopic expression of TAT-CARP-1 (636–650) peptide results in enhanced viabilities of Adriamycin-treated cells. MDA-MB-468 (A) or HeLa (B) cells were pre-incubated with 300 μg/mL indicated peptides for 72 h, followed by treatments with the noted dose and time of Adriamycin. Determination of viable/live cells was carried out using an MTT assay as described in Section 2. The bar charts in panels A and B represent means of three and two independent experiments, respectively; bars, SE. (C) Indicated cells were either pre-incubated with 6 μg/mL indicated peptides for 72 h or not (Control), followed by treatments with Adriamycin as noted. Cells were then processed for immunofluorescence staining for TAT-CARP-1 peptide (red), γH2AX (green), and DAPI (blue) as detailed in Section 2 and Figure S3 (Supplementary Materials). Insets in C show enlarged areas of respective photomicrographs to indicate presence of TAT-CARP-1 peptide and γH2AX in respective columns. The insets in the top and middle rows of the merge column show co-localization of TAT-CARP-1 peptide, and γH2AX (magnification: 250×).

References

    1. Hartwell L.H., Kastan M.B. Cell cycle control and cancer. Science. 1994;266:1821–1828. doi: 10.1126/science.7997877. - DOI - PubMed
    1. Evan G.I., Vousden K.I. Proliferation, cell-cycle and apoptosis in cancer. Nature. 2001;411:342–348. doi: 10.1038/35077213. - DOI - PubMed
    1. Igney F.H., Krammer P.H. Death and anti-death: Tumour resistance to apoptosis. Nat. Rev. Cancer. 2002;2:277–288. doi: 10.1038/nrc776. - DOI - PubMed
    1. Degterev A., Yuan J. Expansion and evolution of cell death programmes. Nat. Rev. Mol. Cell Biol. 2008;9:378–390. doi: 10.1038/nrm2393. - DOI - PubMed
    1. Rishi A.K., Zhang L., Boyanapalli M., Wali A., Mohammad R.M., Yu Y., Fontana J.A., Hatfield J.S., Dawson M.I., Majumdar A.P.N., et al. Identification and characterization of a Cell-Cycle and Apoptosis Regulatory Protein (CARP)-1 as a novel mediator of apoptosis signaling by Retinoid CD437. J. Biol. Chem. 2003;278:33422–33435. doi: 10.1074/jbc.M303173200. - DOI - PubMed