. 2019 Feb 15;19(4):789.
doi: 10.3390/s19040789.

Monte Carlo Analysis of Optical Interactions in Reflectance and Transmittance Finger Photoplethysmography

Affiliations

Monte Carlo Analysis of Optical Interactions in Reflectance and Transmittance Finger Photoplethysmography

Subhasri Chatterjee et al. Sensors (Basel). .

Abstract

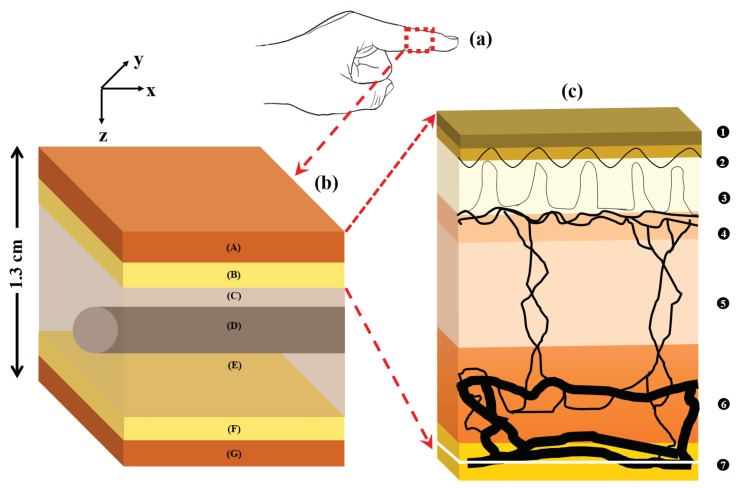
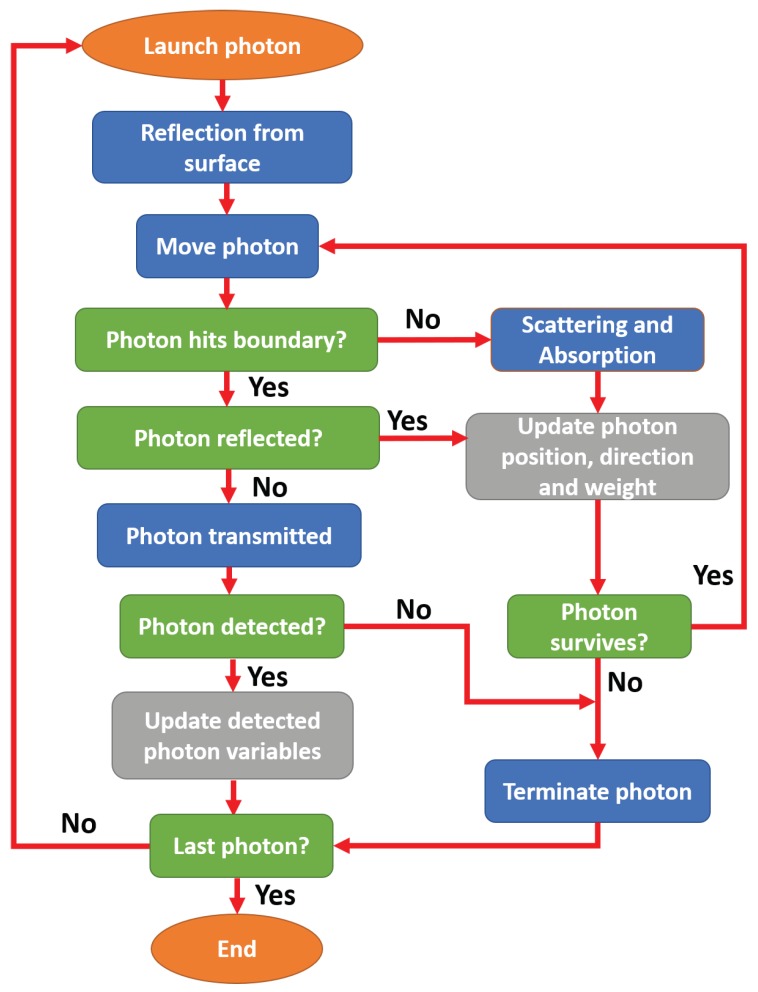
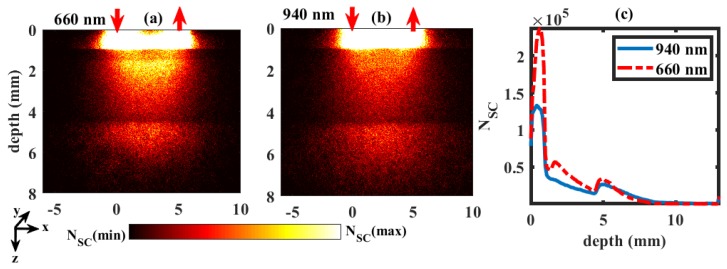
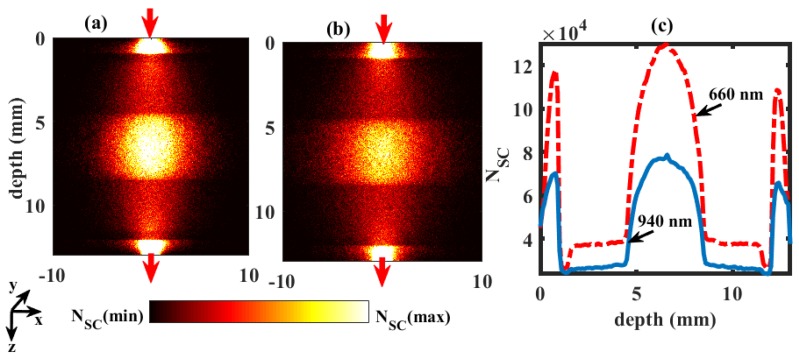
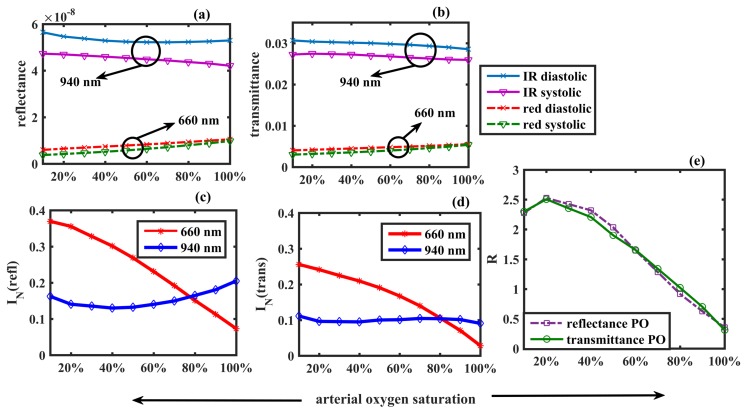
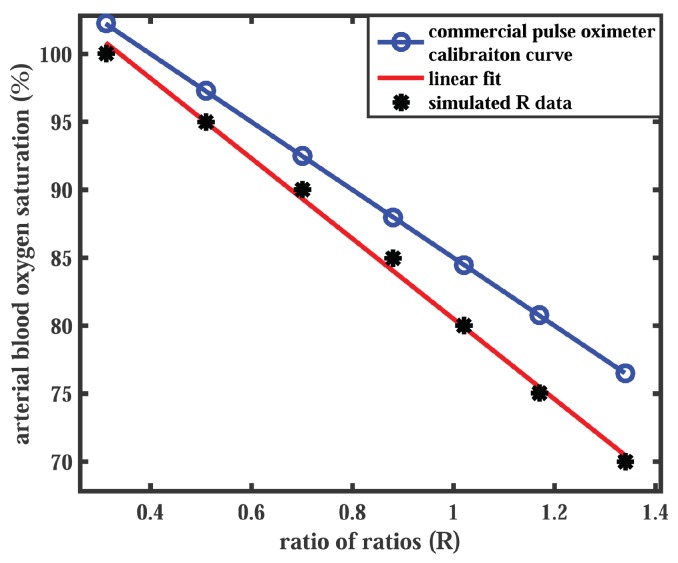
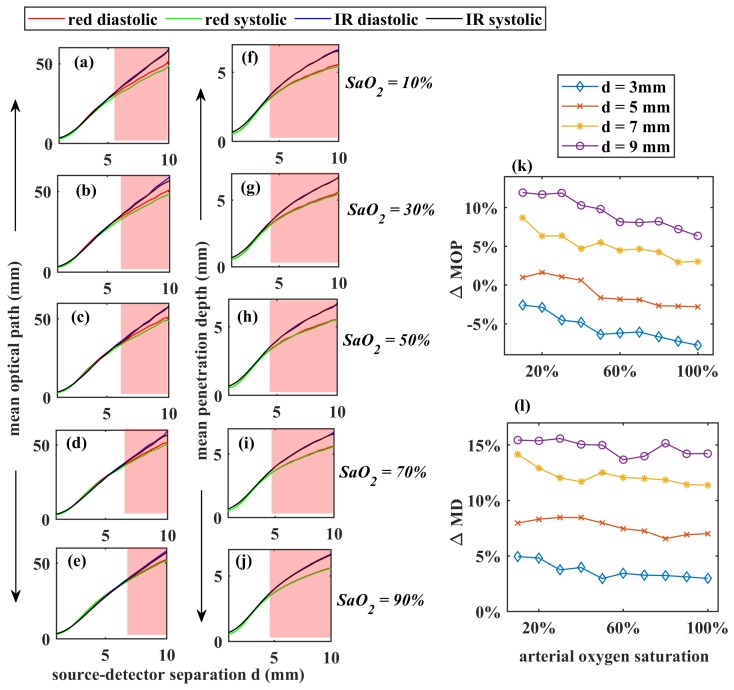
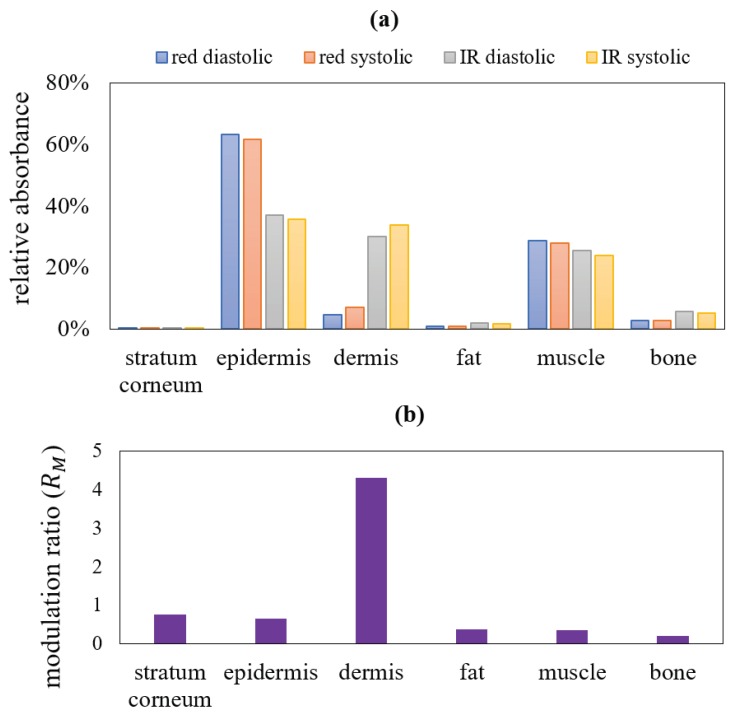
Photoplethysmography (PPG) is a non-invasive photometric technique that measures the volume changes in arterial blood. Recent studies have reported limitations in developing and optimising PPG-based sensing technologies due to unavailability of the fundamental information such as PPG-pathlength and penetration depth in a certain region of interest (ROI) in the human body. In this paper, a robust computational model of a dual wavelength PPG system was developed using Monte Carlo technique. A three-dimensional heterogeneous volume of a specific ROI (i.e., human finger) was exposed at the red (660 nm) and infrared (940 nm) wavelengths in the reflectance and transmittance modalities of PPG. The optical interactions with the individual pulsatile and non-pulsatile tissue-components were demonstrated and the optical parameters (e.g., pathlength, penetration depth, absorbance, reflectance and transmittance) were investigated. Results optimised the source-detector separation for a reflectance finger-PPG sensor. The analysis with the recorded absorbance, reflectance and transmittance confirmed the maximum and minimum impact of the dermis and bone tissue-layers, respectively, in the formation of a PPG signal. The results presented in the paper provide the necessary information to develop PPG-based transcutaneous sensors and to understand the origin of the ac and dc components of the PPG signal.

Keywords: Monte Carlo; calibration curve; oxygen saturation; photoplethysmography; pulsatile tissue; scattering and absorption.


Conflict of interest statement

The authors declare no conflict of interest.

Figures

Figure 1
Figure 1
A volume of the finger tissue (a) is zoomed in (b) where the tissue layers are described as: skin (A), fat (B) and muscle (C,E), and then fat (F) and skin (G) in the reverse order. The muscle layer also contains a cylindrical bone (D) within it. The vasculature in the skin tissue sublayers (1–7) is illustrated in (c) and the stratification are described in Table 1.
Figure 2
Figure 2
Flowchart of Monte Carlo algorithm.
Figure 3
Figure 3
Scattering distributions at wavelengths 660 nm and 940 nm in the reflectance geometry are shown in (a,b), respectively. The upward and downward red arrows represent the position of optical source and detector. Colourbar represents the distribution between the maximum and minimum number of scattering events (NSC). The numbers of scattering at different depths of tissue are shown in (c).
Figure 4
Figure 4
Scattering distributions at wavelengths 660 nm and 940 nm in the transmittance geometry are shown in (a,b), respectively. The upward and downward red arrows represent the position of optical source and detector. Colourbar represents the distribution between the maximum and minimum number of scattering events (NSC). The number of scattering distributions at different depths of tissue are shown in (c).
Figure 5
Figure 5
Detected reflectance and transmittance in two sets of PPG geometries are shown in (a,b). The normalised reflectance and the normalised transmittance, as functions of arterial blood oxygen saturation, are plotted in (c,d). The ‘ratio of ratios’ R is plotted against the arterial blood oxygen saturation in (e).
Figure 6
Figure 6
A comparison of the Monte Carlo predicted calibration curve with the commercial pulse oximeter calibration curve is presented. The simulated data points (black markers) are linearly fitted (red solid line). The commercial pulse oximeter calibration curve (blue solid line) is generated by Equation (11).
Figure 7
Figure 7
The mean optical path and the depth of penetration at red and infrared wavelengths for different SaO2 are shown in (aj) respectively. The percentage changes in diastolic mean optical path and penetration depth (ΔMOP and ΔMD) at d = 3 mm, 5 mm, 7 mm, and 9 mm are presented in (k,l) respectively. The shaded area in the graphs are the regions where the optical paths and penetration depths deviate between the operating wavelgnths.
Figure 8
Figure 8
In a transmittance mode PPG, the distribution of the relative absorbances (in percentage form) and the absorbance modulation ratio RM at different layers are shown in (a,b) respectively. The systolic and diastolic absorbances in both red and infrared wavelengths at different tissue layers and the corresponding modulation ratio, shown in this figure, are illustrated in Table 3.
Figure 9
Figure 9
The effect of melanin concentration on the intensity (detected photon weight) and the mean optical path are shown in (a,b) respectively.

Similar articles

Cited by

References

    1. Hickey M., Phillips J.P., Kyriacou P.A. Investigation of peripheral photoplethysmographic morphology changes induced during a hand-elevation study. J. Clin. Monit. Comput. 2016;30:727–736. doi: 10.1007/s10877-015-9761-0. - DOI - PubMed
    1. Moyle J.T.B. Pulse Oximetry. BMJ Books; London, UK: 1994.
    1. Abay T.Y., Kyriacou P.A. Reflectance Photoplethysmography as Noninvasive Monitoring of Tissue Blood Perfusion. IEEE Trans. Biomed. Eng. 2015;62:2187–2195. doi: 10.1109/TBME.2015.2417863. - DOI - PubMed
    1. Allen J. Photoplethysmography and its application in clinical physiological measurement. Physiol. Meas. 2007;28:R1–R39. doi: 10.1088/0967-3334/28/3/R01. - DOI - PubMed
    1. Budidha K., Kyriacou P.A. In vivo investigation of ear canal pulse oximetry during hypothermia. J. Clin. Monit. Comput. 2018;32:97–107. doi: 10.1007/s10877-017-9975-4. - DOI - PMC - PubMed

LinkOut - more resources