. 2019 Jun 1;25(11):3392-3403.
doi: 10.1158/1078-0432.CCR-18-1821. Epub 2019 Feb 15.

ATR Inhibition Potentiates the Radiation-induced Inflammatory Tumor Microenvironment

Affiliations

ATR Inhibition Potentiates the Radiation-induced Inflammatory Tumor Microenvironment

Magnus T Dillon et al. Clin Cancer Res. .

Abstract

Purpose: ATR inhibitors (ATRi) are in early phase clinical trials and have been shown to sensitize to chemotherapy and radiotherapy preclinically. Limited data have been published about the effect of these drugs on the tumor microenvironment.Experimental Design: We used an immunocompetent mouse model of HPV-driven malignancies to investigate the ATR inhibitor AZD6738 in combination with fractionated radiation (RT). Gene expression analysis and flow cytometry were performed posttherapy.

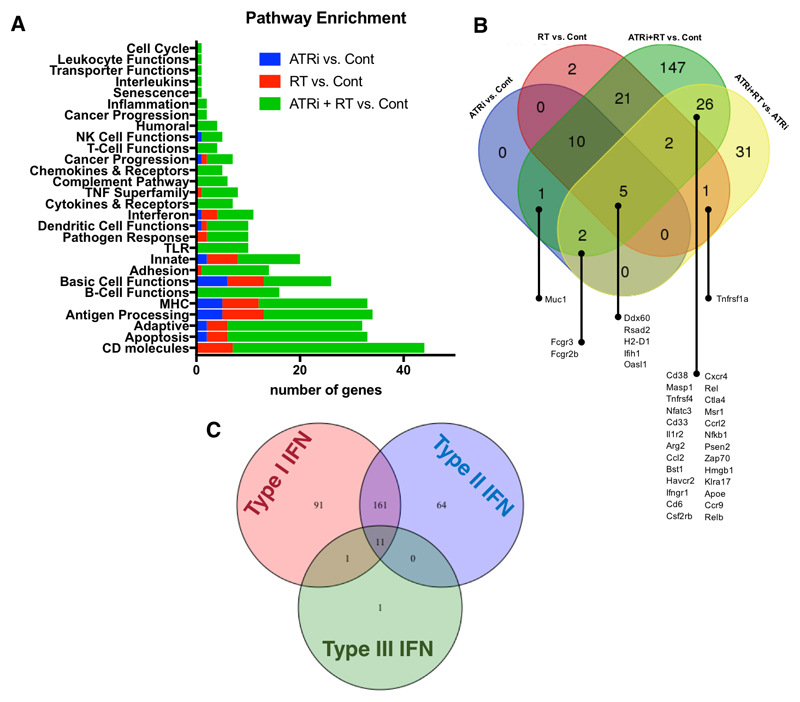
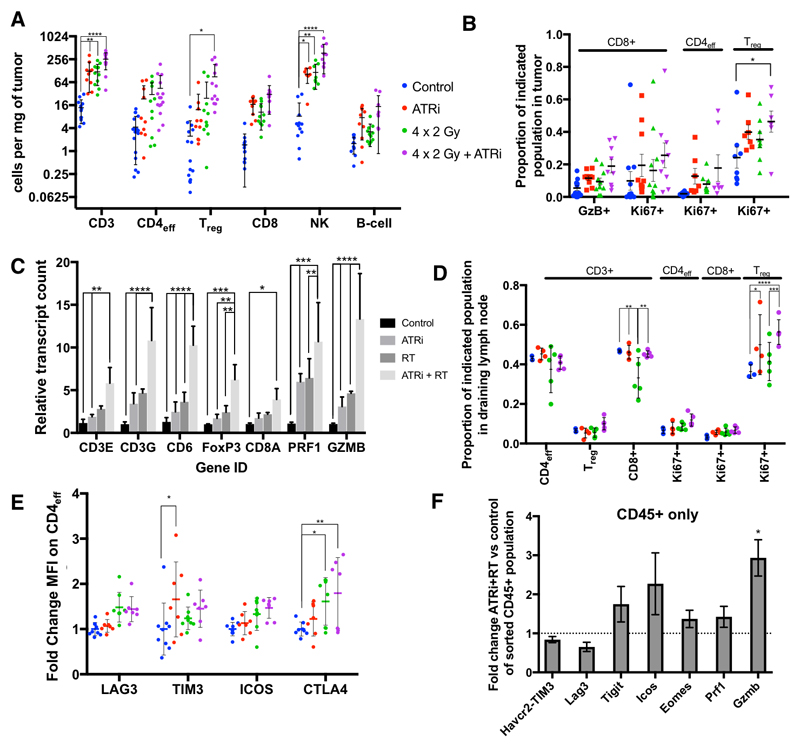
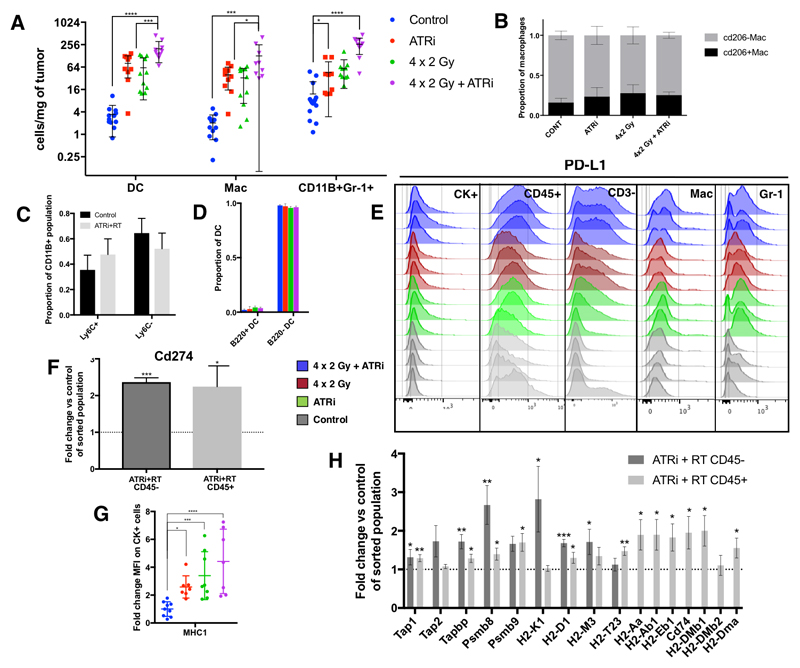
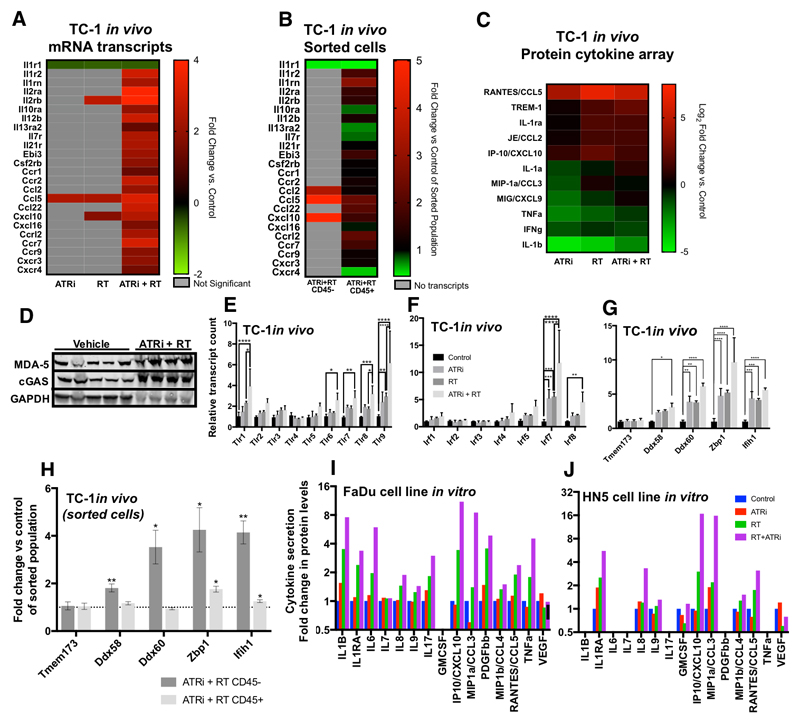
Results: Significant radiosensitization to RT by ATRi was observed alongside a marked increase in immune cell infiltration. We identified increased numbers of CD3+ and NK cells, but most of this infiltrate was composed of myeloid cells. ATRi plus radiation produced a gene expression signature matching a type I/II IFN response, with upregulation of genes playing a role in nucleic acid sensing. Increased MHC I levels were observed on tumor cells, with transcript-level data indicating increased antigen processing and presentation within the tumor. Significant modulation of cytokine gene expression (particularly CCL2, CCL5, and CXCL10) was found in vivo, with in vitro data indicating CCL3, CCL5, and CXCL10 are produced from tumor cells after ATRi + RT.

Conclusions: We show that DNA damage by ATRi and RT leads to an IFN response through activation of nucleic acid-sensing pathways. This triggers increased antigen presentation and innate immune cell infiltration. Further understanding of the effect of this combination on the immune response may allow modulation of these effects to maximize tumor control through antitumor immunity.


Conflict of interest statement

Disclosure of Potential Conflict of Interest

The Institute of Cancer Research and Royal Marsden have received funding for a phase I study of AZD6738, which is partially funded by AstraZeneca.

Figures

Figure 1
Figure 1. AZD678 therapeutic efficacy combined with fractionated radiotherapy in vivo corresponds to increased CD3+ and B220+ cell infiltration by IHC.
A, Relative tumor growth curves for C57Bl/6 mice carrying subcutaneous TC1 tumors, treated with vehicle, AZD6738 75 mg/kg daily for 5 days, radiation 2 Gy x 4 (daily fractions), or AZD6738 with radiation; the first dose of AZD6738 was administered 2 h prior to irradiation and the last dose was administered the day after the final fraction of radiation. Asterisk represents p <0.05 between radiation and radiation + ATRi curves by unpaired t-test. Minimum 10 animals per group. B, quantification of TC1 tumors from (A) stained for CD3 by immunohistochemistry. Minimum 10 fields of view and at least 3 tumors analysed per condition. Average number per field is shown for each tumor, tumors were harvested 5 days after the last fraction of radiation was administered. C, quantification of B220-positive cells, as per (B).
Figure 2
Figure 2. Nanostring gene expression analysis reveals AZD6738 significantly modules radiation induced immune-linked transcripts in vivo.
A, Overview of differential gene expression with ATR-radiation combinations in the TC-1 murine model at 5 days after the end of 4 x 2 Gy radiation in the presence or absence of AZD6738. Differential expression analysis of NanoString data was performed, and gene functional annotations used to classify each gene with significantly altered expression into one of the above groups. Genes with significant change in expression (with p < 0.05 by Benjamini-Yekutieli Method) were grouped into functional categories and the number of genes with significant differential expression per category is shown for the indicated pairwise comparisons. Legend indicates which two groups were compared. B, Venn diagram illustrating numbers of genes with significant changes in expression for the indicated combinations. C, Venn diagram illustrating interferon-stimulated genes, for ATRi-RT combination treatment. The number of genes stimulated by each of type I, II and III interferons is demonstrated. Overall, there is a greater representation of genes that are stimulated by type I interferons in the database, and very few by type III interferons, so this may lead to a degree of bias in these results (from Interferome database).
Figure 3
Figure 3. AZD6738 increases radiation induced lymphoid infiltration in vivo.
A, number of lymphoid cells per mg tumor was calculated 5 days after the end of 4 x 2 Gy radiation in the presence or absence of AZD6738. Error bars: SD (one direction only if lower SD outside the plotted area), asterisks: statistical significance by ANOVA with multiple comparisons, Min. 3 independent repeats of at least 3 animals per group. Populations were identified by the markers: CD3, CD3+; CD4eff, CD3+CD4+FOXP3-; Treg, CD3+CD4+FOXP3+; CD8, CD3+CD8+; NK, CD3-B220-NK1.1+; B cell, B220+. B, change in proportion of Granzyme B (GzB+) or Ki67+ CD8+ cells as a proportion of total CD8+ cells, and Ki67+ (proliferating) cells as a proportion of total CD4+FOXP3- or CD4+FOXP3+ cells. Error bars: SEM. C, mRNA transcript fold change in whole tumor lysates at 5 days after completion of radiotherapy. Copy number normalised to median controls. Mean and SD plotted, asterisks: statistical significance by ANOVA with multiple comparisons. D, change in proportion of effector, regulatory and CD8-positive T cells, as a function of total CD3-positive cells, and Ki67-positive Treg, Teff and CD8 positive, as a proportion of total Treg, Teff and CD8-positive cells, in draining lymph node (ipsilateral inguinal node), five days after completion of radiotherapy, min. 3 animals per group. E, normalised fluorescence intensity (normalised to mean of control fluorescence) of effector CD4 T-cells (CD3+, CD4+, FoxP3-), for the indicated markers of activation in tumor infiltrating cells in TC-1 tumors 5 days after the end of 4 x 2 Gy radiation in the presence or absence of AZD6738. Minimum 3 animals per group in 2 independent experiments. F, fold-change mRNA transcript counts for corresponding genes indicating T cell activation, in a cell population sorted for CD45 in ATRi-RT treated tumours, relative to the median value for the control samples of each gene, mean and SD are plotted, asterisks: significance by unpaired t-test between ATRi-RT and control
Figure 4
Figure 4. AZD6738 increases radiation induced myeloid infiltration in vivo.
A, Assessment of tumor infiltrating myeloid cells at day 5 after treatment. Populations were identified as follows: B cells, B220+; dendritic cells, CD11c+ MHCII+; macrophages (Mac), CD11b+ CD11c- CD68+ SSCLow, MHC-2+, Gr-1Low-Int; CD11b+ Gr-1Int-Hi NK1.1- CD3-. Asterisks: statistical significance by ANOVA with multiple comparisons testing. B, Proportions of CD206-positive and negative tumor-infiltrating macrophages, as a marker of M2a and M2c macrophages. C, proportions of CD11b+Gr-1+ subsets: proportions of CD11b+ Ly6CHigh for monocytic and Ly6CLow for granulocytic, no significant difference between control and ATRi+RT; D, Dendritic cells (CD11C+ MHC2+) were stained with B220, a marker of plasmacytoid DC. Proportion of parent shown. E, Flow cytometric analysis of PD-L1 staining for the indicated tumor subpopulations: CK+ indicates pan-cytokeratin positive cells, a surrogate for tumor cells. Mac = Macrophages (CD11b+, CD3-, NK1.1-, CD11cLow, CD68+, MHCII+, Gr1Low-int); Gr-1 = CD11b+, Gr1+, CD3- NK1.1-. F, mRNA counts for PD-L1 (Cd274), expressed as fold change in ATRi-RT treated tumours compared with control, in tumour populations sorted by CD45 status. G, flow cytometric analysis of tumor cells (pan-cytokeratin positive), showing mean fluorescence intensity for MHC-1 (mouse: H-2Kb). Mean fluorescence normalised to average control value. H, mRNA expression of genes involved in antigen processing and presentation, fold change in ATRi-RT vs. control, expressed as fold change in ATRi-RT treated tumours compared with control, in tumour populations sorted by CD45 status. All panels: 5 days after the end of treatment with 4 × 2 Gy radiation in the presence or absence of AZD6738. Minimum 3 tumors per condition, 2 independent experiments. significance: ANOVA with multiple comparisons (except F, H: unpaired t-test), mean and SD displayed.
Figure 5
Figure 5. ATRi-RT causes modulation of cytokine production
Analysis of changes in cytokine expression with ATR—radiation combinations, 5 days after treatment with 4 × 2 Gy radiation in the presence or absence of AZD6738. A, mRNA expression data, only statistically significant changes are displayed. Mean of 3 replicates displayed. Fold change from control tumors displayed. Grey boxes: no significant difference found. B, Cytokine, chemokine, and receptor transcript analysis, as for (A), in tumour populations sorted by CD45-status. Grey boxes: no transcripts. C, protein expression by cytokine array. Densitometry of array was measured and then normalised to positive and negative controls. Two tumors per group were analysed in duplicate. Mean of 2, Log2 fold change replicates displayed. D, western blot showing changes in the indicated proteins in in vivo samples after vehicle or ATRi+RT treatment, 5 days after the end of irradiation. E, mRNA expression of toll-like receptor (TLR) transcripts. F, mRNA expression of interferon regulatory factor (IRF) transcripts. G, mRNA expression of the indicated nucleic acid-sensing proteins. A-G: at 5 days after the final dose of radiotherapy, 3 animals per group, mean and S.D. displayed, analysed by ANOVA with multiple comparisons. H, Analysis of transcripts for nucleic acid sensors as for (G), on sorted populations of CD45-positive and –negative tumour cells. Asterisk: significance by unpaired t-test compared with control group for same cell population. I, J, measurement of cytokine concentration in supernatant of tumor cell lines FaDu (I) and HN5 (J) at 72 hours after treatment with DMSO, AZD6738 (0.5 μM), an 8 Gy fraction of radiation, or radiation in combination with AZD6738 (added 1 hour prior to irradiation). Supernatant was analysed by mutliplex bead-based flow cytometry. Only analytes detected above lower limit of quantification are displayed. Mean of two independent experiments, each run in duplicate, displayed.

References

    1. Weichselbaum RR, Liang H, Deng L, Fu YX. Radiotherapy and immunotherapy: a beneficial liaison? Nature reviews Clinical oncology. 2017;14:365–79. - PubMed
    1. Barker HE, Paget JT, Khan AA, Harrington KJ. The tumour microenvironment after radiotherapy: mechanisms of resistance and recurrence. Nature reviews Cancer. 2015;15:409–25. - PMC - PubMed
    1. Demaria S, Golden EB, Formenti SC. Role of Local Radiation Therapy in Cancer Immunotherapy. JAMA Oncol. 2015;1:1325–32. - PubMed
    1. Vatner RE, Formenti SC. Myeloid-derived cells in tumors: effects of radiation. Seminars in radiation oncology. 2015;25:18–27. - PubMed
    1. Barber GN. STING: infection, inflammation and cancer. Nat Rev Immunol. 2015;15:760–70. - PMC - PubMed

Publication types

MeSH terms

LinkOut - more resources