. 2019 May;65(5):653-663.
doi: 10.1373/clinchem.2018.296780. Epub 2019 Feb 15.

Increased Clinical Sensitivity and Specificity of Plasma Protein N-Glycan Profiling for Diagnosing Congenital Disorders of Glycosylation by Use of Flow Injection-Electrospray Ionization-Quadrupole Time-of-Flight Mass Spectrometry

Affiliations

Increased Clinical Sensitivity and Specificity of Plasma Protein N-Glycan Profiling for Diagnosing Congenital Disorders of Glycosylation by Use of Flow Injection-Electrospray Ionization-Quadrupole Time-of-Flight Mass Spectrometry

Jie Chen et al. Clin Chem. 2019 May.

Abstract

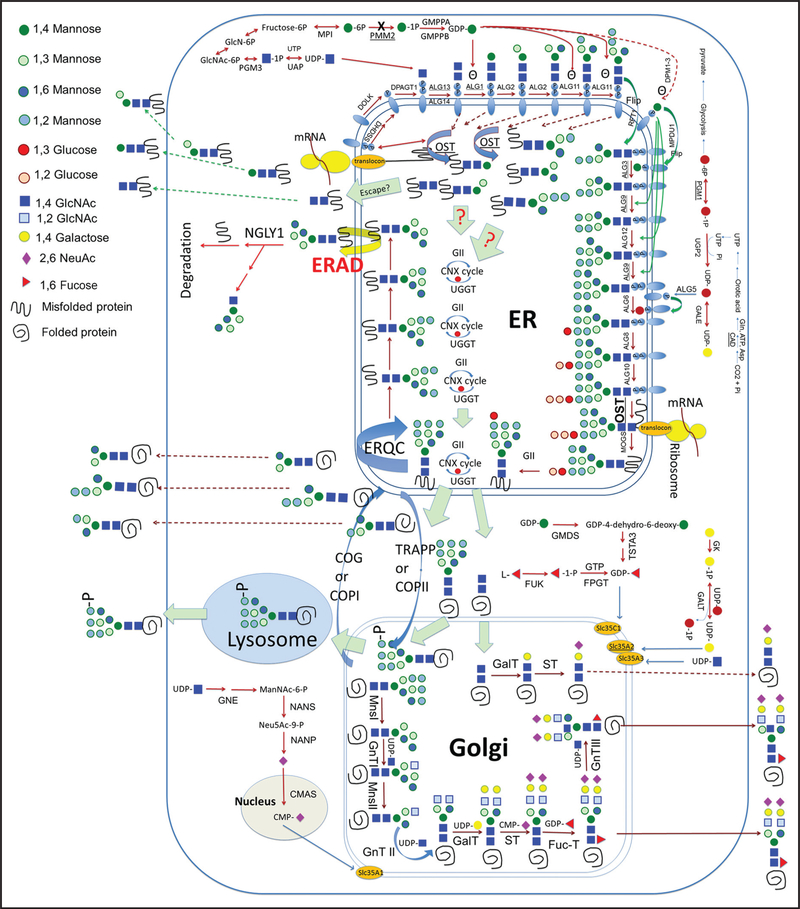
Background: Congenital disorders of glycosylation (CDG) represent 1 of the largest groups of metabolic disorders with >130 subtypes identified to date. The majority of CDG subtypes are disorders of N-linked glycosylation, in which carbohydrate residues, namely, N-glycans, are posttranslationally linked to asparagine molecules in peptides. To improve the diagnostic capability for CDG, we developed and validated a plasma N-glycan assay using flow injection-electrospray ionization-quadrupole time-of-flight mass spectrometry.

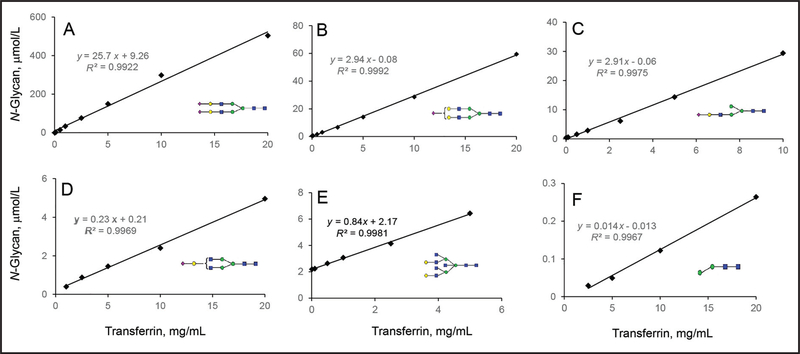
Methods: After PNGase F digestion of plasma glycoproteins, N-glycans were linked to a quinolone using a transient amine group at the reducing end, isolated by a hydrophilic interaction chromatography column, and then identified by accurate mass and quantified using a stable isotope-labeled glycopeptide as the internal standard.

Results: This assay differed from other N-glycan profiling methods because it was free of any contamination from circulating free glycans and was semiquantitative. The low end of the detection range tested was at 63 nmol/L for disialo-biantennary N-glycan. The majority of N-glycans in normal plasma had <1% abundance. Abnormal N-glycan profiles from 19 patients with known diagnoses of 11 different CDG subtypes were generated, some of which had previously been reported to have normal N-linked protein glycosylation by carbohydrate-deficient transferrin analysis.

Conclusions: The clinical specificity and sensitivity of N-glycan analysis was much improved with this method. Additional CDGs can be diagnosed that would be missed by carbohydrate-deficient transferrin analysis. The assay provides novel biomarkers with diagnostic and potentially therapeutic significance.


Conflict of interest statement

Authors’ Disclosures or Potential Conflicts of Interest: Upon manuscript submission, all authors completed the author disclosure form. Disclosures and/or potential conflicts of interest:

Figures

Fig. 1.
Fig. 1.. A scheme of the N-linked glycosylation pathway.
ER, endoplasmic reticulum; ERAD, endoplasmic reticulum-associated degradation; ERQC, endoplasmic reticulum-associated protein quality control; GII, glucosidase II; CNX cycle, calnexin cycle; UGGT, UDP-glucose:glycoprotein glucosyltransferase; COG, conserved oligomeric Golgi complex; OST, oligosaccharyltransferase; COPI or II, coat protein complex I or 2; TRAPP, trafficking protein particle complex; MnsI or II, mannosidase I or II; GnTI, II, or III, GlcNAc transferase I, II, or III; GalT, galactosyltransferase; ST, sialyltransferase; FucT, fucosyltransferase; GlcN-6P, glucosamine-6-phosphate. Human genes shown in the figure: PMM2, MPI, GMPPA, GMPPB, PGM3, NGLY1, DOLK, DHDSS, DPAGT1, ALG13, ALG14, ALG1, ALG2, ALG11, RFT1, DPM1–3, MPDU1, ALG3, ALG9, ALG12, ALG6, ALG8, UGP2, GALE, ALG5, ALG10, MOGS, GMDS, TSTA3, GK, FPGT, FUK, SLC35C1, SLC35A2, SLC35A3, GNE, NANS, NANP, CMAS, PGM1, and CAD.
Fig. 2.
Fig. 2.. Characteristic total ion chromatograms of N-polymannose glycans in control plasma, its background, and in 6 different type I CDG samples.
Overlay of total ion chromatograms of Man0 (A), Man1/Gal1 (B), tetrasaccharide (C), Man2 (D), Man3 (E), Man4 (F), Man5 (G), and Man6 (H) of normal control plasma (in black), normal control without PNGase F digestion as its background signal (brown), ALG3-CDG (gray), ALG1-CDG (red), ALG9-CDG (28), PMM2-CDG (blue), DDOST-CDG (purple), and STT3B-CDG (pink).
Fig. 3.
Fig. 3.. Analytical measurement range of N-disialo-biantennary glycan and the linearity range of other representative N-glycans using pure human transferrin as the standard.
The limit of quantification of disialo-biantennary glycan was determined by an isotope dilution method and shown in (A).The concentration of transferrin standard is presented on the x axis, and the measured N-glycan concentration from transferrin is presented on the y axis. The dilution studies of other glycans semiquantified from transferrin standard are shown in (B–F), of which the concentration of semiquantified glycans is presented on the y axis and plotted against a series concentration of transferrin on the x axis. Monosialo-biantennary glycan (B) and monoantennary glycans (C) have similar abundance on transferrin. The slope and intercept of their linearity curves are also similar. The monoantennary glycan (C) has not previously been reported on normal transferrin. Monogalactosylated glycan (D) and bisected glycan (E) have similar abundance on transferrin, but the slope of their linearity curveis different. N-Man2GlcNAc2 (F) represents an intermediate glycan on transferrin with the lowest abundance.
Fig. 4.
Fig. 4.. Plasma N-glycan levels in type I and type II CDG patients compared with normal controls.
(A), The overlays of plasma N-high mannose abundance (% total glycan) in type I CDG patients (red), type II CDG patients (blue), and 31 normal controls (gray). (B), Selected ratios between N-linked high mannose among type I CDG patients, type II CDG, and normal controls. (C), Plasma N-linked complexed glycan levels in type I CDG patients, type II CDG, and normal controls. (D), Plasma N-linked fucosylated and bisected N-glycan levels in type I CDG patients, type II CDG, and normal controls. The abundance of N-linked Man5 (A) and the ratio of Man5/Man9 (B), highlighted by blue rectangles, separate most CDG patients from the normal controls. Among complexed glycans, the abundance of 2 monogalactosylated glycans (highlighted by blue arrows) separates most patients with CDG from the normal controls (C). A fucosylated monoantennary glycan and a monogalactosylated glycan (highlighted by blue arrows) are representative plasma N-glycan markers that separate patients with CDG from normal controls.

Comment in

References

    1. Ng BG, Freeze HH. Perspectives on glycosylation and its congenital disorders. Trends Genet 2018;34:466–76. - PMC - PubMed
    1. Peanne R, de Lonlay P, Foulquier F, Kornak U, Lefeber DJ, Morava E, et al. Congenital disorders of glycosylation (CDG): quo vadis? Eur J Med Genet 2018;61:643–63. - PubMed
    1. Van Scherpenzeel M, Willems E, Lefeber DJ. Clinical diagnostics and therapy monitoring in the congenital disorders of glycosylation. Glycoconj J 2016;33:345–58. - PMC - PubMed
    1. Xia B, Zhang W, Li X, Jiang R, Harper T, Liu R, et al. Serum N-glycan and O-glycan analysis by mass spectrometry for diagnosis of congenital disorders of glycosylation. Anal Biochem 2013;442:178–85. - PubMed
    1. Saldova R, Stockmann H, O’Flaherty R, Lefeber DJ, Jaeken J, Rudd PM. N-Glycosylation of serum IgG and total glycoproteins in MAN1B1 deficiency. J Proteome Res 2015;14:4402–12. - PubMed

Publication types