

The prevalence of MS in the United States: A population-based estimate using health claims data
- PMID: 30770430
- PMCID: PMC6442006
- DOI: 10.1212/WNL.0000000000007035
The prevalence of MS in the United States: A population-based estimate using health claims data
Erratum in
-
The prevalence of MS in the United States: A population-based estimate using health claims data.Neurology. 2019 Oct 8;93(15):688. doi: 10.1212/WNL.0000000000007915. Neurology. 2019. PMID: 31591182 Free PMC article. No abstract available.
Abstract
Objective: To generate a national multiple sclerosis (MS) prevalence estimate for the United States by applying a validated algorithm to multiple administrative health claims (AHC) datasets.
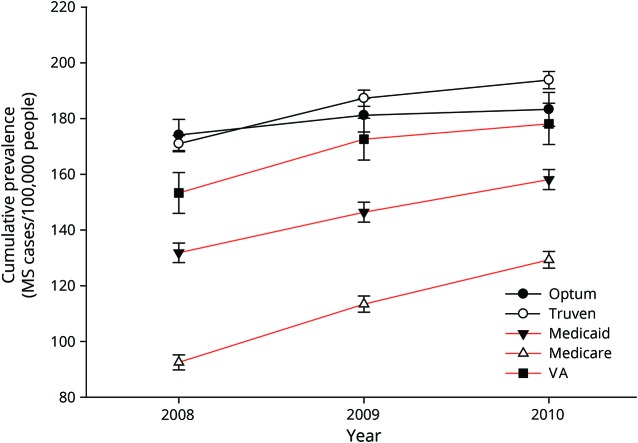
Methods: A validated algorithm was applied to private, military, and public AHC datasets to identify adult cases of MS between 2008 and 2010. In each dataset, we determined the 3-year cumulative prevalence overall and stratified by age, sex, and census region. We applied insurance-specific and stratum-specific estimates to the 2010 US Census data and pooled the findings to calculate the 2010 prevalence of MS in the United States cumulated over 3 years. We also estimated the 2010 prevalence cumulated over 10 years using 2 models and extrapolated our estimate to 2017.
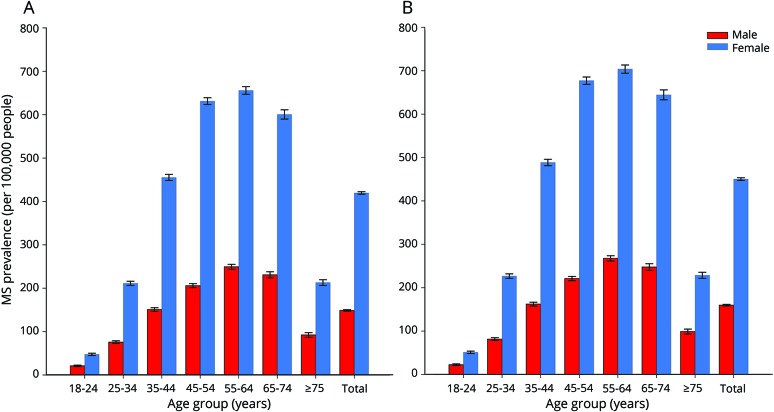
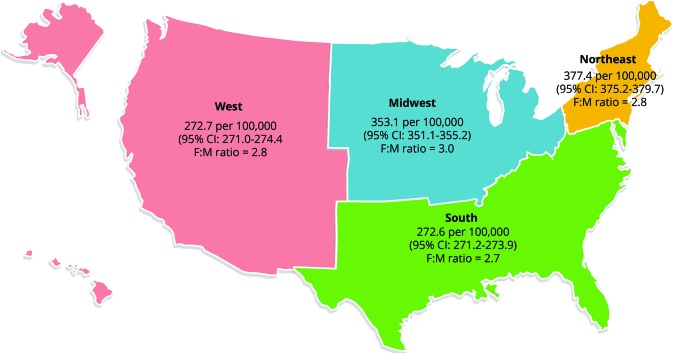
Results: The estimated 2010 prevalence of MS in the US adult population cumulated over 10 years was 309.2 per 100,000 (95% confidence interval [CI] 308.1-310.1), representing 727,344 cases. During the same time period, the MS prevalence was 450.1 per 100,000 (95% CI 448.1-451.6) for women and 159.7 (95% CI 158.7-160.6) for men (female:male ratio 2.8). The estimated 2010 prevalence of MS was highest in the 55- to 64-year age group. A US north-south decreasing prevalence gradient was identified. The estimated MS prevalence is also presented for 2017.
Conclusion: The estimated US national MS prevalence for 2010 is the highest reported to date and provides evidence that the north-south gradient persists. Our rigorous algorithm-based approach to estimating prevalence is efficient and has the potential to be used for other chronic neurologic conditions.
Copyright © 2019 The Author(s). Published by Wolters Kluwer Health, Inc. on behalf of the American Academy of Neurology.
Figures
References
-
- Evans C, Beland SG, Kulaga S, et al. Incidence and prevalence of multiple sclerosis in the Americas: a systematic review. Neuroepidemiology 2013;40:195–210. - PubMed
-
- Baum HM, Rothschild BB. The incidence and prevalence of reported multiple sclerosis. Ann Neurol 1981;10:420–428. - PubMed
-
- Anderson DW, Ellenberg JH, Leventhal CM, Reingold SC, Rodrigues M, Silberberg DH. Revised estimate of the prevalence of multiple sclerosis in the United States. Ann Neurol 1992;31:333–336. - PubMed
Publication types
MeSH terms
LinkOut - more resources
Full Text Sources
Other Literature Sources
Medical