. 2019 Mar 5;116(10):4238-4243.
doi: 10.1073/pnas.1817271116. Epub 2019 Feb 15.

Structural basis for activity of TRIC counter-ion channels in calcium release

Affiliations

Structural basis for activity of TRIC counter-ion channels in calcium release

Xiao-Hui Wang et al. Proc Natl Acad Sci U S A. .

Abstract

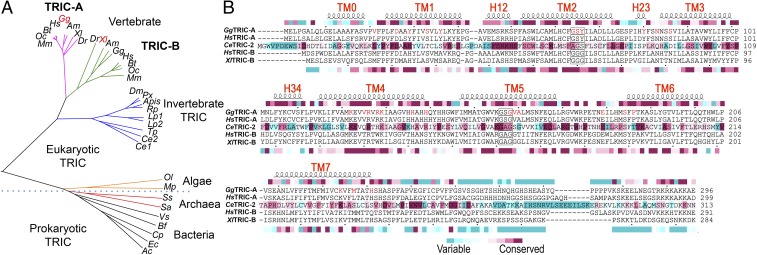
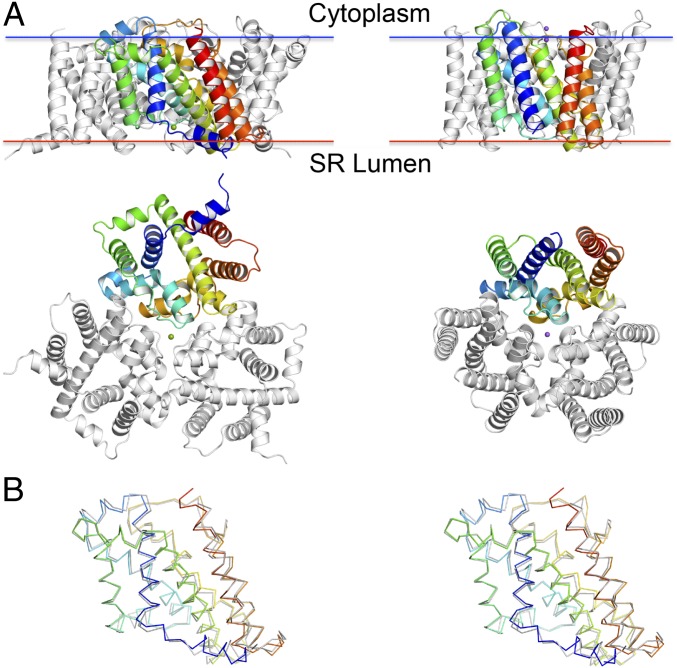
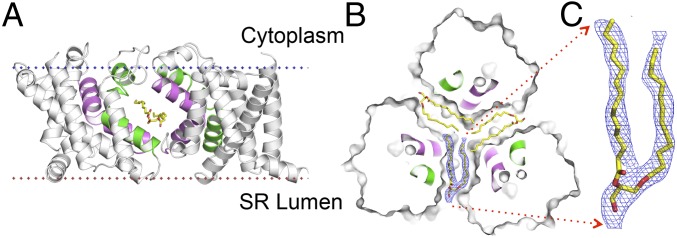
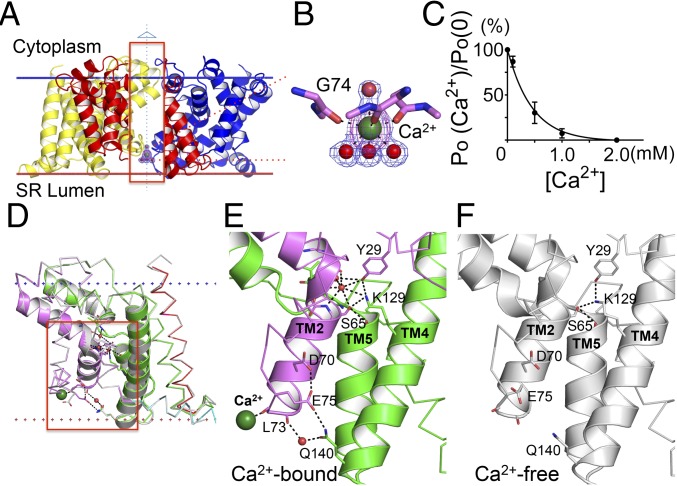
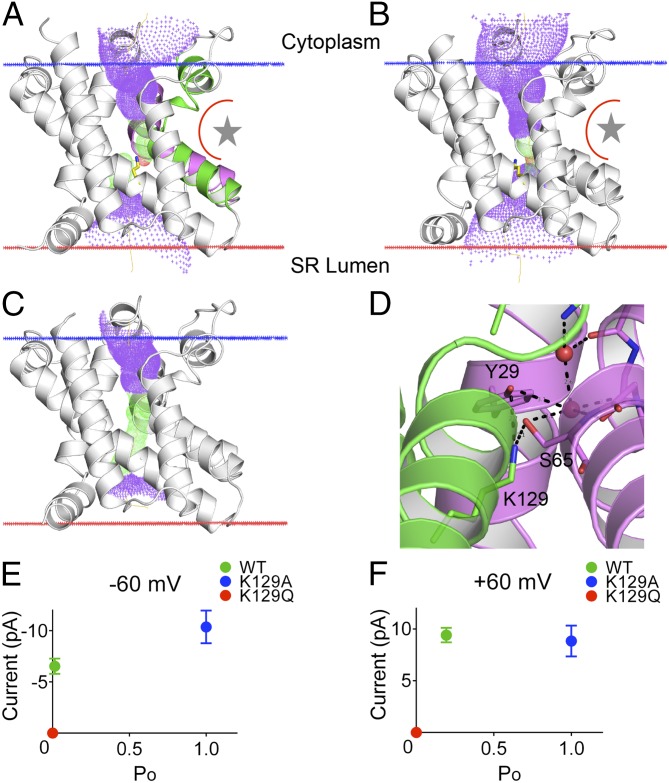
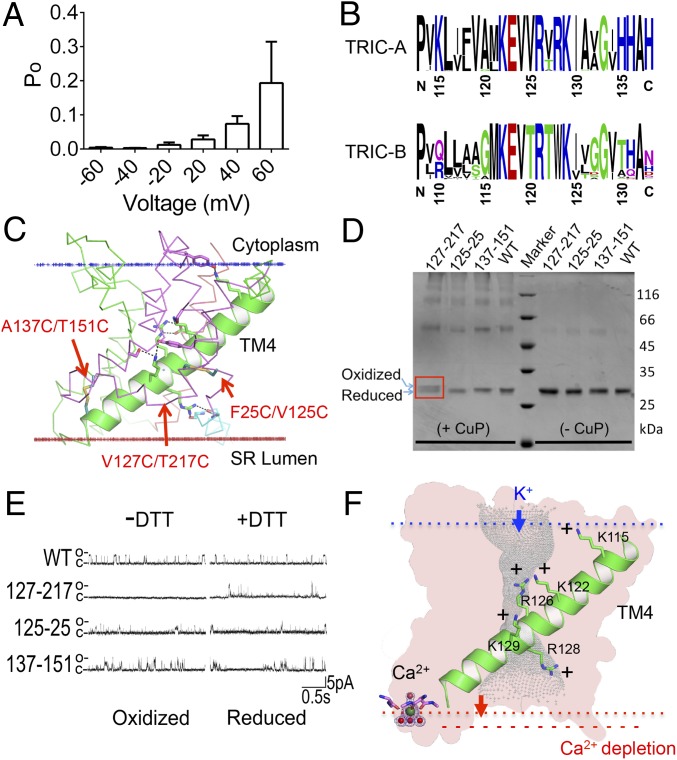
Trimeric intracellular cation (TRIC) channels are thought to provide counter-ion currents that facilitate the active release of Ca2+ from intracellular stores. TRIC activity is controlled by voltage and Ca2+ modulation, but underlying mechanisms have remained unknown. Here we describe high-resolution crystal structures of vertebrate TRIC-A and TRIC-B channels, both in Ca2+-bound and Ca2+-free states, and we analyze conductance properties in structure-inspired mutagenesis experiments. The TRIC channels are symmetric trimers, wherein we find a pore in each protomer that is gated by a highly conserved lysine residue. In the resting state, Ca2+ binding at the luminal surface of TRIC-A, on its threefold axis, stabilizes lysine blockage of the pores. During active Ca2+ release, luminal Ca2+ depletion removes inhibition to permit the lysine-bearing and voltage-sensing helix to move in response to consequent membrane hyperpolarization. Diacylglycerol is found at interprotomer interfaces, suggesting a role in metabolic control.

Keywords: Ca2+ modulation; X-ray crystallography; counter-ion mechanism; electrophysiology; lipid modulation.


Conflict of interest statement

The authors declare no conflict of interest.

Figures

Fig. 1.
Fig. 1.
Structure-based sequence alignment of TRIC Family. (A) Family tree. The presentation was computed by the program COBALT (42) from representative sequences from subfamilies. (B) Structure-based sequence alignments of eukaryotic TRICs from GgTRIC-A, XlTRIC-B, CeTRIC-2, HsTRIC-A, and HsTRIC-B. The structures of GgTRIC-A, CeTRIC-2, and XlTRIC-B have been used to restrict sequence gaps to interhelical segments. Superior coils define extents of the helical segments, boxes are drawn for the highly conserved glycine-containing motifs, red letters mark residues in the TRICs that involved in the ion conduction pathway, and the colored inferior bar encodes ConSurf (43) sequence variability for the vertebrate TRIC-A of 117 nonredundant proteins (Top), the invertebrate TRICs of 133 nonredundant proteins (Middle), and vertebrate TRIC-B of 126 nonredundant proteins (Bottom).
Fig. 2.
Fig. 2.
Structures of TRIC channels. (A) Comparison of vertebrate GgTRIC-A (Left) with prokaryotic and SaTRIC (Right). Ribbon drawings are viewed from the membrane (Top), and from the luminal or extracellular side (Bottom). Bound Ca2+ ion in GgTRIC-A is shown as a green sphere, and two bound Na+ ions in SaTRIC are shown as purple spheres. One protomer is colored spectrally from dark blue at its N terminus to red at its C terminus. Membrane boundaries were calculated by OPM server. (B) Superimposition of the protomer structure of GgTRIC-A and XlTRIC-B. Stereo view of the superimposed Cα backbones, oriented as in A. The coloring for GgTRIC-A protomer is as in A, and XlTRIC-B protomer is in gray.
Fig. 3.
Fig. 3.
Llipid binding in the lateral fenestration. (A) Ribbon drawing of the GgTRIC-A, with one protomer removed. The TM2 and TM5 helices from two protomers are colored purple and green, respectively. The lipid molecules within the lateral fenestrations are shown as stick, with carbon, nitrogen, and oxygen atoms colored yellow, blue, and red, respectively. (B) Cross-section view of GgTRIC-A. Three DAG molecules were superimposed into the lateral fenestrations, with one lipid covered by the 2Fo-Fc electron density map, contoured at 2.0σ, and colored as in A. (C) Close-up view of the lipid molecule, as in B.
Fig. 4.
Fig. 4.
Calcium binding and modulation in TRIC channels. (A) Ribbon diagram of Ca2+ binding in the structure of GgTRIC-A, as viewed from membrane. To have a better view for the Ca2+ binding, a section of the front protomer (inside the red box) is removed. The bound Ca2+ ion (dark green) and water molecules (red) are shown as spheres. 2Fo-Fc electron density contours are shown for both water molecules and Ca2+ ion, contoured at 1.5σ and colored in blue. The anomalous density is also shown for Ca2+ ion, colored in purple and contoured at 5.0σ. (B) A close-up view of the Ca2+ binding to the backbone carbonyl oxygen atom of G74. Water molecules and Ca2+ ion are shown, as in A. G74 O to Ca2+, distance = 2.4 Å; Ca2+ to water molecules, distance = 2.5 Å (lower) or 2.6 Å (upper). (C) GgTRIC-A channel modulation by luminal Ca2+. Relative channel open probabilities (PO) were determined from planar lipid bilayer recordings at +50 mV voltages (200 mM KCl in both trans and cis solutions) in the presence of varied Ca2+ concentrations in the cis side (n = 3). (D) Superimposition of GgTRIC-A, the Ca2+-bound structure vs. the Ca2+-free structure. The residues involved in hydrogen bonding interactions are shown as sticks. The hydrogen bonds (distance <3.2 Å) are indicated as a black dashed line. Water molecules involved in interaction are shown as red spheres. Ca2+ ion is shown as a sphere colored dark green. (E and F) Close-up views of hydrogen bonding interactions in Ca2+-bound GgTRIC-A (E) and Ca2+-free GgTRIC-A (F).
Fig. 5.
Fig. 5.
The ion conduction pore of TRIC channels. (A and B) The pore lining surface as computed by the program HOLE is drawn into a ribbon model of the protomer structure of GgTRIC-A (A) and XlTRIC-A (B), and the kinked TM2 (in purple) and TM5 (in green) helices are shown. The lateral fenestration interface and lipid-binding site is indicated, shown as a star. We used a simple van der Waals surface for the protein and the program default probe radius of 1.15 Å. The lining surface is shown in blue dots except at narrow restrictions (pore radius < 2.0 Å), which are in green dots. A yellow line through the channel marks the calculated centerline of the pore. (C) The pore lining surface of GgTRIC-A K129A mutant is drawn into a ribbon model, oriented and details as in A. (D) Close-up view of the conserved K129 and its hydrogen-bonded interaction with Y29 and S65. Water molecules observed within the ion-conduction pathway are shown as red spheres. (E and F) Analysis of single-channel properties for GgTRIC-A, wild type, K129A, and K129Q mutants (n = 3).
Fig. 6.
Fig. 6.
The voltage sensor and gating mechanism of TRIC channels. (A) Voltage dependency of channel gating. The Po of the full conductance open state at a series of holding potentials is shown. TRIC-A channel activity was reduced at negative potential compared with positive potential (n = 5). (B) Conserved motifs on the voltage-sensing TM4 for both TRIC-A and TRIC-B. (C) The cartoon model for TM4 in the protomer structure of GgTRIC-A. The five highly conserved positive-charge residues and their stabilizing residues are shown as sticks. Three pairs of substituted cysteine mutations (F25C/V125C, V127C/T217C, and A137C/T151C) are also shown as sticks. (D) Analysis of substituted cysteine cross-linking experiment, promoted by CuP-mediated oxidation. The A137C/T151C pair mutant show shift on the SDS/PAGE, indicating the formation of disulfide bond. (E) Single-channel recording analysis of substituted cysteine cross-linking mutants. (F) A model for TRIC channels voltage sensing and its coupling to the gating process.

References

    1. Berridge MJ, Bootman MD, Roderick HL. Calcium signalling: Dynamics, homeostasis and remodelling. Nat Rev Mol Cell Biol. 2003;4:517–529. - PubMed
    1. Clapham DE. Calcium signaling. Cell. 2007;131:1047–1058. - PubMed
    1. Miller C. Voltage-gated cation conductance channel from fragmented sarcoplasmic reticulum: Steady-state electrical properties. J Membr Biol. 1978;40:1–23. - PubMed
    1. Coronado R, Rosenberg RL, Miller C. Ionic selectivity, saturation, and block in a K+-selective channel from sarcoplasmic reticulum. J Gen Physiol. 1980;76:425–446. - PMC - PubMed
    1. Melzer W. No voltage change at skeletal muscle SR membrane during Ca2+ release-just Mermaids on acid. J Gen Physiol. 2018;150:1055–1058. - PMC - PubMed

Publication types