. 2019 Mar 5;116(10):4064-4069.
doi: 10.1073/pnas.1808290116. Epub 2019 Feb 15.

Single-molecule excitation-emission spectroscopy

Affiliations

Single-molecule excitation-emission spectroscopy

Erling Thyrhaug et al. Proc Natl Acad Sci U S A. .

Abstract

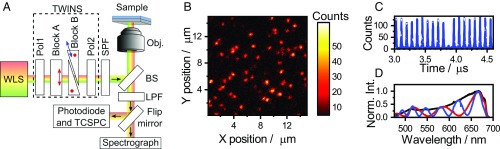
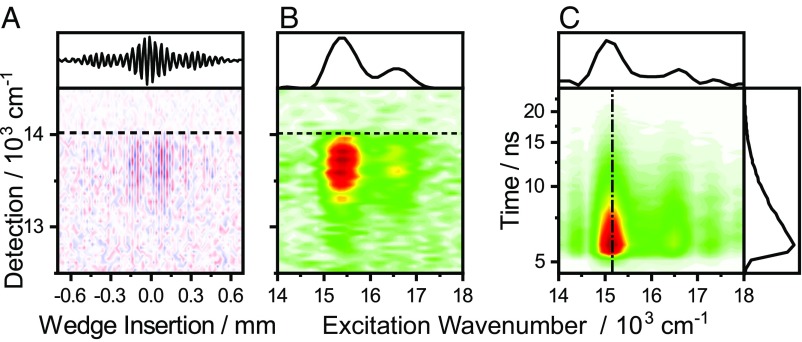
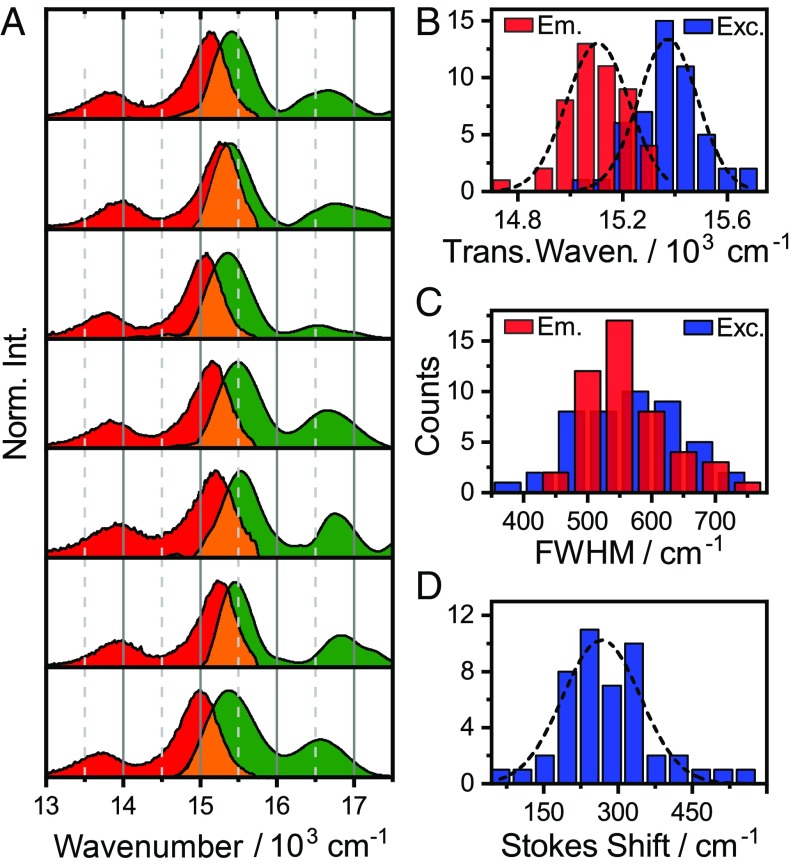
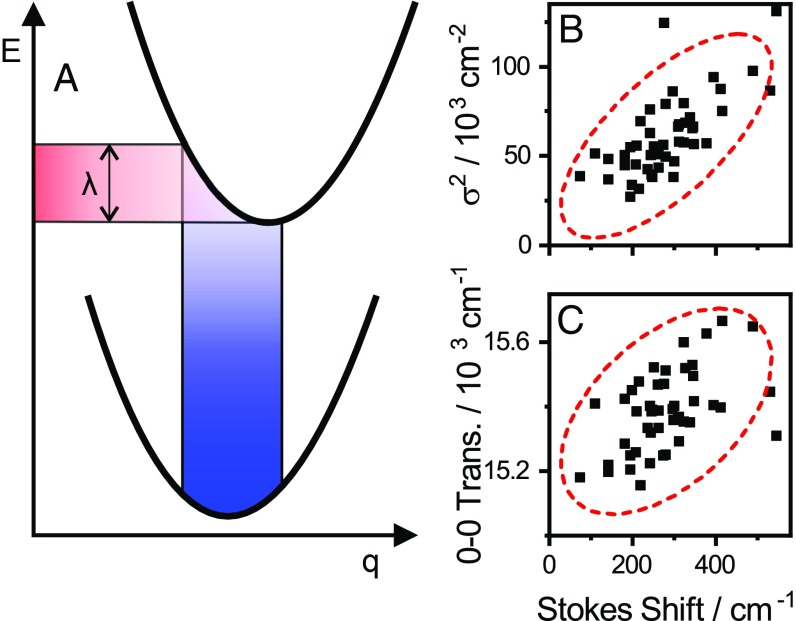
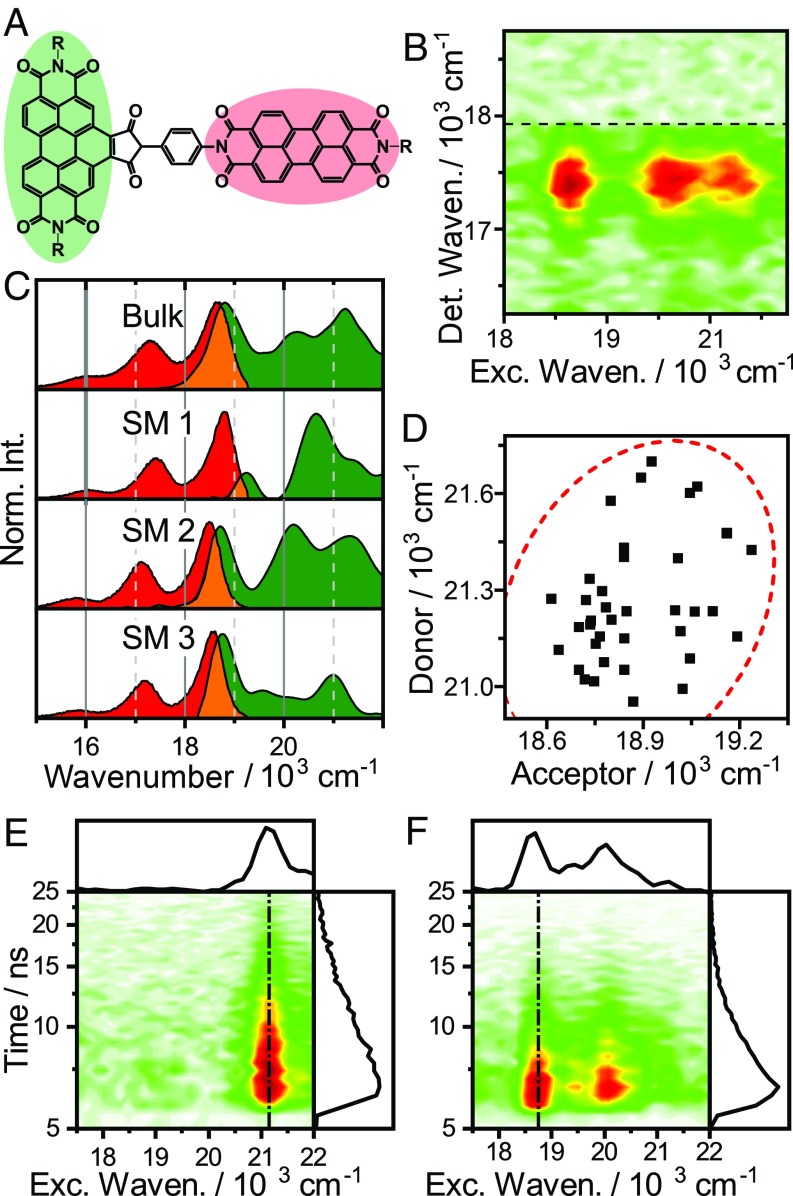
Single-molecule spectroscopy (SMS) provides a detailed view of individual emitter properties and local environments without having to resort to ensemble averaging. While the last several decades have seen substantial refinement of SMS techniques, recording excitation spectra of single emitters still poses a significant challenge. Here we address this problem by demonstrating simultaneous collection of fluorescence emission and excitation spectra using a compact common-path interferometer and broadband excitation, which is implemented as an extension of a standard SMS microscope. We demonstrate the technique by simultaneously collecting room-temperature excitation and emission spectra of individual terrylene diimide molecules and donor-acceptor dyads embedded in polystyrene. We analyze the resulting spectral parameters in terms of optical lineshape theory to obtain detailed information on the interactions of the emitters with their nanoscopic environment. This analysis finally reveals that environmental fluctuations between the donor and acceptor in the dyads are not correlated.

Keywords: correlations; energy transfer; fluorescence; single molecule; spectroscopy.


Conflict of interest statement

Conflict of interest statement: A.P., G.C., and D.P. disclose financial association with the company NIREOS (www.nireos.com), which manufactures the TWINS interferometer used in this paper.

Figures

Fig. 1.
Fig. 1.
(A) Schematic of the interferometry-based confocal microscope. The birefringent interferometer (TWINS) creates two time-delayed, copropagating beam replicas from the output of the white-light source (WLS). See text for details. (B) Image of a 15 × 15-μm region of the TDI sample; each “spot” corresponds to an SM. (C) Photon antibunching data from a single bright spot. The lack of signal at 3.9 μs, corresponding to the detection delay between the APD detectors, demonstrates that it originates from a single emitter. (D) Laser spectra at several interferometer wedge positions. A sinusoidal interference pattern appears in the spectrum with fringe density increasing proportionally to the time delay between the beam replicas.
Fig. 2.
Fig. 2.
SM interferogram (A) and the corresponding SM EEM (B). Excitation spectra can be extracted by integrating the interferogram over the detection frequency (A, Top) followed by an FT, or by an FT to produce the EEM followed by integration over the detection frequency (B, Top). (B). The filter cutoffs are indicated by horizontal dashed lines. (C) Excitation-energy versus emission-intensity decay for an SM constructed from a interferometric TCSPC experiment.
Fig. 3.
Fig. 3.
(A) Representative selection of SM excitation (green) and emission (red) spectra. Significant variations in transition energies, linewidths, and Stokes shifts between molecules are observed. Distribution of transition frequencies (B), 0–0 transition linewidths (C), and Stokes shifts (D).
Fig. 4.
Fig. 4.
(A) Potential energy surfaces in terms of a nuclear coordinate q. In the Brownian oscillator model (18) bath-induced thermal fluctuations induce a distribution in the transition frequencies. The corresponding Stokes shift is related to the reorganization energy λ as Stokes = 2λ. The optical lineshapes and -widths are ultimately determined by the amplitude and frequency of the bath fluctuations. (B) In accordance with the Brownian oscillator model, we observe linear correlation between the Stokes shift and the square of the linewidth. (C) We observe weaker, but significant correlation between the excitation transition frequency and the Stokes shift.
Fig. 5.
Fig. 5.
(A) Structure of the excitation-energy transfer donor–acceptor dyad. (B) EEM of a single dyad. (C) Comparison of excitation (green) and emission (red) spectra of several single dyads and the bulk spectra. (D) Correlation plot of donor- and acceptor frequencies in the dyads; 95% confidence ellipse shown as dashed red line. (E and F) Excitation versus emission intensity decay maps of two single dyads with different relative orientation to the polarization vector of the excitation light.

References

    1. Moerner WE, Kador L. Optical detection and spectroscopy of single molecules in a solid. Phys Rev Lett. 1989;62:2535–2538. - PubMed
    1. Orrit M, Bernard J. Single pentacene molecules detected by fluorescence excitation in a p-terphenyl crystal. Phys Rev Lett. 1990;65:2716–2719. - PubMed
    1. Braeken E, et al. Single molecule probing of the local segmental relaxation dynamics in polymer above the glass transition temperature. J Am Chem Soc. 2009;131:12201–12210. - PubMed
    1. Tinnefeld P, et al. Antibunching in the emission of a single tetrachromophoric dendritic system. J Am Chem Soc. 2002;124:14310–14311. - PubMed
    1. Tamarat P, Maali A, Lounis B, Orrit M. Ten years of single-molecule spectroscopy. J Phys Chem A. 2000;104:1–16. - PubMed

Publication types

LinkOut - more resources