. 2019 Apr 1;142(4):1093-1107.
doi: 10.1093/brain/awz026.

Functional connectivity associated with tau levels in ageing, Alzheimer's, and small vessel disease

Affiliations

Functional connectivity associated with tau levels in ageing, Alzheimer's, and small vessel disease

Nicolai Franzmeier et al. Brain. .

Abstract

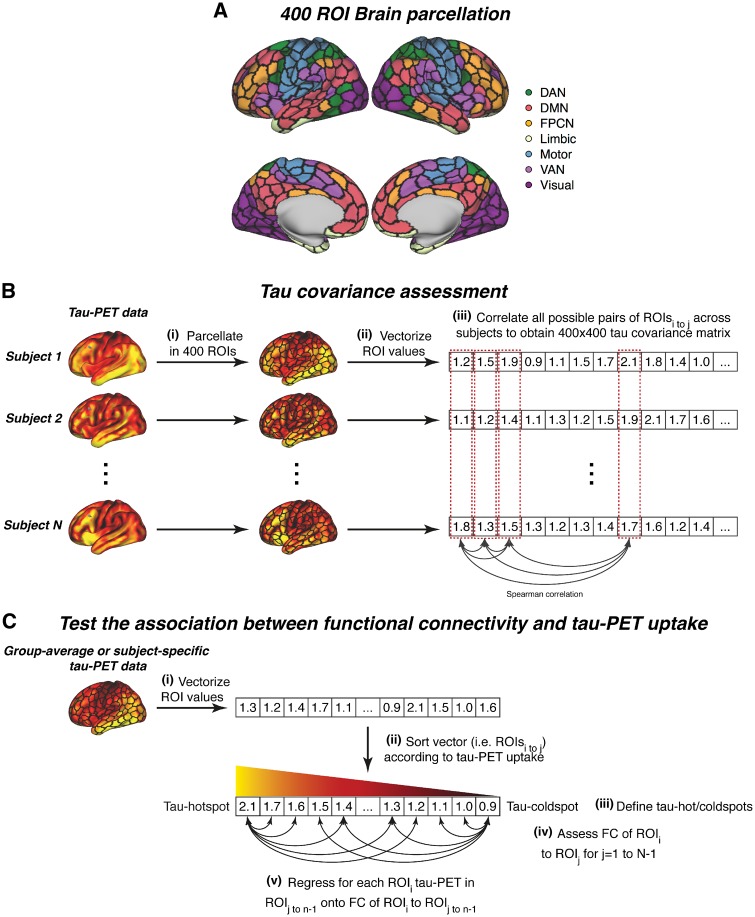
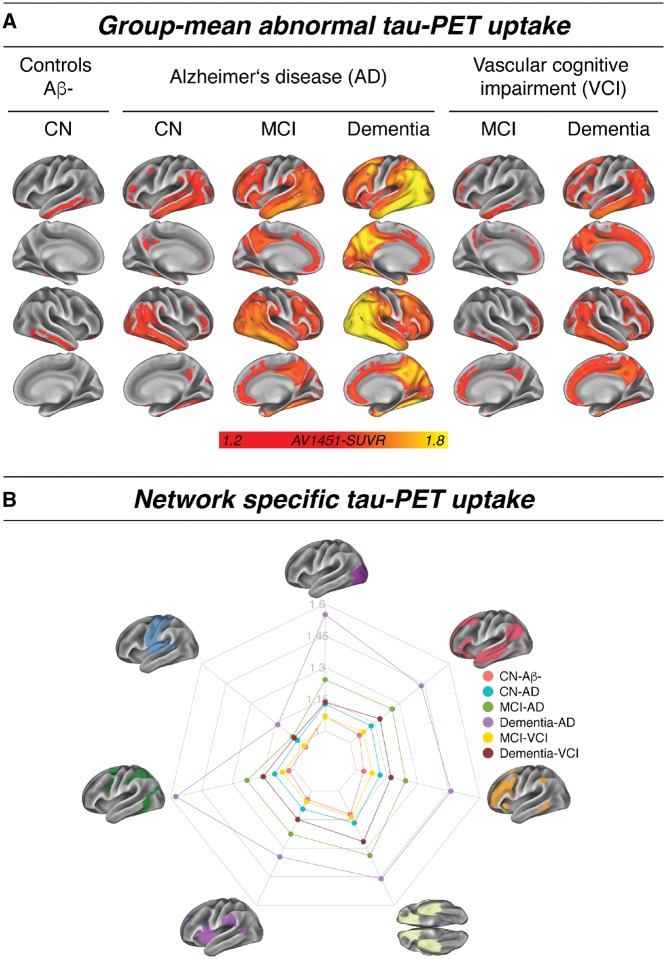
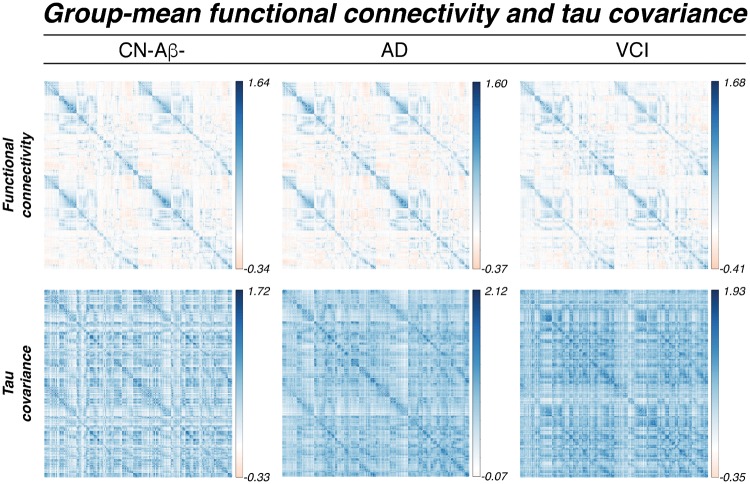
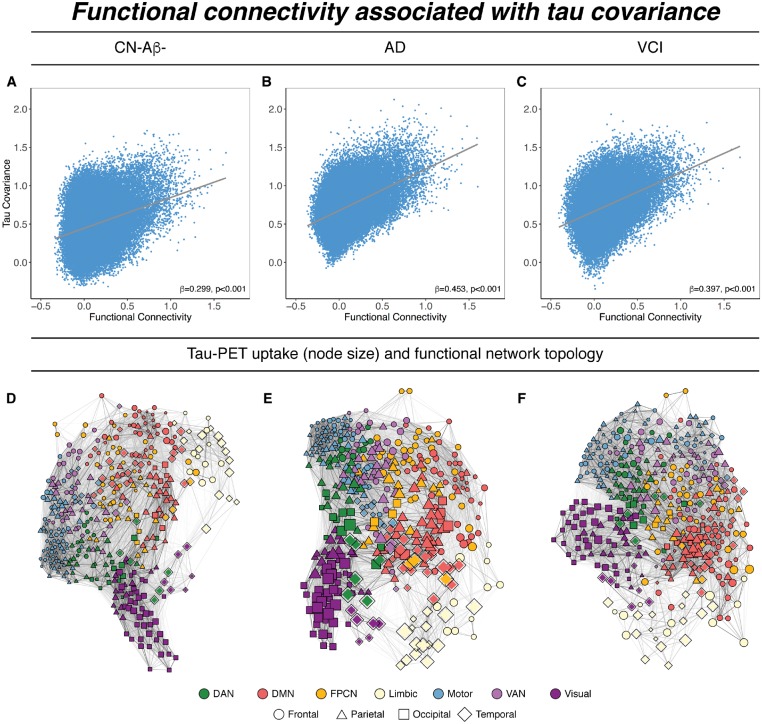
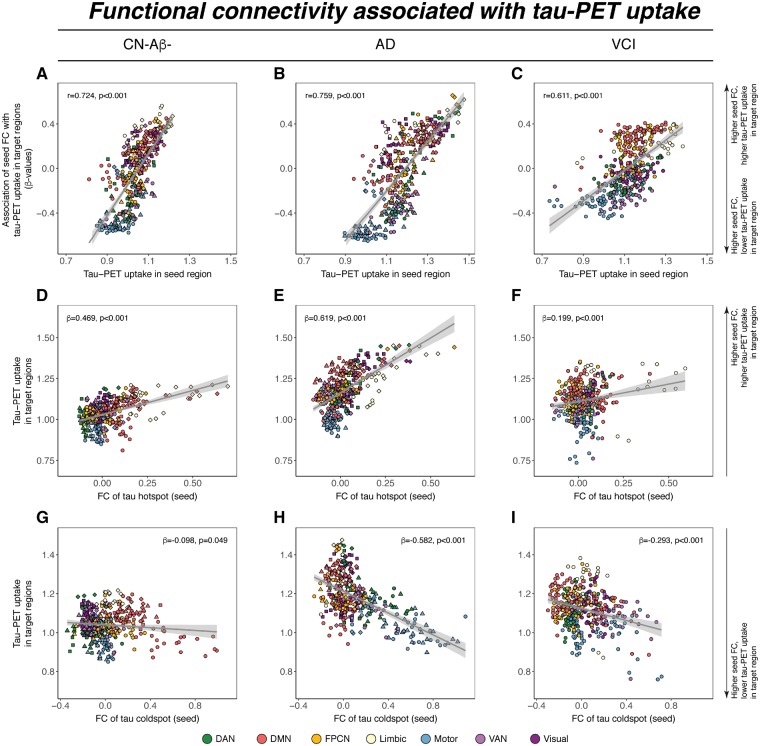
In Alzheimer's disease, tau pathology spreads hierarchically from the inferior temporal lobe throughout the cortex, ensuing cognitive decline and dementia. Similarly, circumscribed patterns of pathological tau have been observed in normal ageing and small vessel disease, suggesting a spatially ordered distribution of tau pathology across normal ageing and different diseases. In vitro findings suggest that pathological tau may spread 'prion-like' across neuronal connections in an activity-dependent manner. Supporting this notion, functional brain networks show a spatial correspondence to tau deposition patterns. However, it remains unclear whether higher network-connectivity facilitates tau propagation. To address this, we included 55 normal aged elderly (i.e. cognitively normal, amyloid-negative), 50 Alzheimer's disease patients (i.e. amyloid-positive) covering the preclinical to dementia spectrum, as well as 36 patients with pure (i.e. amyloid-negative) vascular cognitive impairment due to small vessel disease. All subjects were assessed with AV1451 tau-PET and resting-state functional MRI. Within each group, we computed atlas-based resting-state functional MRI functional connectivity across 400 regions of interest covering the entire neocortex. Using the same atlas, we also assessed within each group the covariance of tau-PET levels among the 400 regions of interest. We found that higher resting-state functional MRI assessed functional connectivity between any given region of interest pair was associated with higher covariance in tau-PET binding in corresponding regions of interest. This result was consistently found in normal ageing, Alzheimer's disease and vascular cognitive impairment. In particular, inferior temporal tau-hotspots, as defined by highest tau-PET uptake, showed high predictive value of tau-PET levels in functionally closely connected regions of interest. These associations between functional connectivity and tau-PET uptake were detected regardless of presence of dementia symptoms (mild cognitive impairment or dementia), amyloid deposition (as assessed by amyloid-PET) or small vessel disease. Our findings suggest that higher functional connectivity between brain regions is associated with shared tau-levels, supporting the view of prion-like tau spreading facilitated by neural activity.

Keywords: Alzheimer’s disease; functional connectivity; resting-state functional MRI; tau-PET; tau-spreading.


Figures

Figure 1
Figure 1
Analysis flow chart. (A) Brain parcellation scheme (Schaefer et al., 2018) that was used for parcellating tau-PET and functional MRI data. (B) Flow chart of the tau covariance analysis. (i) Individual tau-PET scans are parcellated into 400 ROIs for each individual and (ii) mean ROI values are subsequently vectorized. Across subject tau values within a given ROI are correlated with all other ROIs using spearman-correlation (iii) to obtain a 400 × 400 tau covariance matrix. (C) Pipeline for testing the association between functional connectivity of seed ROIs and absolute tau-PET levels in target ROIs. DAN = dorsal attention network; DMN = default-mode network; FC = functional connectivity; FPCN = fronto-parietal control network; VAN = ventral attention network.
Figure 2
Figure 2
Group mean tau-PET data. (A) Mean distribution of abnormal tau (i.e. SUVR > 1.2) for each sample and diagnostic group. (B) Network-specific mean tau-PET SUVRs stratified by diagnostic groups. AD = Alzheimer’s disease; CN = cognitively normal.
Figure 3
Figure 3
Group mean functional connectivity and tau covariance matrices. AD = Alzheimer’s disease.
Figure 4
Figure 4
Associations between functional connectivity and tau covariance. Scatterplots showing the associations between tau and functional connectivity for CN-Aβ− (A), Alzheimer’s disease (AD) (B), and VCI groups (C). Scatterplots are based on group-average data, significance for all analyses was determined using linear regression repeated on 1000 bootstrapped samples on which group-average functional connectivity and tau covariance were iteratively determined. (DF) Force-directed graphs illustrating the association between functional network topology (node distance), tau-PET uptake (node size) and anatomical location (node symbol). Node proximity is defined based on the Fruchtermann-Reingold algorithm applied to group-average functional connectivity strength. DAN = dorsal attention network; DMN = default-mode network; FPCN = fronto-parietal control network; VAN = ventral attention network.
Figure 5
Figure 5
Functional connectivity as a predictor of tau-PET uptake. (AC) Relationship between tau-PET uptake of a seed ROI (x-axis) and the regression-derived association between its’ functional connectivity (FC) to target regions and tau-PET uptake in the respective target regions (y-axis). Positive y-values indicate that higher functional connectivity to target regions is associated with higher tau, while negative y-values indicate that higher functional connectivity to target regions is associated with lower tau. Example illustration of the results shown for regions of maximum tau (i.e. hotspots, DF) and regions of minimum tau (i.e. cold spot, GI). Scatterplots are based on group-average functional connectivity or tau-PET uptake, significance for all analyses was determined using linear regression repeated on 1000 bootstrapped samples on which group-average functional connectivity and group-average tau-PET uptake were iteratively determined. The anatomical location of tau hot and cold spots is shown in Supplementary Fig. 2. AD = Alzheimer’s disease; DAN = dorsal attention network; DMN = default-mode network; FPCN = fronto-parietal control network; VAN = ventral attention network.

References

    1. Abhinav K, Yeh FC, Pathak S, Suski V, Lacomis D, Friedlander RM, et al.Advanced diffusion MRI fiber tracking in neurosurgical and neurodegenerative disorders and neuroanatomical studies: a review. Biochim Biophys Acta 2014; 1842: 2286–97. - PubMed
    1. Ahmed Z, Cooper J, Murray TK, Garn K, McNaughton E, Clarke H, et al.A novel in vivo model of tau propagation with rapid and progressive neurofibrillary tangle pathology: the pattern of spread is determined by connectivity, not proximity. Acta Neuropathol 2014; 127: 667–83. - PMC - PubMed
    1. Arvanitakis Z, Capuano AW, Lamar M, Shah RC, Barnes LL, Bennett DA, et al.Late-life blood pressure association with cerebrovascular and Alzheimer disease pathology. Neurology 2018. - PMC - PubMed
    1. Bakker A, Krauss GL, Albert MS, Speck CL, Jones LR, Stark CE, et al.Reduction of hippocampal hyperactivity improves cognition in amnestic mild cognitive impairment. Neuron 2012; 74: 467–74. - PMC - PubMed
    1. Bejanin A, Schonhaut DR, La Joie R, Kramer JH, Baker SL, Sosa N, et al.Tau pathology and neurodegeneration contribute to cognitive impairment in Alzheimer’s disease. Brain 2017; 140: 3286–300. - PMC - PubMed

Publication types