. 2019 Feb 15;10(3):155.
doi: 10.1038/s41419-019-1381-z.

Smac mimetic suppresses tunicamycin-induced apoptosis via resolution of ER stress

Affiliations

Smac mimetic suppresses tunicamycin-induced apoptosis via resolution of ER stress

Behnaz Ahangarian Abhari et al. Cell Death Dis. .

Erratum in

Abstract

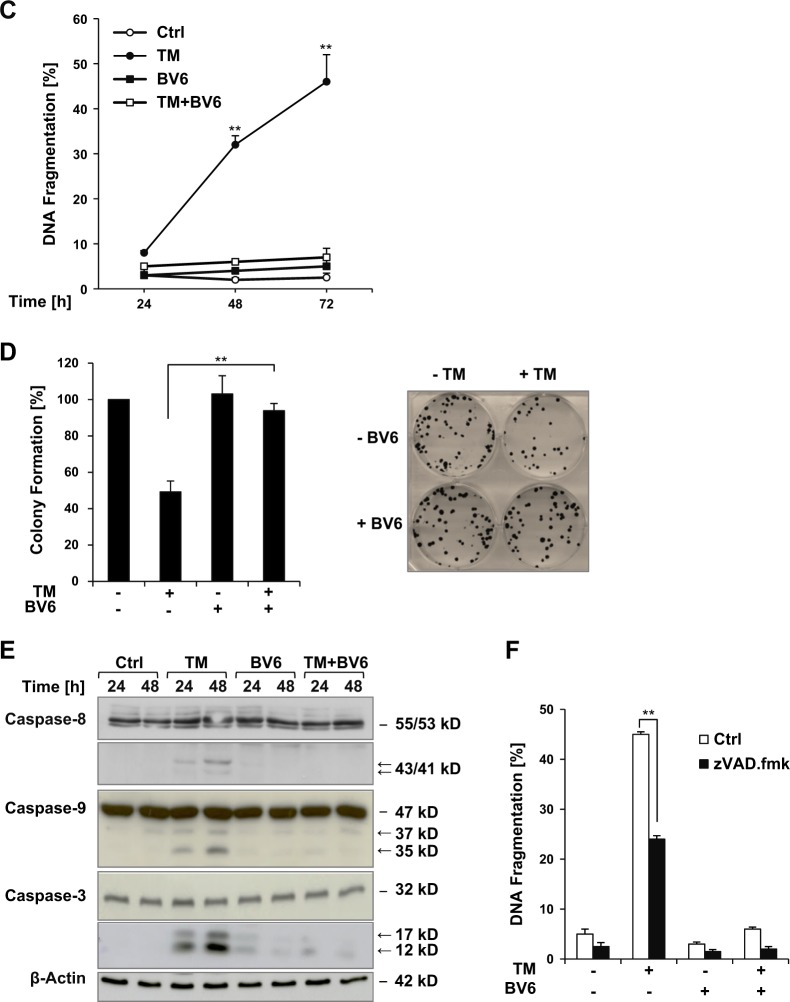
Since Inhibitor of Apoptosis (IAP) proteins have been implicated in cellular adaptation to endoplasmic reticulum (ER) stress, we investigated the regulation of ER stress-induced apoptosis by small-molecule second mitochondria-derived activator of caspase (Smac) mimetics that antagonize IAP proteins. Here, we discover that Smac mimetic suppresses tunicamycin (TM)-induced apoptosis via resolution of the unfolded protein response (UPR) and ER stress. Smac mimetics such as BV6 selectively inhibit apoptosis triggered by pharmacological or genetic inhibition of protein N-glycosylation using TM or knockdown of DPAGT1, the enzyme that catalyzes the first step of protein N-glycosylation. In contrast, BV6 does not rescue cell death induced by other typical ER stressors (i.e., thapsigargin (TG), dithiothreitol, brefeldin A, bortezomib, or 2-deoxyglucose). The protection from TM-triggered apoptosis is found for structurally different Smac mimetics and for genetic knockdown of cellular IAP (cIAP) proteins in several cancer types, underlining the broader relevance. Interestingly, lectin microarray profiling reveals that BV6 counteracts TM-imposed inhibition of protein glycosylation. BV6 consistently abolishes TM-stimulated accumulation of ER stress markers such as glucose-regulated protein 78 (GRP78) and C/EBP homologous protein (CHOP) and reduces protein kinase RNA-like ER kinase (PERK) phosphorylation and X box-binding protein 1 (XBP1) splicing upon TM treatment. BV6-stimulated activation of nuclear factor-κB (NF-κB) contributes to the resolution of ER stress, since NF-κB inhibition by overexpression of dominant-negative IκBα superrepressor counteracts the suppression of TM-stimulated transcriptional activation of CHOP and GRP78 by BV6. Thus, our study is the first to show that Smac mimetic protects from TM-triggered apoptosis by resolving the UPR and ER stress. This provides new insights into the regulation of cellular stress responses by Smac mimetics.


Conflict of interest statement

The authors declare that they have no conflict of interest.

Figures

Fig. 1
Fig. 1. Smac mimetics rescue neuroblastoma cells from TM-induced apoptosis and loss of clonogenic survival.
a, b Neuroblastoma cells were treated for 72 h with indicated concentrations of TM and/or BV6 (SH-EP, LAN-5, KELLY: 4 µM; CHP-212, NLF: 5 µM). Cell viability was determined by MTT assay and is expressed as the percentage of untreated controls (a). Apoptosis was determined by flow cytometric analysis of DNA fragmentation of PI-stained nuclei (b). c SH-EP cells were treated for indicated times with 0.4 µg/ml TM and/or 4 µM BV6. Apoptosis was determined by flow cytometric analysis of DNA fragmentation of PI-stained nuclei. d SH-EP cells were treated for 48 h with 0.4 µg/ml TM and/or 4 µM BV6 and colony formation was assessed as described in Materials and methods. The percentage of colony formation compared to untreated control (left panel) and one representative experiment (right panel) are shown. e SH-EP cells were treated for indicated times with 0.4 µg/ml TM and/or 4 µM BV6. Caspase activation was analyzed by Western blotting, cleavage fragments are indicated by arrows. β-Actin was used as a loading control. f SH-EP cells were treated for 72 h with 0.4 µg/ml TM and/or 4 µM BV6 in the presence or absence of 40 µM zVAD.fmk. Apoptosis was determined by flow cytometric analysis of DNA fragmentation of PI-stained nuclei. a–d, f Mean ± SEM of three independent experiments performed in triplicate are shown; *P < 0.05; **P < 0.001 comparing samples treated with the combination vs. those treated with TM alone (a–d) or comparing samples in the presence or absence of 40 µM zVAD.fmk (f). TM, tunicamycin; MTT, 3-(4,5-dimethylthiazol-2-yl)-2,5-diphenyltetrazolium bromide; PI, propidium iodide
Fig. 2
Fig. 2. Different Smac mimetics or cIAP1/2 silencing rescue cancer cells from TM-induced cell death.
a Glioblastoma (A172, U87MG, T98G) and rhabdomyosarcoma (RD, RMS13) cells were treated for 72 h with indicated concentrations of TM and/or BV6 (A172: 2 µM; T98G, RD, RMS13: 3 µM; U87MG: 4 µM). Apoptosis was determined by flow cytometric analysis of DNA fragmentation of PI-stained nuclei. Mean ± SEM of three independent experiments performed in triplicate are shown; *P < 0.05; **P < 0.01. b SH-EP cells were treated for 72 h with indicated concentrations of TM and/or different Smac mimetics (birinapant: 30 µM; IAP inhibitor 3: 40 µM; IAP inhibitor 2: 20 µM). Cell viability was determined by MTT assay and is expressed as the percentage of untreated controls. Mean ± SEM values of three independent experiments performed in triplicate are shown; **P < 0.01. c SH-EP cells were treated for 72 h with indicated concentrations of TM and/or different Smac mimetics (birinapant: 60 µM; IAP inhibitor 3: 60 µM; IAP inhibitor 2: 60 µM). Apoptosis was determined by flow cytometric analysis of DNA fragmentation of PI-stained nuclei. DNA fragmentation of PI-stained nuclei values was normalized to control values for each condition and fold increase in DNA fragmentation is shown with mean ± SEM values of three independent experiments performed in triplicate; *P < 0.05; **P < 0.01. d, e SH-EP cells were transiently transfected with siRNAs against cIAP1 and cIAP2 or with control siRNA. cIAP1 and cIAP2 expression was analyzed by Western blotting (d), cell death was measured by PI staining and flow cytometry after treatment with 0.1 µg/ml TM and 4 µM BV6 for 48 h (e). Mean ± SEM of three independent experiments performed in triplicate are shown; *P < 0.05. TM, tunicamycin; MTT, 3-(4,5-dimethylthiazol-2-yl)-2,5-diphenyltetrazolium bromide; PI, propidium iodide; siRNA, small interfering RNA; cIAP, cellular inhibitor of apoptosis
Fig. 3
Fig. 3. BV6 selectively protects from ER stress-induced apoptosis caused by inhibition of N-linked protein glycosylation.
a, b SH-EP cells were treated for 72 h with indicated concentrations of ER stress inducers and/or 5 µM BV6. Cell viability was determined by MTT assay and is expressed as the percentage of untreated controls (a). Cell death was determined by fluorescence-based microscope analysis of PI uptake using Hoechst 33342 and PI double-staining (b). Mean ± SEM values of three independent experiments performed in triplicate are shown; *P < 0.05; **P < 0.001 comparing samples treated with the combination vs. those treated with ER stress inducers alone. c–e SH-EP cells were transiently transfected with siRNA sequence targeting DPAGT1 (siDPAGT1) or control siRNA (siCtrl). DPAGT1 mRNA levels were analyzed by quantitative RT-PCR and fold increase in DPAGT1 mRNA levels is shown with mean ± SEM values of three independent experiments; **P < 0.001 (c). DPAGT1 protein levels were assessed by Western blotting (d). Cells were treated with 0.05 µg/ml TM and/or 5 µM BV6 and apoptosis was determined after treatment for 72 h by flow cytometric analysis of DNA fragmentation of PI-stained nuclei (e). ER, endoplasmic reticulum; TM, tunicamycin; MTT, 3-(4,5-dimethylthiazol-2-yl)-2,5-diphenyltetrazolium bromide; PI, propidium iodide; siRNA, small interfering RNA; mRNA, messenger RNA; RT-PCR, reverse transcription-PCR
Fig. 4
Fig. 4. BV6 counteracts TM-induced inhibition of protein glycosylation.
a SH-EP cells were cotreated for 72 h with 0.4 µg/ml TM and/or 4 µM BV6 or were treated for 72 h with 0.4 µg/ml TM and 4 µM BV6 were added at indicated time points. Apoptosis was determined by flow cytometric analysis of DNA fragmentation of PI-stained nuclei. Mean ± SEM of three independent experiments performed in triplicate is shown; *P < 0.05, **P < 0.001. b SH-EP cells were treated with 0.4 µg/ml TM and/or 4 µM BV6 for 3 h. Unsupervised hierarchical clustering of lectin microarray-binding intensities with membrane glycoprotein extracts from untreated (control), BV6-treated, TM/BV6-treated, and TM-treated cells. Averages of individual technical replicates were scaled (0–53,000RFU) and clustering was based on Euclidean distance and complete linkage method. ER, endoplasmic reticulum; TM, tunicamycin; PI, propidium iodide
Fig. 5
Fig. 5. BV6 resolves the TM-induced UPR.
a SH-EP cells were treated with 0.4 µg/ml TM and/or 4 µM BV6 for indicated time points and expression levels of CHOP and GRP78 were evaluated by Western blotting. b, c SH-EP cells were transiently transfected with siRNA sequence targeting DPAGT1 (siDPAGT1) or control siRNA (siCtrl) and treated with 0.05 µg/ml TM and/or 5 µM BV6. CHOP (B) and GRP78 (C) mRNA levels were analyzed after 4 h of treatment by quantitative RT-PCR and fold increase in mRNA levels are shown. Mean ± SEM values of three independent experiments are shown; **P < 0.001
Fig. 6
Fig. 6. NF-κB contributes to BV6-mediated suppression of TM-stimulated UPR.
a, b SH-EP cells stably expressing IκBα-SR or vector control were transfected with reporter firefly luciferase and Renilla luciferase vectors. Promoter activities of CHOP (a) or GRP78 (b) were measured 12 h after treatment with 0.4 µg/ml TM and/or 4 µM BV6. c, d SH-EP cells stably expressing IκBα-SR or vector control were treated for 12 h with 0.4 µg/ml TM and/or 4 µM BV6. Expression levels of CHOP (c) or GRP78 (d) were determined by quantitative RT-PCR and fold increase is shown. e SH-EP cells stably expressing IκBα-SR or vector control were treated for indicated time points with 0.4 µg/ml TM and/or 4 µM BV6. Expression levels of CHOP and GRP78 were analyzed by Western blotting. a–d Mean ± SEM of three independent experiments performed in triplicate are shown; *P < 0.05; **P < 0.001. UPR, unfolded protein response; GRP78, glucose-regulated protein 78; mRNA, messenger RNA; ER, endoplasmic reticulum; siRNA, small interfering RNA; TM, tunicamycin; PI, propidium iodide; RT-PCR, reverse transcription-PCR
Fig. 7
Fig. 7. BV6 suppresses TM-triggered ER stress response pathways.
a SH-EP cells were treated for 3 h with 0.4 µg/ml TM and/or 4 µM BV6. The splicing of XBP1 mRNA was analyzed by RT-PCR using XBP1 primers that detect both unspliced (289 bp) and spliced (263 bp) isoforms. b SH-EP cells were treated for 9 h with 0.4 µg/ml TM and/or 4 µM BV6, treatment with 10 µM TG was used as a positive control for phosphorylation of eIF2α. Expression of phospho-PERK (indicated by upward band shift), phospho-eIF2α and eIF2α was analyzed by Western blotting; GAPDH served as a loading control. ER, endoplasmic reticulum; TM, tunicamycin; PI, propidium iodide; RT-PCR, reverse transcription-PCR; PERK, protein kinase RNA-like ER kinase; GAPDH, glyceraldehyde-3-phosphate dehydrogenase

References

    1. Lai E, Teodoro T, Volchuk A. Endoplasmic reticulum stress: signaling the unfolded protein response. Physiology (Bethesda). 2007;22:193–201. - PubMed
    1. Ron D, Walter P. Signal integration in the endoplasmic reticulum unfolded protein response. Nat. Rev. Mol. Cell. Biol. 2007;8:519–529. doi: 10.1038/nrm2199. - DOI - PubMed
    1. Kim I, Xu W, Reed JC. Cell death and endoplasmic reticulum stress: disease relevance and therapeutic opportunities. Nat. Rev. Drug Discov. 2008;7:1013–1030. doi: 10.1038/nrd2755. - DOI - PubMed
    1. Fulda S, Vucic D. Targeting IAP proteins for therapeutic intervention in cancer. Nat. Rev. Drug Discov. 2012;11:109–124. doi: 10.1038/nrd3627. - DOI - PubMed
    1. Varfolomeev E, et al. IAP antagonists induce autoubiquitination of c-IAPs, NF-kappaB activation, and TNFalpha-dependent apoptosis. Cell. 2007;131:669–681. doi: 10.1016/j.cell.2007.10.030. - DOI - PubMed

Publication types

MeSH terms