

doi: 10.1038/s41467-019-08548-9.
Recessive mutations in muscle-specific isoforms of FXR1 cause congenital multi-minicore myopathy
Affiliations
- PMID: 30770808
- PMCID: PMC6377633
- DOI: 10.1038/s41467-019-08548-9
Item in Clipboard
Recessive mutations in muscle-specific isoforms of FXR1 cause congenital multi-minicore myopathy
Nat Commun.
.
Abstract
FXR1 is an alternatively spliced gene that encodes RNA binding proteins (FXR1P) involved in muscle development. In contrast to other tissues, cardiac and skeletal muscle express two FXR1P isoforms that incorporate an additional exon-15. We report that recessive mutations in this particular exon of FXR1 cause congenital multi-minicore myopathy in humans and mice. Additionally, we show that while Myf5-dependent depletion of all FXR1P isoforms is neonatal lethal, mice carrying mutations in exon-15 display non-lethal myopathies which vary in severity depending on the specific effect of each mutation on the protein.
Conflict of interest statement
The authors declare no competing interests.
Figures
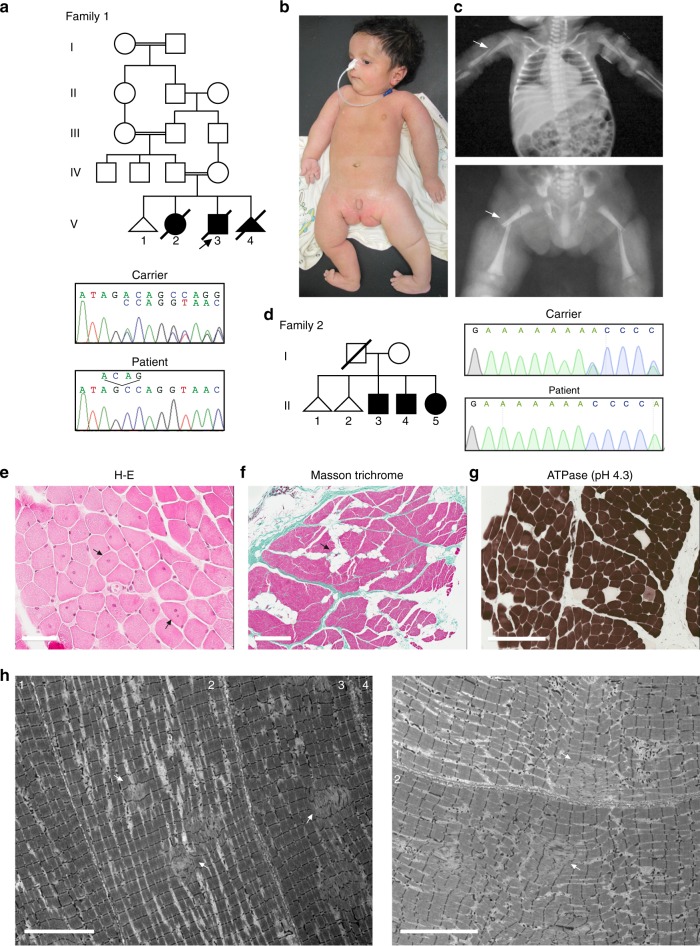
Clinical features and mutations. a Pedigree of Family 1 showing the proband (arrow), similarly affected older female sibling and affected fetus. DNA-sequencing chromatograms demonstrate a homozygous four nucleotide deletion at the 3′-end of FXR1 exon-15 in the proband, which is in the heterozygous state in his mother (carrier). Carrier chromatogram shows normal (top) and mutant (underneath) nucleotide sequences. b Proband of family 1 at the age of 2.5 months with inserted Ryle tube for feeding, short neck, short hands and digits, lateral rotation of right upper and lower limbs and medial rotation of left upper and lower limbs due to severe hypotonia. The picture also shows bilateral low inserted thumbs with dorsi-flexion of both feet, no obvious demarcation of large joints with transverse crease on the left knee and ankles and genital hypoplasia. c X-rays (AP view) showing bilateral mid fractures of humeri (upper panel, arrow) and femora (lower panel, arrow). d Pedigree of family 2 and DNA-sequencing chromatograms corresponding to the 5′-end of FXR1 exon-15 of the mother (carrier) and one of the affected siblings showing a single adenine deletion from a run of eight-adenines in the homozygous state in the patient. The father was not available for carrier testing. Only nucleotide sequence of the wt allele is written on the chromatogram of the mother. e–h Representative photomicrographs of H-E staining. Scale bar 60 µm (e), Masson trichrome staining. Scale bar 500 µm (f), ATPase pH4.3 histochemistry. Scale bar 200 µm (g), and TEM. Scale bar 10 µm (h) from a right triceps biopsy of individual II-4 of family 2. Arrows indicate internalized nuclei, fatty infiltration, and areas of Z-streaming and minicores in e, f and h, respectively. Different fibers in TEM images are numbered
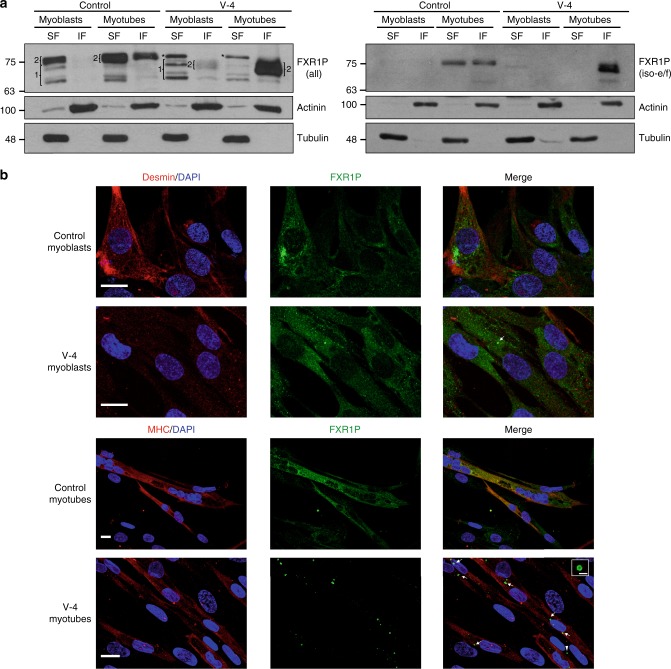
Expression and localization of FXR1P isoforms in family 1. a Representative anti-FXR1P immunoblots of soluble (SF) and insoluble (IF) fractions of protein extracts from control and V-4 myoblasts and myotubes, n = 5. An antibody against all FXR1P isoforms (Proteintech) and another one specific for iso-e/f (#27-15) were used in left and right panels, respectively. Numbered brackets on left panel designate P70-80 FXR1P isoforms (1), and P82,84 isoforms (2). Asterisks indicate a non-specific band. α-actinin and α-tubulin were used as loading controls. b Anti-FXR1P immunofluorescence showing subcellular distribution of FXR1P in control and V-4 myoblasts and myotubes, n = 5. Scale bar 15 µm. Arrows in V-4 myoblasts and myotubes point to ring-shaped granular accumulations of mutant P82,84 isoforms. The granule magnified in V-4 myotubes is indicated with an arrowhead (scale bar 2 µm). Desmin and MHC were used as myogenic markers with MHC being an indicator of myotube differentiation. Nuclei are stained with DAPI
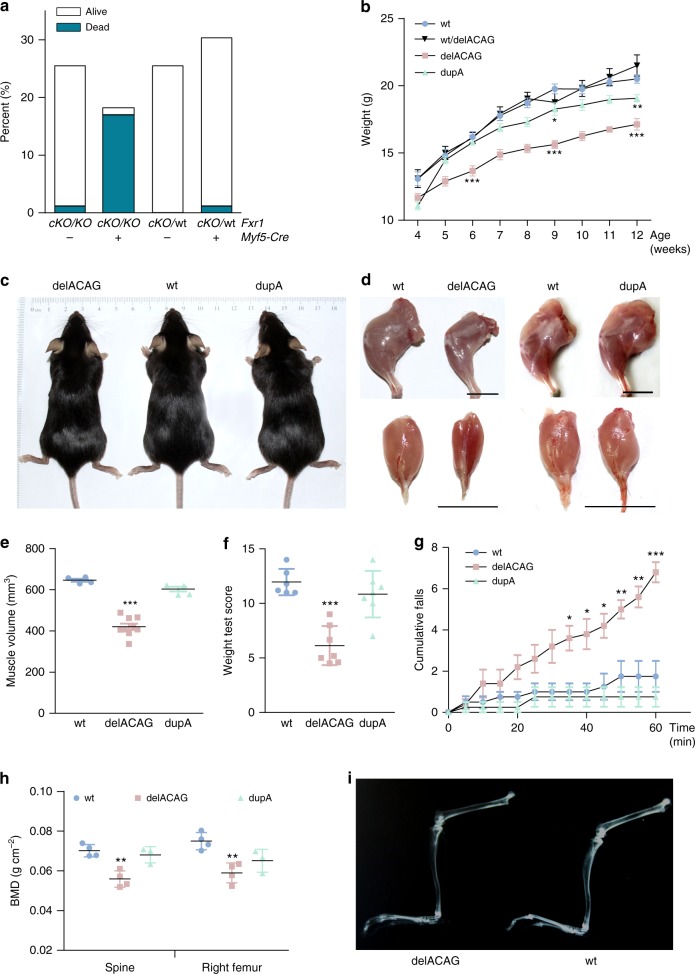
Phenotype of mice with different Fxr1 mutations. a Percentage (%) of neonatal lethality at P0-1 in offspring (n = 82) from crosses between Myf5-Cre+/−;Fxr1+/ko males and Fxr1cko/cko females. Genotypes for Fxr1 and Myf5-Cre are indicated in the X-axis. Presence or absence of Myf5-Cre is indicated with + and – symbols. b Growth chart of homozygous delACAG and dupA mice compared to wild type controls (wt) and wt/delACAG heterozygotes. Female mice were weighed weekly after weaning from week 4 to 12. n = 16(wt), 13(wt/delACAG heterozygotes), 12(delACAG), 9(dupA). Data are mean ± s.e.m. followed by two-tailed unpaired Student’s t-test. c Representative image of three months old delACAG, wt and dupA female mice. d Representative images of left hindlimb (top panel) and gastrocnemius (bottom panel) from delACAG and dupA mutants compared to their respective wt littermates (3-month old female mice). Scale bar 1 cm. e Muscle volume corresponding to a segment of hindlimbs determined by MRI (14 weeks-old female mice), n = 4(wt), 9(delACAG), 4(dupA). Data are mean ± s.d. followed by one-way ANOVA (***) with Tukey post-hoc test. f Score values for weight test (14 weeks-old female mice, n = 6(wt), 7(delACAG), 7(dupA)). Data are mean ± s.d. followed by one-way ANOVA (***) with Tukey post-hoc test. g Cumulative number of falls during rotarod endurance test (14 weeks-old female mice), n = 4(wt), 5(delACAG), 4(dupA). Data are mean ± s.e.m. followed by one-way ANOVA (**) with Tukey post-hoc test. h BMD calculated by DXA at the spine and the right femur of 4 months old female mice, n = 4(wt), 4(delACAG), 3(dupA). Data are mean ± s.d. followed by one-way ANOVA (**) with Tukey post-hoc test. i Representative X-Ray image corresponding to dissected left hindlimbs from delACAG and wt littermates (4 months-old female mice), n = 4(wt), 1(wt/delACAG), 8(delACAG), 4(dupA)
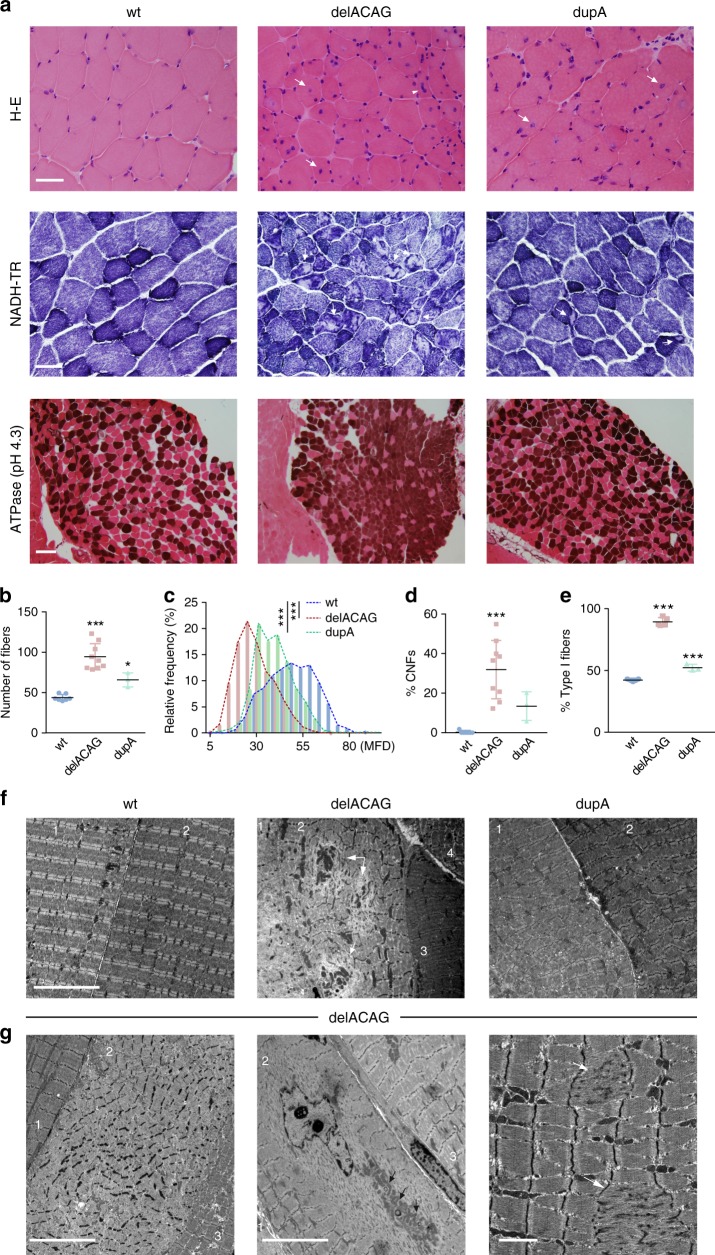
Multicore myopathy in mice carrying exon-15 mutations. a Top panel: H-E staining of vastus lateralis cryosections. Arrows designate central nulei and the arrowhead in delACAG indicates three centralized nuclei. Middle panel: NADH-TR histochemistry of vastus cryosections showing multiple areas with no enzymatic activity (cores) in delACAG mice and very few in dupA mice. Arrows depict examples of cores. For both panels: n = 7(wt), 9(delACAG), 3(dupA) and scale bars 50 µm. Lower panel: ATPase (pH 4.3) histochemistry in whole soleus cryosections revealing increased type 1 fibers in both mutants, n = 5(wt), 6(delACAG), 3(dupA). Scale bar 0.5 mm. b Quantification of fiber density (number of fibers/microscope field of view). Graph represents mean ± s.d. c Minimal Feret’s diameter (MFD, µm) showing relative frequency (%) of different fiber sizes with respect to the total number of fibers analyzed. Differences in mean MFD between wt and homozygous mutants were statistically significant (wt: 49.8 µm ± 12.9 s.d., delACAG: 29.1 µm ± 9.9 s.d., dupA: 38.3 µm ± 9.7 s.d.). d Percentage of fibers with central nuclei (% CNFs) in wt, delACAG and dupA mice. Graph corresponds to mean ± s.d. For b–d H-E cryosections of vastus lateralis were used and a total number of n = 455(wt), 1726(delACAG), 465(dupA) fibers were analyzed from 7(wt), 9(delACAG) and 3(dupA) mice. e Percentage (%) of type I fibers calculated in soleus sections expressed as mean ± s.d. n = 5(wt), 5(delACAG), 3(dupA) mice. One-way ANOVA (***) with Tukey post-hoc test was used in b and e and Kruskal-Wallis (***) with Dunn’s multiple comparisons test in c and d. f Representative TEM images of gastrocnemius from wt, delACAG and dupA mice, n = 3(wt), 4(delACAG), 2(dupA) mice. Scale bar 10 µm. Numbers identify different fibers. Note the variable disorganization of delACAG fibers. Arrows indicate cores. g TEM images of gastrocnemius showing different defects in delACAG fibers including: large cores (left and middle image. Scale bars 10 µm), central nuclei and abnormal mitochondrial accumulations (middle image), and Z-line abnormalities including Z-streaming (arrows, right image. Scale bar 2 µm). Arrows in the central picture point to ring-shaped granules shown in Fig. 7a
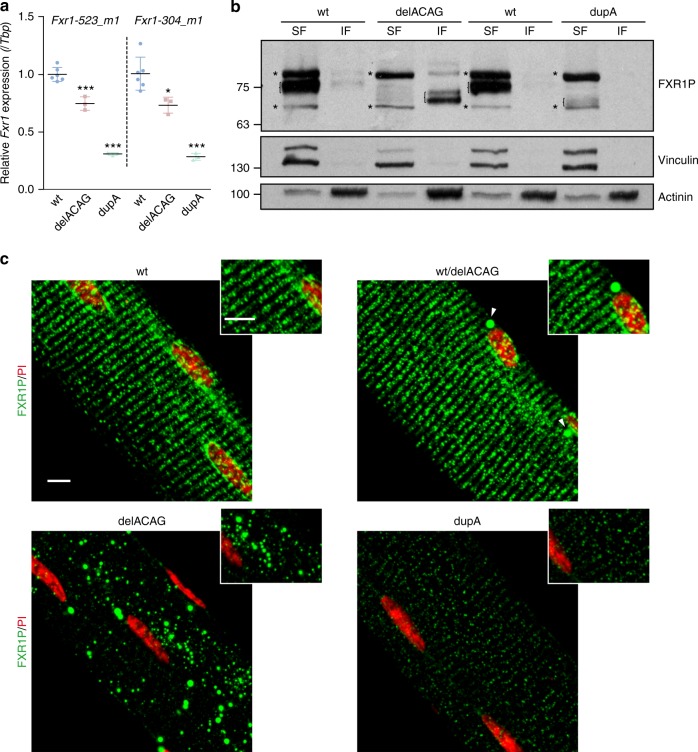
Expression and subcellular localization of P82,84 isoforms in exon-15 mice. a Relative Fxr1 mRNA quantification in gastrocnemius of 2.5-months old mice by qRT-PCR using two different TaqMan probes: Fxr1-523_m1 (exons 2-3; Mm00484523_m1) and Fxr1-304_m1 (exons 14-15; Mm01286304_m1). Values are normalized to Tbp mRNA levels and represented as fold change of the mean value of wt mice. n = 6 (wt), 3(delACAG), 3(dupA). Data are mean ± s.d. followed by one-way ANOVA (***) with Tukey post-hoc test. b Representative FXR1P immunoblot of protein extracts from gastrocnemius (soluble (SF) and insoluble (IF) fractions) of delACAG and dupA mice and corresponding wt littermates. Vinculin and α-actinin were used as loading controls (2–3 months old mice, n = 4). Brackets denote isoforms e and f and non-specific bands are labeled with asterisks. c Maximum Z-project and magnification of confocal anti-FXR1P immunofluorescence images (green) in isolated EDL fibers. n = 8(wt), 3(wt/delACAG), 8(delACAG), 6(dupA). Scale bars 5 µm. FXR1P isoforms are localized in a striated pattern except in delACAG fibers where are found predominantly in granules. Heterozygous wt/delACAG fibers contain a small number of granules (arrowheads) and the fluorescent intensity of FXR1P is reduced in dupA mice. Nuclei are labeled with propidium iodide (PI, red)
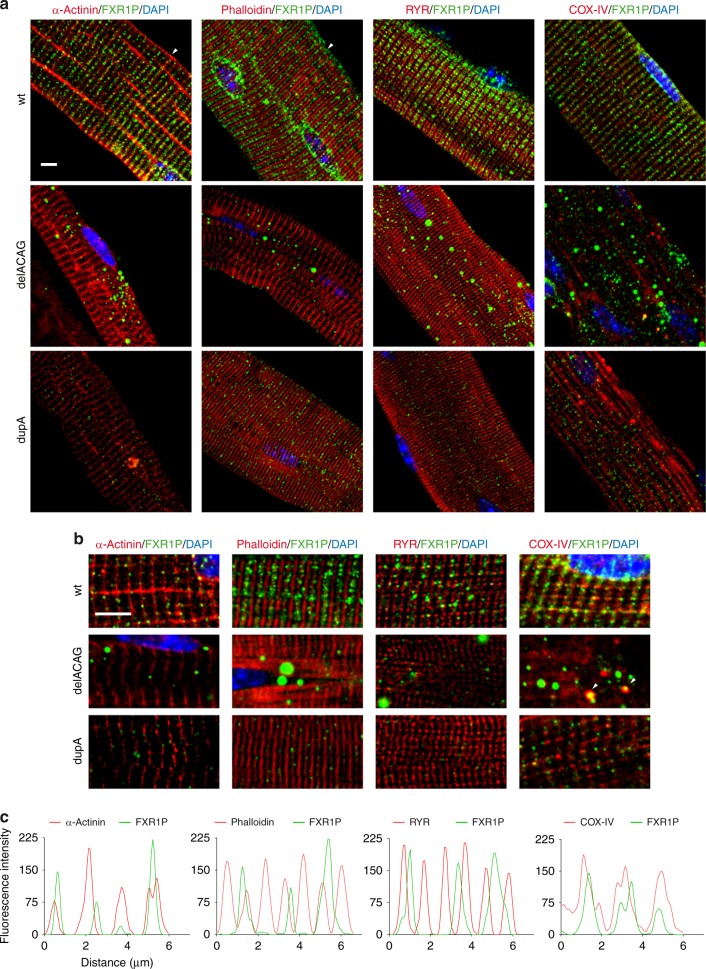
Co-localization analysis of P82,84 isoforms in EDL fibers. a, b Maximum Z-projects (a) and single slice from Z-stack (b) corresponding to confocal overlay images of double-immunofluorescence labeling for FXR1P (green) and α-actinin, phalloidin, RYR and COX-IV (red) in isolated EDL fibers from different mice. Scale bars 5 µm. Arrowheads in panel a point to Z-lines, and in panel b (delACAG COX-IV/FXR1P image) indicate co-localization of FXR1P granules and mitochondria. Nuclei are stained with DAPI (blue). c Representative RGB intensity profile along a line corresponding to a Z-stack slice of a wt EDL fiber showing co-localization results between FXR1P (green) and sarcomeric markers (red). FXR1P is adjacent to Z-lines and mitochondria. Experiments were performed in n = 3 mice except for RYR (n = 2 mice). For each mouse several fibers were analyzed in each experiment
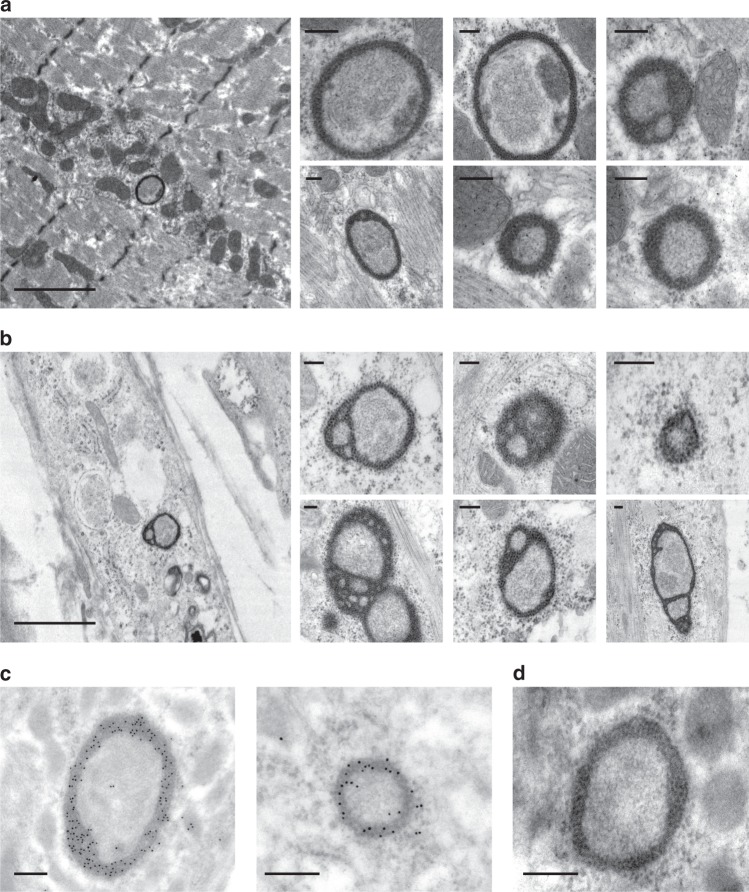
Ultrastructural evaluation of delACAG granules. a Representative TEM images of granules of different size exclusively observed in gastrocnemius fibers from delACAG mice. Granules are often located in close proximity to mitochondria. n = 3(wt), 4(delACAG), 2(dupA) mice. Scale bars 2 µm (left panel), 200 nm (rest of panels). b Representative TEM images of ring-shaped granules from V-4 differentiated myotubes. These structures were not present in control differentiated myotubes. Multiple myotubes were analyzed. Scale bars 2 µm (left panel), 200 nm (rest of panels). c Anti-FXR1P immunogold labeling of ultrathin sections from gastrocnemius of delACAG mice showing localization of the mutant protein in the outer electrodense layer of delACAG granules. n = 3. Scale bar 200 nm. d No-primary antibody control demonstrating no immunogold labeling in granules from delACAG mice. Scale bar 200 nm
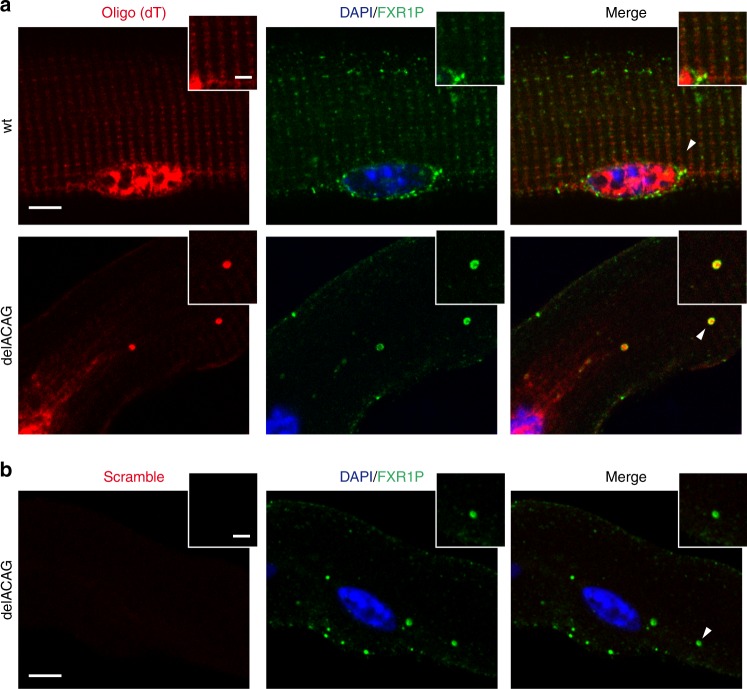
DelACAG granules incorporate mRNA. a, b Confocal images (single Z-slice) of RNA-FISH on EDL isolated myofibers (wt and delACAG) using Cy3-oligo(dT) (a) or a Cy3-scramble probe (b) in combination with anti-FXR1P immunostaining proving positive oligo (dT) signal in delACAG granules (n = 7). Scale bar 5 µm. Higher magnifications correspond to the areas designated by arrowheads. Scale bar 2 µm. Nuclei are stained with DAPI
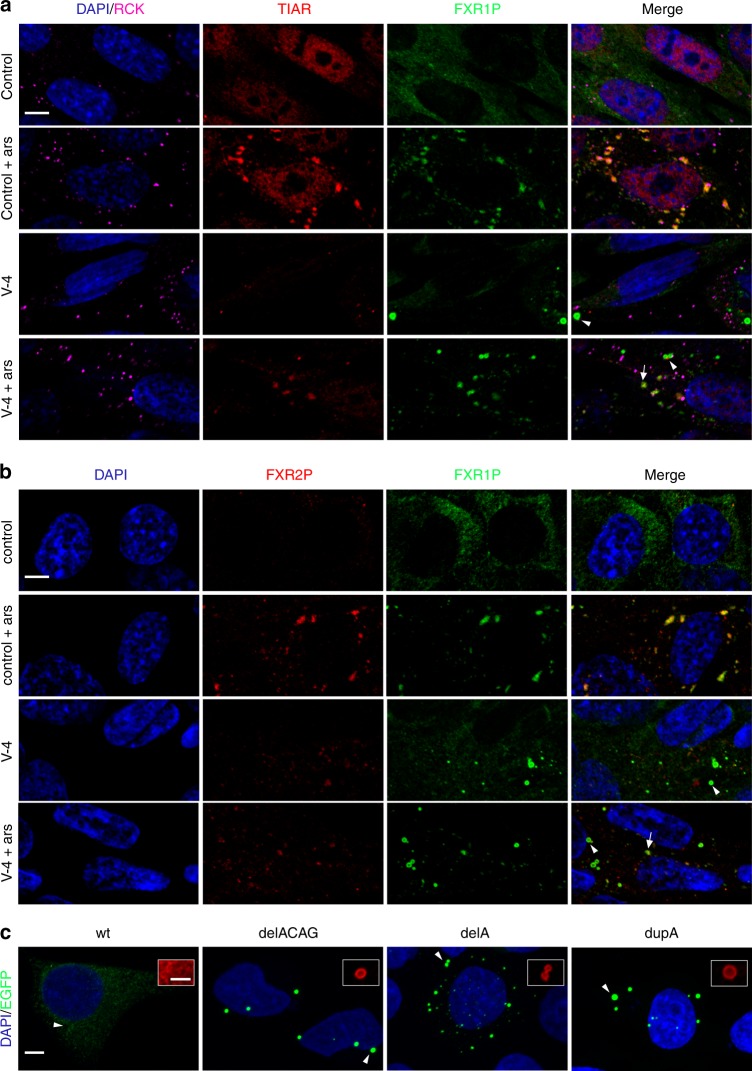
DelACAG granules do not recruit SG components. a, b Representative images of confocal microscopy (single Z-slice) from one-day differentiated V-4 or control myoblasts treated with or without ARS and co-immunostained for FXR1P and TIAR/RCK or FXR2P. Strong co-localization of FXR1P with TIAR and FXR2P occurs in amorphous SG granules (arrows), but not in ring-shaped delACAG granules (arrowheads). n = 4(TIAR/RCK), n = 3(FXR2P). Scale bars 5 µm. c Confocal (Z-project) representative images of transfected HeLa cells with EGFP:FXR1P-iso-e fusion proteins (Supplementary Fig. 10a) illustrating assembly of the three mutant proteins (delACAG, delA, and dupA) into ring-shaped delACAG-like granules. Equivalent images of transfected HeLa cells labeled with anti-FXR1P are in Supplementary Fig. 10c. Scale bar 5 µm. Higher magnifications correspond to anti-FXR1P staining of the areas designated by arrowheads. n = 3. Scale bar 2 µm. In all panels nuclei are stained with DAPI
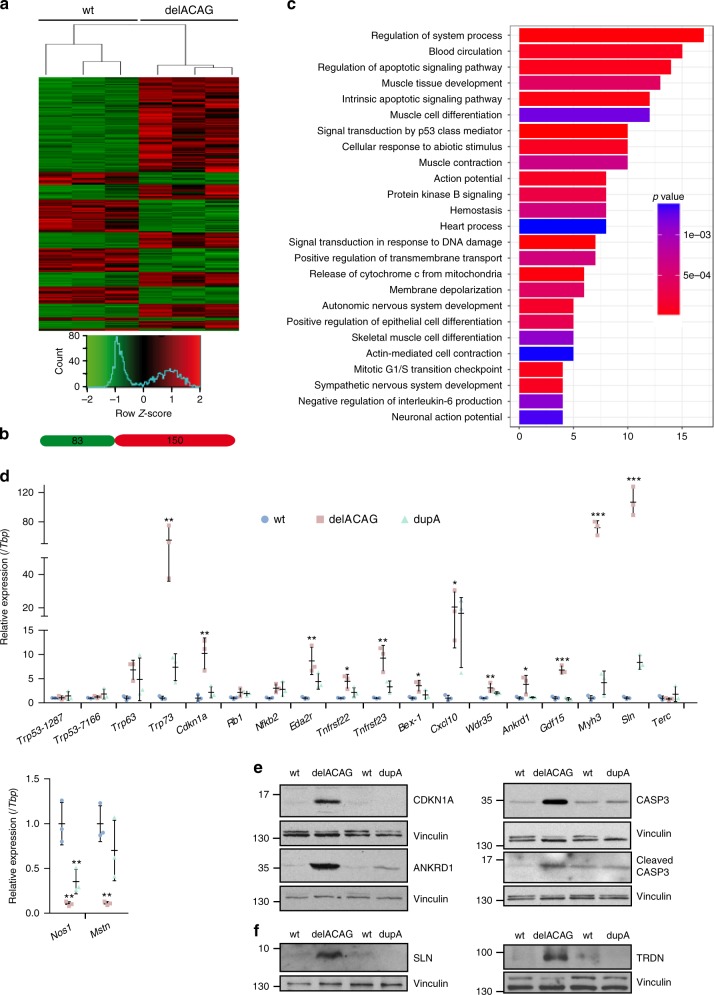
Gene expression profiling in skeletal muscle from delACAG mutants. a Hierarchical clustering and heatmap visualization of RNA-seq data (selected DEGs) resulting from analysis of skeletal muscle RNA samples isolated from 3 wt and 3 delACAG P15 mice. b Number of genes upregulated (red) and downregulated (green) among selected 233 DEGs. c Gene Ontology (GO) term enrichment analysis showing pathways and biological processes over-represented in selected DEGs. Gene count is shown on the X-axis (Supplementary Table 3a). d Relative expression analysis of the indicated genes by qRT-PCR using TaqMan expression assays in gastrocnemius RNA of 1.5-months old mice. Values are normalized to Tbp expression and are represented as fold change of the mean value of wt expression. Graphs are mean ± s.d. followed by one-way ANOVA with Tukey post-hoc test. n = 3. e Representative immunoblots showing protein levels of CDKN1A, ANKRD1, CASP3 and cleaved CASP3 in gastrocnemius from 2–3-months old delACAG and dupA mice and corresponding wt littermates. f Representative immunoblots for SLN and TRDN in protein extracts from the soleus (SLN) or gastrocnemius (TRDN) from delACAG, dupA and wt mice demonstrating increased expression of both proteins in delACAG mutants.Vinculin served as loading control in e and f. n = 6(wt), 3(delACAG), 3(dupA) mice for all proteins excepting SLN (n = 7(wt), 4(delACAG), 3(dupA) mice)
References
Publication types
MeSH terms
Substances
Supplementary concepts
Grants and funding
LinkOut - more resources
Full Text Sources
Other Literature Sources
Molecular Biology Databases
