. 2019 Feb 15;10(1):772.
doi: 10.1038/s41467-019-08783-0.

An EDS1 heterodimer signalling surface enforces timely reprogramming of immunity genes in Arabidopsis

Affiliations

An EDS1 heterodimer signalling surface enforces timely reprogramming of immunity genes in Arabidopsis

Deepak D Bhandari et al. Nat Commun. .

Abstract

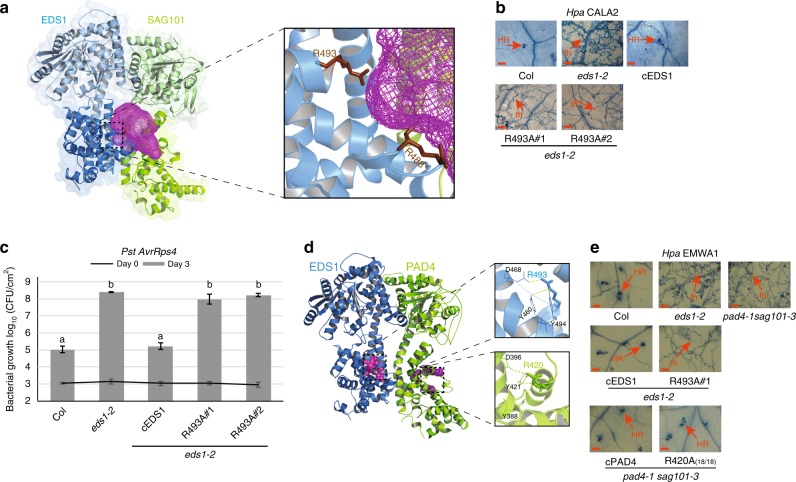
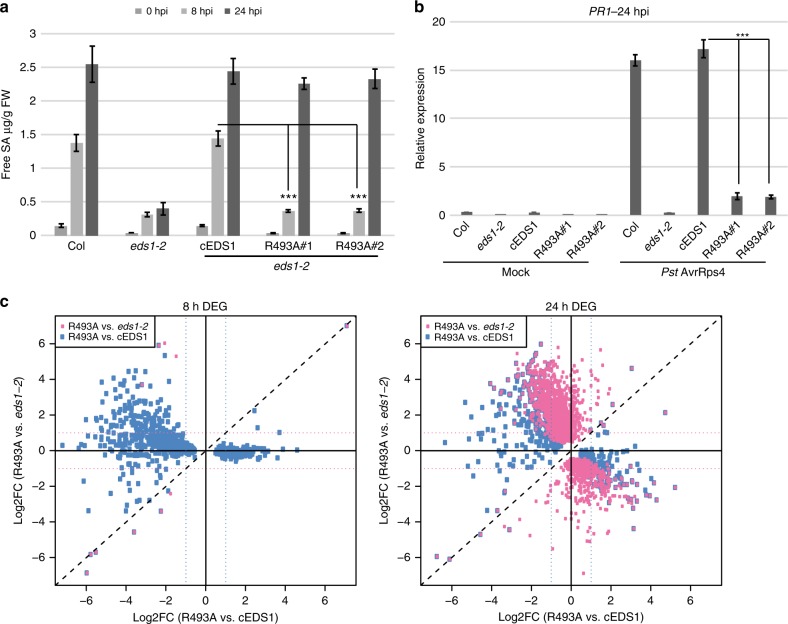
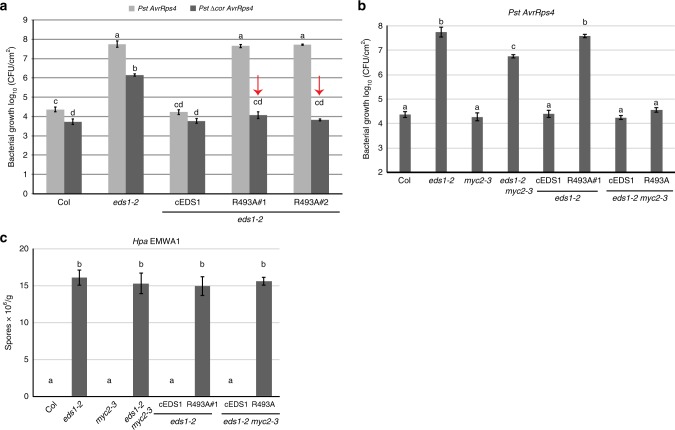
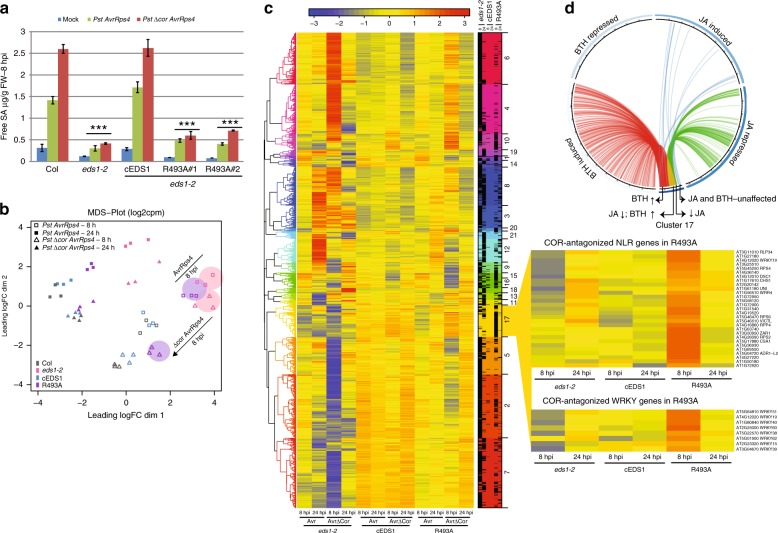
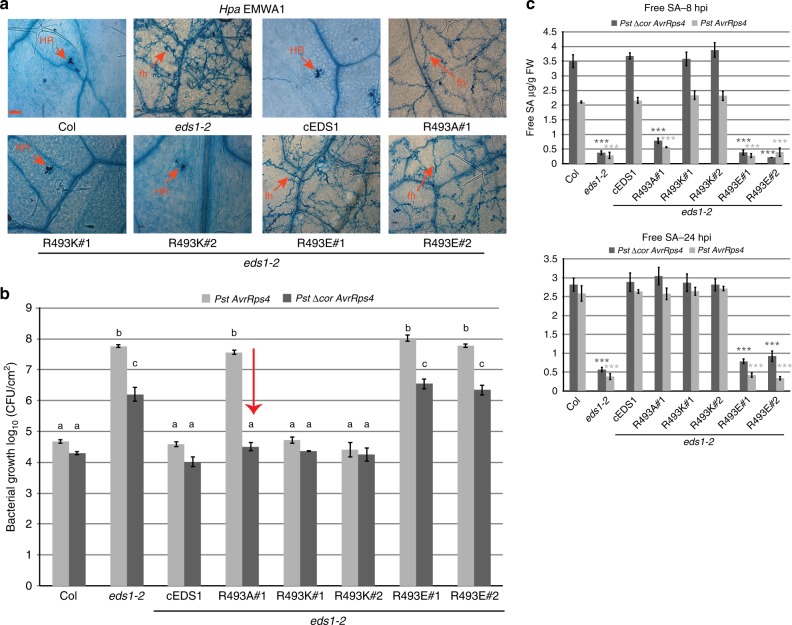
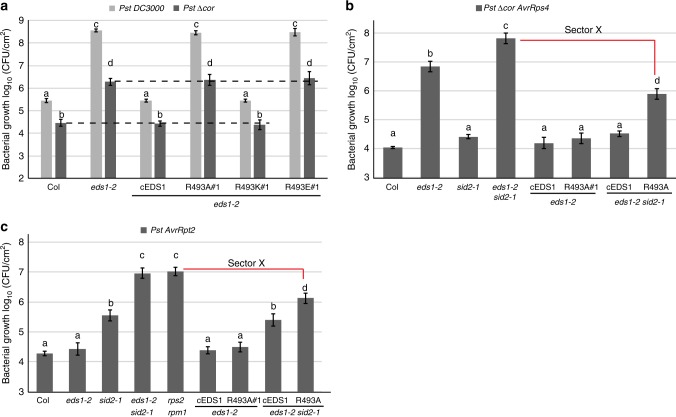
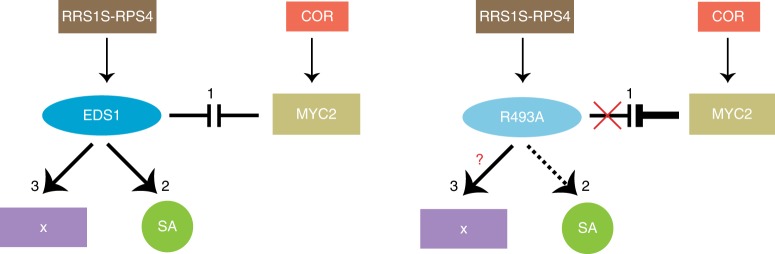
Plant intracellular NLR receptors recognise pathogen interference to trigger immunity but how NLRs signal is not known. Enhanced disease susceptibility1 (EDS1) heterodimers are recruited by Toll-interleukin1-receptor domain NLRs (TNLs) to transcriptionally mobilise resistance pathways. By interrogating the Arabidopsis EDS1 ɑ-helical EP-domain we identify positively charged residues lining a cavity that are essential for TNL immunity signalling, beyond heterodimer formation. Mutating a single, conserved surface arginine (R493) disables TNL immunity to an oomycete pathogen and to bacteria producing the virulence factor, coronatine. Plants expressing a weakly active EDS1R493A variant have delayed transcriptional reprogramming, with severe consequences for resistance and countering bacterial coronatine repression of early immunity genes. The same EP-domain surface is utilised by a non-TNL receptor RPS2 for bacterial immunity, indicating that the EDS1 EP-domain signals in resistance conferred by different NLR receptor types. These data provide a unique structural insight to early downstream signalling in NLR receptor immunity.


Conflict of interest statement

The authors declare no competing interests.

Figures

Fig. 1
Fig. 1
Residues lining the EDS1 heterodimer cavity mediate immunity signalling. a Crystal structure of EDS1 (blue)–SAG101 (green) showing heterodimer formation chiefly driven by the partner lipase-like domains (light tones) and producing a cavity (magenta mesh) formed by the EP-domains. In the zoom-out, two conserved EDS1 arginine residues lining the cavity are depicted as sticks (brown). b RPP2 resistance phenotypes of 2-week-old control and transgenic lines expressing YFP-cEDS1 or R493A. Hpa EMWA1 infected leaves were stained with trypan blue at 5 dpi. Scale bar represents 100 μm. Images are representative of 24 leaves from two independent experiments. HR, hypersensitive response; fh, pathogen free hyphae. c. Four-week old Arabidopsis plants of the indicated genotypes were infiltrated with Pst AvrRps4 (OD600–0.0005) and bacterial titres determined at 0 and 3 dpi. Bars represent mean of four biological replicates ± SE. Differences between genotypes were determined using ANOVA (Tukey’s HSD, p < 0.005). Similar results were obtained in three independent experiments. d Homology model of EDS1 (blue)–PAD4 (green). Conserved residues in the EP-domains of EDS1 (magenta) and PAD4 (purple) are represented as spheres. EDS1 residues line the heterodimer cavity while PAD4 residues are not part of the cavity. A zoom-out of the sphere-represented residues shows ionic and hydrogen bonds formed by EDS1R493 and equivalent arginine in PAD4R420 with neighbouring residues. e RPP4 resistance phenotypes of 2-week-old control and homozygous transgenic lines expressing wild-type EDS1, PAD4 and mutated arginine variants. Hpa EMWA1 infected leaves were stained with trypan blue at 5 dpi. Scale bar represents 100 μm. The PAD4 R420A image is representative of 18 independent transgenic (T1) plants. HR hypersensitive response, fh pathogen free hyphae
Fig. 2
Fig. 2
EDS1R493A delays TNL transcriptional reprogramming. a Four-week-old plants were infiltrated with Pst AvrRps4 (OD600–0.005) and free SA was quantified at 0, 8 and 24 hpi. Bars represent means ± SE of four biological replicates. Differences between genotypes were analysed using t-test (Bonferroni corrected, p < 0.05). Similar results were obtained in two independent experiments. b Four-week-old plants were infiltrated with 10 mM MgCl2 (mock) or Pst AvrRps4 (OD600–0.005), and leaf samples collected at 24 hpi. PR1 transcripts were measured using qRT-PCR and normalised to GapDH. Bars represent means ± SE of three biological replicates. Differences between genotypes were analysed using t-test (Bonferroni corrected, p < 0.05). c A 2-D scatter plot comparing R493A#1 vs. eds1-2 and R493A#1 vs. cEDS1 at 8 and 24 hpi with Pst AvrRps4. Plots depict differentially expressed genes (DEG) between R493A vs. eds1-2 (pink dots) and R493A vs. cEDS1 (blue dots). DEG represented were filtered with a |log2 FC| ≥ 1, FDR ≤ 0.05
Fig. 3
Fig. 3
EDS1R493A fails to antagonise bacterial COR-stimulated MYC2 in TNL immunity. a Four-week-old Arabidopsis plants of the indicated genotypes were infiltrated with Pst AvrRps4 or Pst ∆Cor AvrRps4 (OD600–0.0005). Bacterial titres were determined at 0 and 3 dpi. No significant difference was observed between lines and treatments at 0 dpi. Bars represent mean of four biological replicates ± SE. Differences between genotypes were analysed using ANOVA (Tukey’s HSD, p-value < 0.005). Similar results were obtained in three independent experiments. b Four-week-old Arabidopsis plants of the indicated genotypes were infiltrated with Pst AvrRps4 (OD600– 0.0005). Bacterial titres were determined at 0 and 3 dpi. No significant differences were observed at 0 dpi. Bars represent mean of four biological replicates ± SE. Differences between genotypes were analysed using ANOVA (Tukey’s HSD, p-value < 0.005). Similar results were obtained in three independent experiments. c The indicated genotypes were infected with Hpa EMWA1 and oomycete sporulation was quantified at 5 dpi. Data from three independent experiments were combined and differences between genotypes analysed using ANOVA (Tukey’s HSD, p < 0.005)
Fig. 4
Fig. 4
Delayed immune signalling in R493A mutant plants is independent of COR. a Four-week-old plants were infiltrated with 10 mM MgCl2 (mock), Pst AvrRps4 or Pst ∆Cor AvrRps4 and free SA was quantified at 8 hpi. Bars represent means ± SE of three biological replicates. Difference between genotypes were analysed using t-test (Bonferroni corrected, p < 0.05). Similar results were observed in three independent experiments. b A multi-dimension scaling (MDS) plot of differentially expressed genes showing R493A transcriptional changes at 8 (open symbols) and 24 hpi (closed symbols). Encircled samples of eds1-2 (pink) and R493A (purple) highlight transcriptional trends with and without bacterial COR in Pst AvrRps4-triggered immunity. c A heatmap depicting DEG at 8 and 24 hpi normalised to Col (p < 0.05) after hierarchical clustering. Samples were harvested at 8 and 24 hpi with Pst AvrRps4 (Avr) and Pst ∆Cor AvrRps4 (∆Cor). Cluster #17 contains genes that are upregulated at 8 hpi with Pst ∆Cor AvrRps4 but not Pst AvrRps4 in R493A only. Expansion (right) highlights a subset of NLR and WRKY genes in cluster #17 involved in immunity whose expression is antagonised by COR in R493A (see Supplementary Table 3). d Circos plot showing overlap of 383 genes in cluster #17 with genes regulated by JA and Benzothiadiazole (BTH, an analogue of SA) from other studies (Hickmann et al.,2017; Yang et al.,2017). Genes differentially expressed in cluster #17 and other datasets are marked by connecting lines. Genes repressed by JA and induced by BTH (red and green lines converging to yellow, 113); genes repressed by JA and not expressed by BTH (green lines, 19); genes induced by BTH and not expressed in JA dataset (red lines, 169)
Fig. 5
Fig. 5
a positive charge at EDS1R493 is essential for TNL immunity. RPP4 resistance phenotypes of 2-week-old control and Arabidopsis transgenic lines expressing cEDS1 and R493 mutants, as indicated. Hpa EMWA1 infected leaves were stained with trypan blue at 5 dpi. Scale bar represents 100 μm. Each image is representative of > 18 leaves from two independent experiments. HR, hypersensitive response; fh, pathogen free hyphae. b Four-week-old Arabidopsis plants of the indicated genotypes were infiltrated with Pst AvrRps4 and Pst ∆Cor AvrRps4 (OD600–0.0005). Bacterial titres were determined at 3 dpi. Bars represent means of three biological replicates ± SE. Differences between genotypes were analysed using ANOVA (Tukey’s HSD, p < 0.05). Similar results were obtained in three independent experiments. c Four-week-old plants were infiltrated with Pst AvrRps4 or Pst ∆Cor AvrRps4 and free SA was quantified at 8 and 24 hpi. Bars represent means ± SE of three biological replicates. Differences between genotypes within treatments were analysed using Student’s t-test (Bonferroni corrected, ***p < 0.05) relative to Col. Similar results were obtained in two independent experiments
Fig. 6
Fig. 6
EDS1R493 signals in TNL and CNL (RPS2) immunity. a Four-week-old Arabidopsis plants of the indicated genotypes were infiltrated with Pst DC3000 and Pst ∆Cor (OD600–0.0005). Bacterial titres were determined at 0 and 3 dpi. No significant difference was observed between lines and treatments at 0 dpi. Bars represent mean of four biological replicates ± SE. Differences between genotypes were analysed using ANOVA (Tukey’s HSD, p < 0.005). Similar results were obtained in three independent experiments. b Four-week-old Arabidopsis plants of the indicated genotypes were infiltrated with Pst ∆Cor AvrRps4 (OD600–0.0005). Bacterial titres were determined at 0 and 3 dpi. No significant difference was observed at 0 dpi. Bars represent mean of four biological replicates ± SE. Differences between genotypes were analysed using ANOVA (Tukey’s HSD, p < 0.005). Similar results were obtained in three independent experiments. c Four-week-old Arabidopsis plants of the indicated genotypes were infiltrated with Pst AvrRpt2 (OD600–0.0005). Bacterial titres were determined at 0 and 3 dpi. No significant difference was observed at 0 dpi. Bars represent mean of four biological replicates ± SE. Differences between genotypes were analysed using ANOVA (Tukey’s HSD, p < 0.005). Similar results were obtained in three independent experiments
Fig. 7
Fig. 7
A model of EDS1 signalling branches in RRS1S RPS4 ETI. A three-pronged ETI signalling model derives from comparisons of wild-type EDS1, EDS1R493A and eds1-2 phenotypes in this study. Three interconnected EDS1 outputs contribute to robust TNL ETI: (1) TNL-activated wild-type EDS1 effectively counters COR antagonism of immunity gene expression via MYC2. The defective EDS1 EP-domain mutant R493A is susceptible in TNL ETI against Pst AvrRps4 due to its inability to counter COR/MYC2 antagonism. (2) Wild-type EDS1 boosts SA accumulation independently of antagonising MYC2 while EDS1R493A delays SA accumulation (dashed lines) independently of COR repressive effects. (3) An additional EDS1 branch (X) in TNL (RRS1S RPS4) ETI is revealed after removing ICS1/SA and COR effects. The EDS1 EP-domain, and more specifically EDS1R493, is also required for this resistance branch. The nature of branch X requires further study

References

    1. Jacob F, Vernaldi S, Maekawa T. Evolution and conservation of plant NLR functions. Front. Immunol. 2013;4:297. doi: 10.3389/fimmu.2013.00297. - DOI - PMC - PubMed
    1. Jones JDG, Vance RE, Dangl JL. Intracellular innate immune surveillance devices in plants and animals. Science. 2016;354:aaf6395. doi: 10.1126/science.aaf6395. - DOI - PubMed
    1. Cui H, Tsuda K, Parker JE. Effector-triggered immunity: from pathogen perception to robust defense. Annu. Rev. Plant Biol. 2015;66:487–511. doi: 10.1146/annurev-arplant-050213-040012. - DOI - PubMed
    1. Zhang X, Dodds PN, Bernoux M. What do we know about NOD-like receptors in plant immunity? Annu. Rev. Phytopathol. 2017;55:205–229. doi: 10.1146/annurev-phyto-080516-035250. - DOI - PubMed
    1. Tao Y, et al. Quantitative nature of arabidopsis responses during compatible and incompatible interactions with the bacterial pathogen Pseudomonas syringae. Plant Cell. 2003;15:317–330. doi: 10.1105/tpc.007591. - DOI - PMC - PubMed

Publication types

MeSH terms