. 2019 Feb 15;10(1):790.
doi: 10.1038/s41467-019-08424-6.

Quantification of frequency-dependent genetic architectures in 25 UK Biobank traits reveals action of negative selection

Affiliations

Quantification of frequency-dependent genetic architectures in 25 UK Biobank traits reveals action of negative selection

Armin P Schoech et al. Nat Commun. .

Abstract

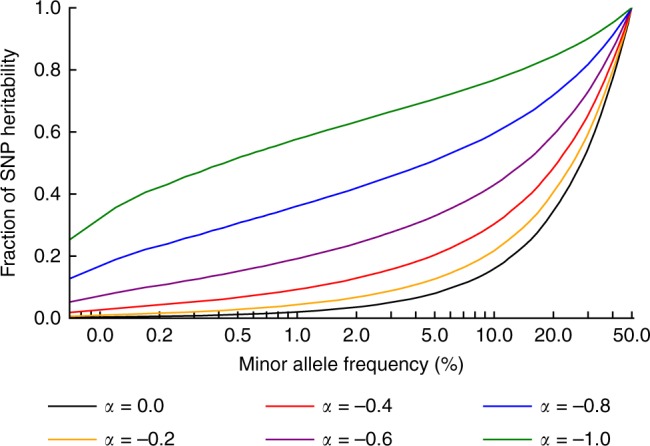
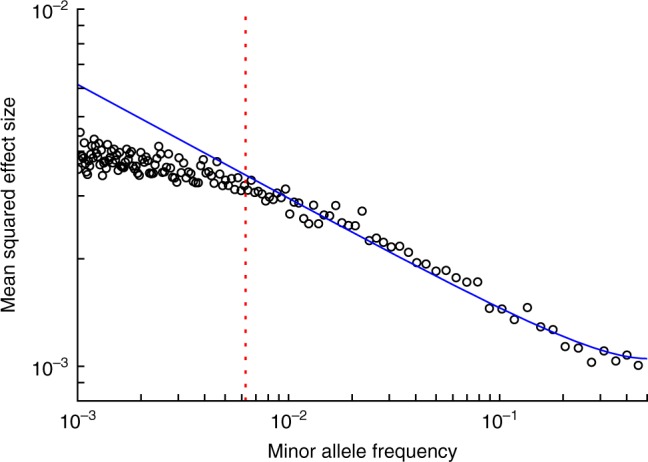
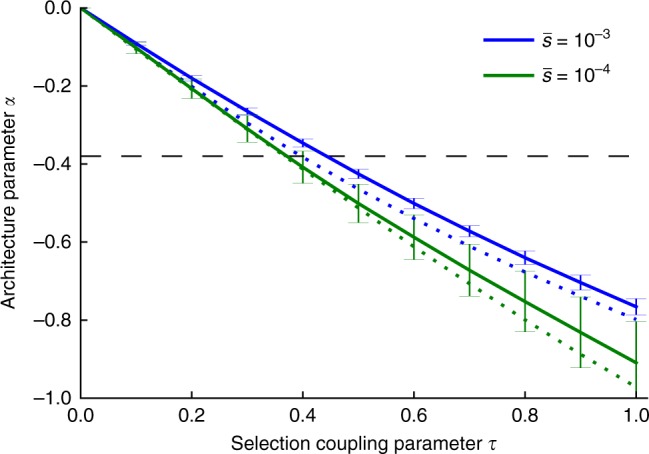
Understanding the role of rare variants is important in elucidating the genetic basis of human disease. Negative selection can cause rare variants to have larger per-allele effect sizes than common variants. Here, we develop a method to estimate the minor allele frequency (MAF) dependence of SNP effect sizes. We use a model in which per-allele effect sizes have variance proportional to [p(1 - p)]α, where p is the MAF and negative values of α imply larger effect sizes for rare variants. We estimate α for 25 UK Biobank diseases and complex traits. All traits produce negative α estimates, with best-fit mean of -0.38 (s.e. 0.02) across traits. Despite larger rare variant effect sizes, rare variants (MAF < 1%) explain less than 10% of total SNP-heritability for most traits analyzed. Using evolutionary modeling and forward simulations, we validate the α model of MAF-dependent trait effects and assess plausible values of relevant evolutionary parameters.


Conflict of interest statement

The authors declare no competing interests.

Figures

Fig. 1
Fig. 1
Fraction of SNP-heritability in different MAF ranges given α. We report the fraction of SNP-heritability explained by SNPs up to a certain MAF (x-axis), for different values of α. For example, assuming α = −0.4, SNPs with MAF ≤ 5% collectively explain about 20% of the total SNP-heritability. These results are based on the UK10K allele frequency spectrum and our model assumption that squared per-allele effects are proportional to [2p(1 − p)]α. Source data are provided as a Source Data file
Fig. 2
Fig. 2
MAF-dependence of SNP effects in evolutionary forward simulations. Forward simulations confirm that α model approximately holds above the MAF threshold T=k4Nes¯. We report simulated mean squared SNP effect sizes at a given MAF on a log-log plot, assuming τ = 0.4 and a genome wide selection coefficient distribution with mean s¯=10-3 and shape parameter k = 0.25. Data points represent the mean squared effect size of 1000 SNPs of similar MAF, calculated assuming Eq. (2). The blue curve represents mean squared effect sizes under the α model (Eq. 1) with α = −0.32, fitted to SNPs above the MAF threshold T. The MAF threshold T = 0.006 is indicated by a dotted red line. Source data are provided as a Source Data file
Fig. 3
Fig. 3
Value of α as a function of τ and other parameters in forward simulations. We report best-fit α estimates for simulations at each value of τ at a given genome-wide average selection coefficient s¯. Selection coefficients were sampled using a gamma distribution shape parameter of k = 0.25 (solid lines) or k = 0.125 (dotted lines). α estimates where calculated by fitting the model in Eq. (1) to simulated SNP effects above twice the MAF threshold 2T=k2Nes¯ (in order to avoid edge effects near T), with error bars representing standard errors calculated by bootstrap resampling of 25 independent SLiM2 simulations. The horizontal dashed line indicates α = −0.38, the best-fit α across the 25 UK Biobank traits. Results for a broader range of k values are reported in Supplementary Figure 5. Source data are provided as a Source Data file

References

    1. Pritchard JK. Are rare variants responsible for susceptibility to complex diseases? Am. J. Hum. Genet. 2001;69:124–137. doi: 10.1086/321272. - DOI - PMC - PubMed
    1. Gibson G. Rare and common variants: twenty arguments. Nat. Rev. Genet. 2012;13:135–145. doi: 10.1038/nrg3118. - DOI - PMC - PubMed
    1. Lee SH, et al. Estimating the proportion of variation in susceptibility to schizophrenia captured by common SNPs. Nat. Genet. 2012;44:247–250. doi: 10.1038/ng.1108. - DOI - PMC - PubMed
    1. Yang J, et al. Genetic variance estimation with imputed variants finds negligible missing heritability for human height and body mass index. Nat. Genet. 2015;47:1114–1120. doi: 10.1038/ng.3390. - DOI - PMC - PubMed
    1. Loh PR, et al. Contrasting genetic architectures of schizophrenia and other complex diseases using fast variance components analysis. Nat. Genet. 2015;47:1385–1392. doi: 10.1038/ng.3431. - DOI - PMC - PubMed

Publication types