. 2019 Jun;38(24):4875-4884.
doi: 10.1038/s41388-019-0750-5. Epub 2019 Feb 15.

Neurotensin and its receptors mediate neuroendocrine transdifferentiation in prostate cancer

Affiliations

Neurotensin and its receptors mediate neuroendocrine transdifferentiation in prostate cancer

Shimiao Zhu et al. Oncogene. 2019 Jun.

Erratum in

Abstract

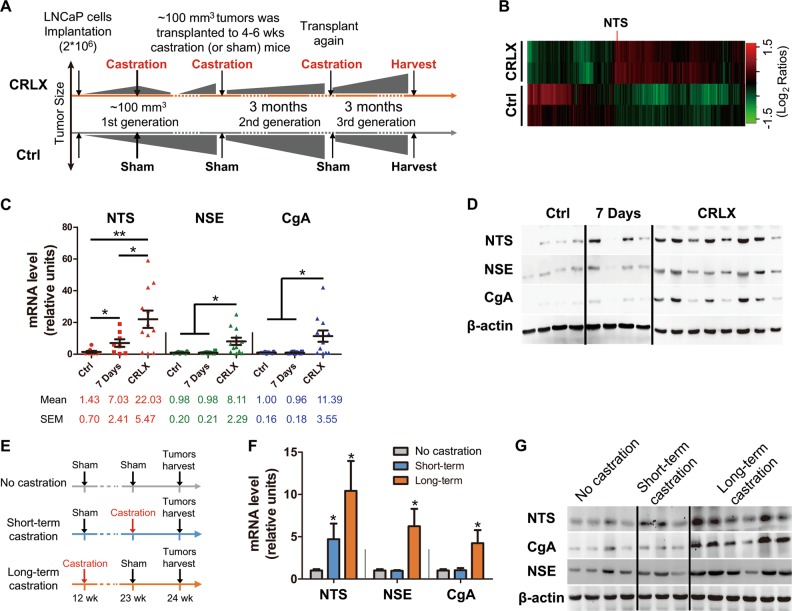
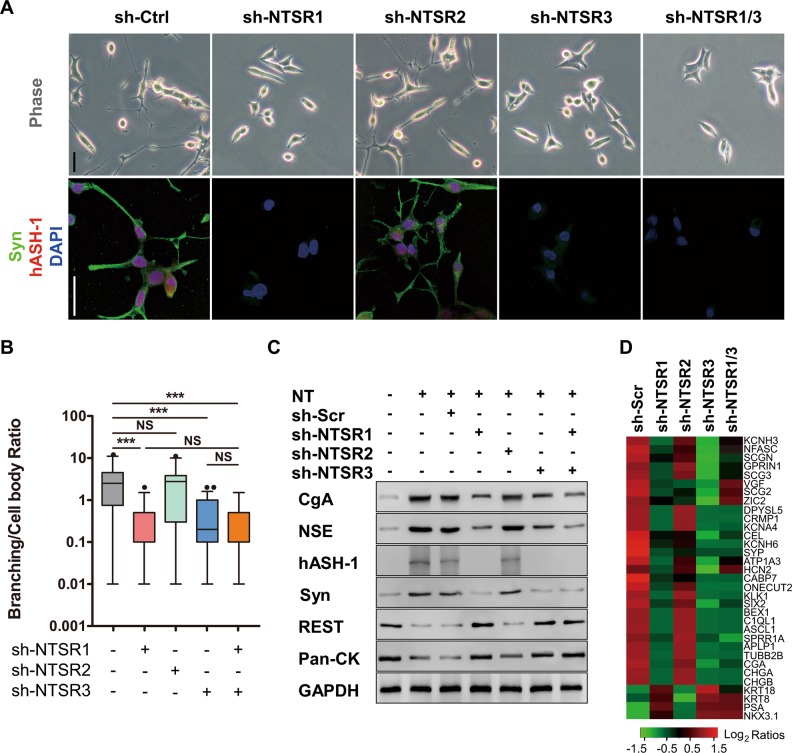
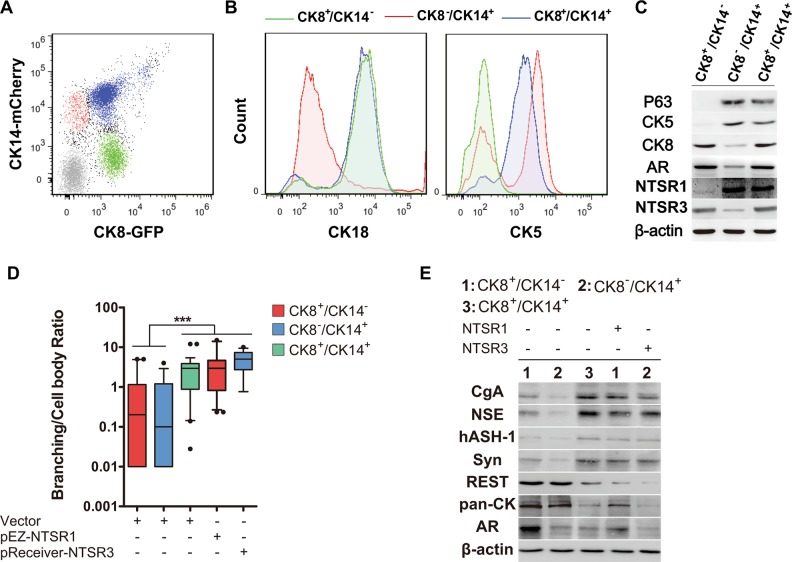
Castration-resistant prostate cancer (CRPC) with neuroendocrine differentiation (NED) is a lethal disease for which effective therapies are urgently needed. The mechanism underlying development of CRPC with NED, however, remains largely uncharacterized. In this study, we explored and characterized the functional role of neurotensin (NTS) in cell line and animal models of CRPC with NED. NTS was acutely induced by androgen deprivation in animal models of prostate cancer (PCa) and activated downstream signaling leading to NED through activation of neurotensin receptor 1 (NTSR1) and neurotensin receptor 3 (NTSR3), but not neurotensin receptor 2 (NTSR2). Our findings also revealed the existence of a CK8+/CK14+ subpopulation in the LNCaP cell line that expresses high levels of both NTSR1 and NTSR3, and displays an enhanced susceptibility to develop neuroendocrine-like phenotypes upon treatment with NTS. More importantly, NTSR1 pathway inhibition prevented the development of NED and castration resistance in vivo. We propose a novel role of NTS in the development of CRPC with NED, and a possible strategy to prevent the onset of NED by targeting the NTS signaling pathway.


Conflict of interest statement

The authors declare that they have no conflict of interest.

Figures

Fig. 1
Fig. 1
NTS expression is elevated in castration-resistant prostate cancer xenografts and correlated with neuroendocrine transdifferentiation. a Schematic illustrating the design of LNCaP mouse xenograft experiments. LNCaP cells were subcutaneously injected into BALB/c nude mice. Until tumors grew reached a size of ~100 mm3, xenografted mice were randomized to two groups: (1) castration-resistant LNCaP xenograft (CRLX), and control (Ctrl). Mice in CRLX group were castrated, while mice in control group received sham treatment until the first generation tumors were harvested after 2 months. Achieved tumors from above model were cut and minced to ~1 mm3, which were integrated to the size of about 100 mm3 by using matrigel and subcutaneously transplanted into the next generation of syngeneic mice. Repeating the circle process, the status of castration-resistant was determined until tumor in CRLX group grew faster than their reference. b Most differentially expressed genes in a cohort of CRLX (n = 8) compared to control (n = 4) determined by expression microarray analysis (Human Genome U133 Plus 2.0). The candidate genes were defined as fold change (CRLX vs. Ctrl) > 2 and false discovery rates (FDR) < 0.05. see also Supplementary Table 2. c qRT-PCR analysis of NTS, NSE, and CgA mRNA expression in a validation cohort of LNCaP tumors from mice treated with sham (control, n = 6), 7 days of castration (n = 6), or with acquired resistance to castration (n = 12). GAPDH used for normalization. d Western blot analysis of NTS, NSE, and CgA protein expression in a validation cohort of LNCaP tumors from mice treated with sham (control, n = 4), 7 days of castration (n = 4), or with acquired resistance to castration (n = 8). CRLX samples were loaded for analysis from high to low NTS levels based on mRNA analysis. e Schematic illustrating the design of TRAMP mice experiments. Mice were divided into three groups followed by receiving sham, short-term, or long-term surgical castration, then tumors were harvested at the same time. f qRT-PCR analysis of NTS, NSE, and CgA mRNA expression in primary tumors from uncastrated (n = 4), short-term (n = 3), and long-term (n = 6) castrated TRAMP mice. GAPDH used for normalization. g Western blot analysis of NTS, NSE, and CgA protein expression in a subset of tissues from uncastrated (n = 4), short-term (n = 3), and long-term (n = 6) castrated TRAMP mice. *p < 0.05, **p < 0.01
Fig. 2
Fig. 2
NTS induces neuroendocrine differentiation in prostate cancer cell lines. a Schematic illustration of the procedure inducing NE-like cells from prostate cancer cell lines. Before NTS treatment, cells were cultured in 1640 medium with CSS serum (charcoal stripped serum) for 2 weeks to mimic the castration conditions. Then, cells were induced by NTS or DMSO for 3 weeks (LNCaP cells) or 5 weeks (C4-2 cells). b Representative cell images in bright field of each group from different passages. c Quantification of branching/cell body ratio in each group from different passages. Branching/cell body ratio was determined for three microscopy fields, n = 171–242 total cell count. P values were evaluated by Mann–Whitney U test. d Bright field microscopy showed the cell morphology of parental, DMSO-treated (Ctrl), and NTS (4 ng/ml)-treated LNCaP cells (NT-L) on passage 3. Mag: magnification. e Branching/cell body ratio of individual cells from each group shown in (b) was calculated. P values were evaluated by Mann–Whitney U test. f Immunofluorescence double staining of helix-loop-helix transcription factors (hASH1) and synaptophysin (Syn) shows the NE-like phenotype in passage 3NT-L. g Immunofluorescence double staining of chromogranin A (CgA) and pan-cytokeratin (pan-CK) showed increased neuroendocrine marker and decreased epithelial cytokeratin marker in passage 3NT-L. h The differential expression of CgA, NSE, hASH1, Syn, and pan-CK in parental, DMSO-treated control, and passage 3NT-L groups was shown in Western blot assay. i Heat map representing expression changes in NED-related genes [23] in control and NT-L cells. Heat map was generated by conversion of qRT-PCR data that was normalized to β-actin and β2M. *p < 0.05, **p < 0.01, ***p < 0.001. See also Supplementary Fig. 1
Fig. 3
Fig. 3
NTSR1 and NTSR3 are required for NTS-stimulated NED in LNCaP cells. a LNCaP cells, which were transfected with indicated shRNA to NTSR1, 2, 3, 1+3 and shRNA control, were treated with NTS (4 ng/ml). The NE phenotypes were shown in bright field microscopy (upper panel) and in immunofluorescence assay of Syn/hASH1 double staining (lower panel). b Branching/cell body ratio of cells shown in (a) was quantified and plotted as box and whisker plots (branching/cell body ratio was determined for three microscopy fields, n = 97–125 total cell count). P values were evaluated by Mann–Whitney U test. ***p < 0.001. c Immunoblotting analysis of CgA, NSE and Syn, HASH1 and pan-CK expression in control, NTS-treated, and following NTSR1, 2 and 3 knockdown groups. d Heat map representing expression changes in NED-related genes in NTS (4 ng/ml)-treated LNCaP cells with NTSR1, 2 and 3 knockdown by indicated shRNAs. Heat map generated by conversion of qRT-PCR data that was normalized to β-actin and β2M. Data are representative of two independent experiments. See also Supplementary Fig. 2
Fig. 4
Fig. 4
Characterization of the CK8+/CK14+ cell population as the origin of NE-like cells. a FACS plots showed the distribution of LNCaP cells, based on expression of CK14 and CK8 and gates drawn to distinguish three populations. Cells were transfected with CK8-eGFP and CK14-mCherry, and three populations of CK8+/CK14, CK8/CK14+, and CK8+/CK14+ were separated. b Expression of CK18 and CK5 in the three cell populations distinguished above. c Characterization of the three cell populations distinguished in (b) by immunoblotting analysis of basal markers, CK5 and p63, and luminal markers, CK8 and AR. NTSR1 and NTSR3 were also determined. d Branching/cell body ratio was calculated in indicated cells received treatment of NTS (4 ng/ml) for 3 weeks. Branching/cell body ratio was determined in three microscopy fields, n = 112–146 total cell count. P values were evaluated by Mann–Whitney U test. e Immunoblotting analysis of CgA, NSE, Syn, hASH1, AR, and pan-CK in indicated cells received treatment of NTS (4 ng/ml) for 3 weeks. ***p < 0.001. See also Supplementary Fig. 3
Fig. 5
Fig. 5
Suppression of NED and castration resistance by NTSR1 antagonist. a LNCaP cells were injected subcutaneously in mice and grown until tumors reached a size of ~300 mm3 Xenografted mice were randomized and then, received PEG vehicle, 25 mg kg−1 SR48692, 10 mg kg−1 MDV3100, or SR48692+MDV3100 for 5 days a week. Caliper measurements were taken biweekly. n = 8 mice per group. P values were determined by comparing with control group. b Individual tumor weight in each group is shown. c LNCaP cells were injected subcutaneously in mice and grown until tumors reached a size of ~300 mm3 Xenografted mice were randomized and then, received PEG vehicle, 25 mg kg−1 SR48692, 10 mg kg−1 MDV3100, or SR48692+MDV3100 for 5 days a week. Representative images of Ki-67, TUNEL, and CgA in LNCaP xenograft tumors after different therapy, specimens were got at 20 weeks post treatment. d Quantitation of Ki-67, TUNEL, and CgA expressions in LNCaP xenograft tumors from each group, specimens were got at 20 weeks post treatment. Immunostained area/FOV (per field of view) was quantified using ImageJ. p values were evaluated by Mann–Whitney U test. *p < 0.05, **p < 0.01. See also Supplementary Fig. 4

References

    1. Azzouni F, Mohler J. Biology of castration-recurrent prostate cancer. Urol Clin North Am. 2012;39:435–52. doi: 10.1016/j.ucl.2012.07.002. - DOI - PubMed
    1. Friedlander TW, Ryan CJ. Targeting the androgen receptor. Urol Clin North Am. 2012;39:453–64. doi: 10.1016/j.ucl.2012.07.003. - DOI - PubMed
    1. de Bono JS, Logothetis CJ, Molina A, Fizazi K, North S, Chu L, et al. Abiraterone and increased survival in metastatic prostate cancer. N Engl J Med. 2011;364:1995–2005. doi: 10.1056/NEJMoa1014618. - DOI - PMC - PubMed
    1. Scher HI, Fizazi K, Saad F, Taplin ME, Sternberg CN, Miller K, et al. Increased survival with enzalutamide in prostate cancer after chemotherapy. N Engl J Med. 2012;367:1187–97. doi: 10.1056/NEJMoa1207506. - DOI - PubMed
    1. Scher HI, Sawyers CL. Biology of progressive, castration-resistant prostate cancer: directed therapies targeting the androgen-receptor signaling axis. J Clin Oncol. 2005;23:8253–61. doi: 10.1200/JCO.2005.03.4777. - DOI - PubMed

Publication types

MeSH terms