

Regional pulmonary effects of bronchoalveolar lavage procedure determined by electrical impedance tomography
- PMID: 30771111
- PMCID: PMC6377686
- DOI: 10.1186/s40635-019-0225-6
Regional pulmonary effects of bronchoalveolar lavage procedure determined by electrical impedance tomography
Abstract
Background: The provision of guidance in ventilator therapy by continuous monitoring of regional lung ventilation, aeration and respiratory system mechanics is the main clinical benefit of electrical impedance tomography (EIT). A new application was recently described in critically ill patients undergoing diagnostic bronchoalveolar lavage (BAL) with the intention of using EIT to identify the region where sampling was performed. Increased electrical bioimpedance was reported after fluid instillation. To verify the accuracy of these findings, contradicting the current EIT knowledge, we have systematically analysed chest EIT data acquired under controlled experimental conditions in animals undergoing a large number of BAL procedures.
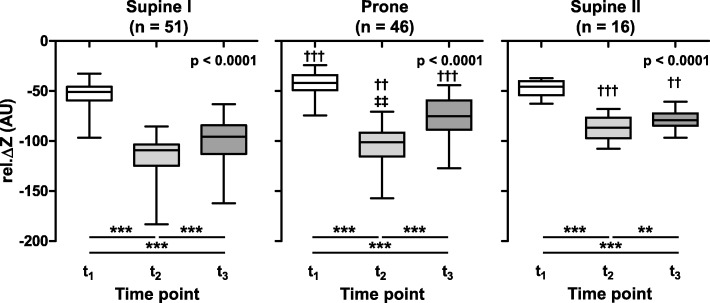
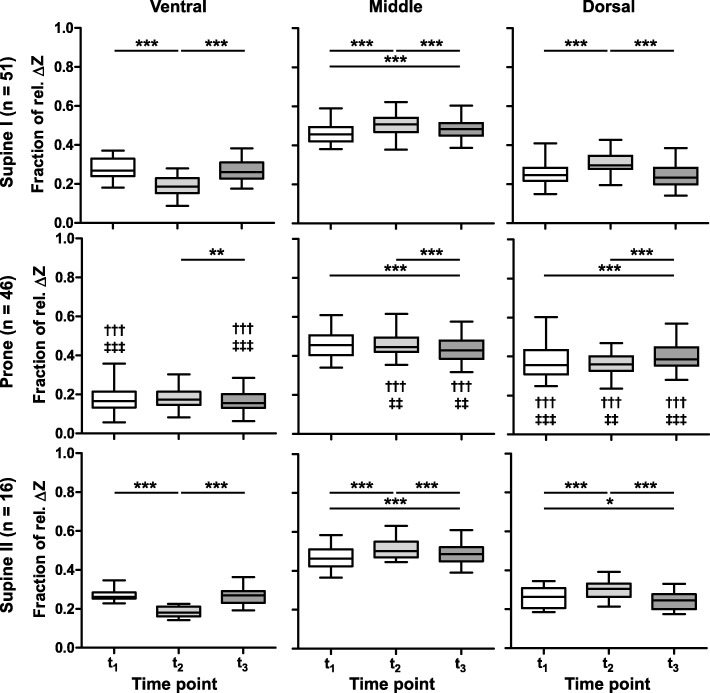
Methods: One hundred thirteen BAL procedures were performed in 13 newborn piglets positioned both supine and prone. EIT data was obtained at 13 images before, during and after each BAL. The data was analysed at three time points: (1) after disconnection from the ventilator before the fluid instillation and by the ends of fluid (2) instillation and (3) recovery by suction and compared with the baseline measurements before the procedure. Functional EIT images were generated, and changes in pixel electrical bioimpedance were calculated relative to baseline. The data was examined in the whole image and in three (ventral, middle, dorsal) regions-of-interest per lung.
Results: Compared with the baseline phase, chest electrical bioimpedance fell after the disconnection from the ventilator in all animals in both postures during all procedures. The fluid instillation further decreased electrical bioimpedance. During fluid recovery, electrical bioimpedance increased, but not to baseline values. All effects were highly significant (p < 0.001). The fractional changes in individual regions-of-interest were posture-dependent. The regional fall in electrical bioimpedance was smaller in the ventral and larger in the dorsal regions after the fluid instillation than after the initial disconnection to ambient pressure in supine animals (p < 0.001) whereas these changes were of comparable amplitude in prone position.
Conclusions: The results of this study show a regionally dissimilar initial fall in electrical bioimpedance caused by non-uniform aeration loss at the beginning of the BAL procedure. They also confirm a further pronounced fall in bioimpedance during fluid instillation, incomplete recovery after suction and a posture-dependent distribution pattern of these effects.
Keywords: Alveolar collapse; BAL; EIT; Electrical bioimpedance; Functional imaging; Regional ventilation; Ventilation monitoring.
Conflict of interest statement
Ethics approval and consent to participate
The study was approved by the Committee for Animal Care at the University of Geneva, Switzerland (protocol number 03-63, study approval number 31.1.1051/2230/I).
Consent for publication
NA
Competing interests
IF has received reimbursement of congress and speaking fees and travel costs from Dräger. The other authors declare that they do not have competing interests.
Publisher’s Note
Springer Nature remains neutral with regard to jurisdictional claims in published maps and institutional affiliations.
Figures


Similar articles
-
Non-invasive radiation-free monitoring of regional lung ventilation in critically ill infants.Intensive Care Med. 2001 Aug;27(8):1385-94. doi: 10.1007/s001340101021. Intensive Care Med. 2001. PMID: 11511953
-
Prolonged Continuous Monitoring of Regional Lung Function in Infants with Respiratory Failure.Ann Am Thorac Soc. 2022 Jun;19(6):991-999. doi: 10.1513/AnnalsATS.202005-562OC. Ann Am Thorac Soc. 2022. PMID: 34898392
-
Effect of Position Change From the Bed to a Wheelchair on the Regional Ventilation Distribution Assessed by Electrical Impedance Tomography in Patients With Respiratory Failure.Front Med (Lausanne). 2021 Nov 4;8:744958. doi: 10.3389/fmed.2021.744958. eCollection 2021. Front Med (Lausanne). 2021. PMID: 34805212 Free PMC article.
-
Electrical Impedance Tomography for Cardio-Pulmonary Monitoring.J Clin Med. 2019 Aug 7;8(8):1176. doi: 10.3390/jcm8081176. J Clin Med. 2019. PMID: 31394721 Free PMC article. Review.
-
Clinical implication of monitoring regional ventilation using electrical impedance tomography.J Intensive Care. 2019 Jan 18;7:4. doi: 10.1186/s40560-019-0358-4. eCollection 2019. J Intensive Care. 2019. PMID: 30680219 Free PMC article. Review.
Cited by
-
Electrical impedance tomography monitoring in adult ICU patients: state-of-the-art, recommendations for standardized acquisition, processing, and clinical use, and future directions.Crit Care. 2024 Nov 19;28(1):377. doi: 10.1186/s13054-024-05173-x. Crit Care. 2024. PMID: 39563476 Free PMC article. Review.
-
Electrical impedance tomography in perioperative medicine: careful respiratory monitoring for tailored interventions.BMC Anesthesiol. 2019 Aug 7;19(1):140. doi: 10.1186/s12871-019-0814-7. BMC Anesthesiol. 2019. PMID: 31390977 Free PMC article. Review.
-
A novel gelatinized barium sulfate injection method for assessment of bronchoalveolar lavage parameters.Clin Respir J. 2024 Jan;18(1):e13721. doi: 10.1111/crj.13721. Clin Respir J. 2024. PMID: 38286743 Free PMC article.
-
Bioimpedance measurements of fibrotic and acutely injured lung tissues.Acta Biomater. 2025 Mar 1;194:270-287. doi: 10.1016/j.actbio.2025.01.039. Epub 2025 Jan 25. Acta Biomater. 2025. PMID: 39870150
-
Evaluation of Regional Pulmonary Ventilation in Spontaneously Breathing Patients with Idiopathic Pulmonary Fibrosis (IPF) Employing Electrical Impedance Tomography (EIT): A Pilot Study from the European IPF Registry (eurIPFreg).J Clin Med. 2021 Jan 7;10(2):192. doi: 10.3390/jcm10020192. J Clin Med. 2021. PMID: 33430489 Free PMC article.
References
-
- Riedel T, Frerichs I. Electrical impedance tomography. Eur Respir Mon. 2010;47:195–205.
-
- Frerichs I, Amato MB, van Kaam AH, Tingay DG, Zhao Z, Grychtol B, Bodenstein M, Gagnon H, Bohm SH, Teschner E, Stenqvist O, Mauri T, Torsani V, Camporota L, Schibler A, Wolf GK, Gommers D, Leonhardt S, Adler A. Chest electrical impedance tomography examination, data analysis, terminology, clinical use and recommendations: consensus statement of the TRanslational EIT developmeNt stuDy group. Thorax. 2017;72:83–93. doi: 10.1136/thoraxjnl-2016-208357. - DOI - PMC - PubMed
LinkOut - more resources
Full Text Sources
